")
Back to Journals » Clinical Ophthalmology » Volume 18
A Comprehensive Evaluation of 16 Old and New Intraocular Lens Power Calculation Formulas in Pediatric Eyes
Authors Achiron A, Yahalomi T, Biran A, Levinger E, Cohen E , Elbaz U, Ali A, Mireskandari K, Tuuminen R , Voytsekhivskyy OV
Received 22 May 2024
Accepted for publication 25 July 2024
Published 8 August 2024 Volume 2024:18 Pages 2225—2238
DOI https://doi.org/10.2147/OPTH.S470425
Checked for plagiarism Yes
Review by Single anonymous peer review
Peer reviewer comments 2
Editor who approved publication: Dr Scott Fraser
Asaf Achiron,1 Tal Yahalomi,2 Amit Biran,1 Eliya Levinger,1 Eyal Cohen,1 Uri Elbaz,3 Asim Ali,4,5 Kamiar Mireskandari,4,5 Raimo Tuuminen,6,7 Oleksiy V Voytsekhivskyy8
1Tel Aviv Sourasky Medical Center, Tel Aviv, Israel and Sackler School of Medicine, Tel Aviv University, Tel Aviv, Israel; 2Department of Ophthalmology, Samson Assuta Ashdod Hospital and the Faculty of Health Sciences, Ben-Gurion University of the Negev, Be’er Sheva, Israel; 3Department of Ophthalmology, Rabin Medical Center, Petach-Tikva and Sackler School of Medicine, Tel Aviv University, Tel Aviv, Israel; 4Department of Ophthalmology and Vision Sciences, University of Toronto, Toronto, Ontario, Canada; 5Department of Ophthalmology and Vision Sciences, the Hospital for Sick Children, Toronto, Ontario, Canada; 6Helsinki Retina Research Group, Faculty of Medicine, University of Helsinki, Helsinki, Finland; 7Department of Ophthalmology, Kymenlaakso Central Hospital, Kotka, Finland; 8Kyiv Clinical Ophthalmology Hospital Eye Microsurgery Center, Kyiv, Ukraine
Correspondence: Oleksiy V Voytsekhivskyy, Kyiv Clinical Ophthalmology Hospital Eye Microsurgery Center, Komarov Ave. 3, Medical City, Kyiv, 03680, Ukraine, Tel +38067-584-28-11, Email [email protected]
Purpose: To compare the accuracy of 16 intraocular lens (IOL) power calculation formulas in pediatric cataract eyes.
Patients and Methods: The data records of pediatric patients who had been implanted with three IOL models (SA60AT, MA60AC, and enVista-MX60) between 2012 and 2018 were analyzed. The accuracy of 16 IOL power calculation methods was evaluated: Barrett Universal II (BUII), Castrop, EVO 2.0, Haigis, Hill-RBF 3.0, Hoffer Q, Hoffer QST, Holladay 1, Kane, LSF AI, Naeser 2, Pearl-DGS, SRK/T, T2, VRF, and VRF-G. The non-optimized (ULIB/IOLcon) and optimized constants were used for IOL power calculation. The mean prediction error (PE), Performance Index (FPI), and all descriptive statistics were calculated.
Results: Ninety-seven eyes of 97 pediatric patients aged 13.2 (IQR 11.2– 17.1) were included. No statistically significant difference (HS-test) was observed (p > 0.818) except for the Hoffer Q, and Naeser 2 (P = 0.014). With optimized lens constants, the best FPI indices were obtained by Hoffer Q (0.256) and VRF-G (0.251) formulas, followed by Hill-RBF 3.0 and BUII, with an index of 0.248. The highest FPI indices with non-optimized constants showed SRK/T and T2 formulas (0.246 and 0.245, respectively), followed by VRF-G and Holladay 1, with an index of 0.244. The best median absolute error values (MedAE) were achieved by Hoffer Q (0.50 D), VRF-G (0.53 D), and Hill-RBF 3.0 (0.54 D), all P ≥ 0.074.
Conclusion: Our results place the Hoffer Q, VRF-G, Hill-RBF 3.0, and BUII formulas as more accurate predictors of postoperative refraction in pediatric cataract surgery.
Keywords: IOL power, formulas, pediatric eyes, calculation, axial length
Introduction
Congenital cataracts account for up to 20% of childhood blindness worldwide, though prevalence varies geographically.1 Prevalence of visually significant cataracts is 3–4 to 10.000 live births in the United States.2 This rate is comparable to a UK study that found a prevalence of 3.18 per 10.000 people.3
Intraocular lens (IOL) power calculations in the pediatric age group are challenging. While in adults, up to 97.8% of eyes spherical equivalent (SE) refractions were within 1.00 diopter (D),4,5 in children, the prediction accuracy is significantly lower following surgery. Only 66.0% of eyes attain 1.00 D SE of the target refraction.6 Earlier reports in children that investigated the accuracy of previous-generation IOL formulas (Haigis, Hoffer Q, Holladay 1, Holladay 2, SRK/T, and T2) have found high absolute prediction errors.7–9 This inaccuracy is accentuated in shorter axial length eyes.
While newer-generation formulas such as the Barrett Universal II (BUII) Kane, Ladas Super Formula with AI improvements (LSF AI), and EVO 2.0 were evaluated in the pediatric population,9–11 other new formulas have never been studied (Castrop, EVO 2.0, Hill-RBF 3.0, Hoffer QST, Næser 2, Pearl-DGS, and the VRF-G). Many studies devoted to IOL power accuracy in the adult population were introduced. Recently, the authors compared 24 IOL power formulas. They found that newer formulas (Barrett Universal II, Hoffer QST, K6, Kane, Karmona, RBF 3.0, PEARL-DGS, and VRF-G) were the most accurate predictors of postoperative refractions.12 However, the accuracy of most of them is still unknown in pediatric cataract surgery. Pediatric eyes have discrepancies compared to adult patients. The axial length is usually shorter, corneal curvature is steeper, and problems related to cooperation exist. Moreover, ongoing ocular growth and structural differences in the anterior chamber make it difficult to predict the effective lens position and actual power of the IOL, respectively.
Therefore, our study aims to compare the accuracy of IOL power calculation formulas in the pediatric age group between 16 different formulas.
Materials and Methods
In this retrospective study, we reviewed all the charts of patients aged 6 months to 18 years old who underwent uneventful cataract extraction operations with in-The-bag IOL implantation between 2012 and 2018 at the Hospital for Sick Children (SickKids), Toronto, Ontario, Canada. The study was approved by the Institutional Research Ethics Board and adhered to the tenets of the Declaration of Helsinki (REB# 1000051744). A patient parental informed consent statement was obtained for each participant. Only one eye of each patient was randomly included in the analysis to reduce inter-eye correlation bias.13 In case of bilateral surgery, if both eyes were eligible, the right eye was included. All children have undergone manual retinoscopic refraction, with manifest refraction being recorded in verbal children for further statistical analysis at 1–3 months postoperatively.
Clinical Evaluation
Partial coherence interferometry (IOLMaster 500, Carl Zeiss Meditec AG, Jena, Germany) in cases of cooperative patient and immersion A-scan ultrasonography (Eye Cubed™, Ellex, Adelaide, Australia) with keratometry measurements ARK30 (Nidek Co. LTD, Aichi, Japan) were taken when cooperation was not appropriate or in the presence of dense cataracts. The axial length (AL), keratometry (K), anterior chamber depth (ACD, measured from corneal epithelium to lens), lens thickness (LT), and corneal diameter (CD) data were recorded. In challenging cases, custom-made plastic rings with prespecified diameters for CD measurements were also used. Only the eyes with one of three IOL models, SA60AT, MA60AC (Alcon Laboratories, Fort Worth, TX, USA), and enVista MX60 (Bausch & Lomb, Rochester, NY, USA), were included.
Inclusion and Exclusion Criteria
This investigation involved patients under 18 years and older than 6 months admitted to cataract surgery with in-The-bag IOL implantation with a postoperative follow-up of 1–3 months.
Exclusion criteria were the absence of any biometry data or postoperative refraction, planned or unplanned sulcus IOL implantation, eyes with traumatic cataract, chronic uveitis, lenticonus, previous corneal transplantation, and persistent fetal vasculature. Of the 190 charts of pediatric patients, 93 eyes were excluded due to different reasons, including the absence of some biometric values such as ACD, LT, or CD data and implantation of other types of IOL.
IOL Power Calculation
Biometric information was used to calculate the predicted target refraction separately for each of the following 16 IOL calculation formulas: Barrett Universal II (BUII),14 Castrop,15 EVO 2.0,16 Haigis,17 Hill-RBF 3.0,18 Hoffer Q,19 Hoffer QST,20 Holladay 1,21 Kane,22 LSF AI,23 Naeser 2,24 Pearl-DGS,25 SRK/T,26 T2,27 VRF,28 and VRF-G.29 Calculations for the BUII, Castrop, EVO 2.0, Hill-RBF 3.0, Hoffer QST, Kane, LSF AI, and Pearl-DGS formulas were performed by entering the biometry and the keratometry information into their online calculators (BUII, available at: http://calc.apacrs.org/barrett_universal2105/, accessed: September 9, 2023; Castrop (LPCM), available at: https://iolcon.org/lpcm.php, accessed: September 9, 2023; EVO (2.0), available at: http://www.evoiolcalculator.com, accessed on September 9, 2023; Hill-RBF 3.0, available at: http://www.rbfcalculator.com, accessed on September 9, 2023; Hoffer QST, available at: https://hofferqst.com/, accessed: September 9, 2023; Kane: available at https://www.iolformula.com, accessed: September 9, 2023; Ladas Super Formula with AI improvements (LSF AI), available at: http://www.iolcalc.com, accessed on September 9, 2023; Pearl-DGS, available at: http://www.iolsolver.com, accessed on September 9, 2023. Lens constants were set according to the online User Group for Laser Interference Biometry (ULIB) (available at: http://ocusoft.de/ulib/c1.htm, accessed September 9, 2023), and IOLCon (available at: https://iolcon.org/lensesTablephp, accessed on September 9, 2023) websites.
Prediction Error Calculations and IOL Constant Optimization
Predicted refractions for the Haigis, Hoffer Q, Holladay 1, Naeser 2, SRK/T, T2, VRF, and VRF-G formulas were calculated with the Excel software spreadsheet (Microsoft Office Professional Plus 2016, Microsoft Inc. Redmond, WA) programmed using the original publications and errata that had been verified previously against a large database from the IOLMaster biometer and followed all authors recommendations.16,18,20,23,25–28 The ULIB and IOLCon (Castrop formula) constants were initially set. Constant optimization is necessary to improve formula accuracy and reduce systematic erroring.29
The prediction error (PE) was calculated by subtracting the predicted refraction from the actual postoperative SE refraction. For the eight formulas (Haigis, Hoffer Q, Holladay 1, Naeser 2, SRK/T, T2, VRF, and VRF-G), IOL constant optimization was applied by adjusting the accordant constant to yield a zero PE for each eye and calculating the mean of all individual constants. For the Haigis formula, triple optimization was carried out by multiple linear regression with anterior chamber depth and AL. Since individual constant optimization was not possible for the non-published formulas, optimization was conducted by adjusting the PE for each eye by the amount equal to the mean PE of that formula, as described by Wang et al.30
Initially, the mean PE was calculated for each IOL using the ULIB/IOLCon constants as specified above. Then, the mean PE was subtracted from each PE to produce an adjusted PE. The average of the adjusted PEs yielded a zeroed mean PE. The mean and standard deviation (SD) of the PE, the median and mean absolute errors (MedAE and MAE, respectively), and the percentage of eyes with prediction errors within ± 0.25 D, ± 0.50 D, ± 0.75 D, ± 1.00 D, ± 1.50 D, and ± 2.00 D were calculated for all IOL formulas.
Statistical Analysis
SPSS (version 23.0, IBM Inc, Chicago, Illinois, USA) and the R Project 4.3.0 (R language and Environment for Statistical Computing, https://www.Rproject.org/) were used for statistical analyses. The Kolmogorov–Smirnov test tested the normality distribution of variables. Descriptive statistics are presented as a mean ± SD for normally distributed variables and as a median with interquartile range (IQR) for non-normal distributed variables. The heteroscedastic statistical method was applied as described by Holladay et al, with SD of the PEs as a parameter to evaluate formula performance.31 The one-way ANOVA test was used to evaluate the difference between the non-optimized PEs from 0. The absolute PEs were compared using Friedman’s ANOVA test. Dunn’s post-test was used for post hoc analysis in case of significant results. Cochran’s Q-test was used to compare the percentage of the eyes within the dioptric range indicated. The McNemar test for paired proportions was applied for significant results. P-values were adjusted with the Holm-Bonferroni correction method for multiple tests. A p-value < 0.05 was considered statistically significant. A minimum sample size of 78 eyes was calculated using the PS program (version 3.0.12; Dupont WD, 2012). A post hoc analysis (G*Power 3.1) of the whole data set with n=97, highest SD=1.58, lowest SD=1.32, and two tails yields a power of 0.68 for an alpha level of 0.05. This sample size would be necessary to detect a difference in an absolute error of 0.05 D with a power of 95% at a significance level of 5%, given a within-subject SD for keratometry equal to 0.08 D.32
Results
One hundred and ninety patients underwent primary IOL implantation, of which 93 patients were excluded from the study for various reasons. After exclusion, ninety-seven eyes of 97 children were analyzed. All participants had undergone cataract extraction surgery with in-The-bag posterior chamber IOL implantation. Demographic characteristics, relevant measurements used for calculation, distribution of IOL’s type, mean inserted IOL power, and median post-operative spherical error are presented in Table 1.
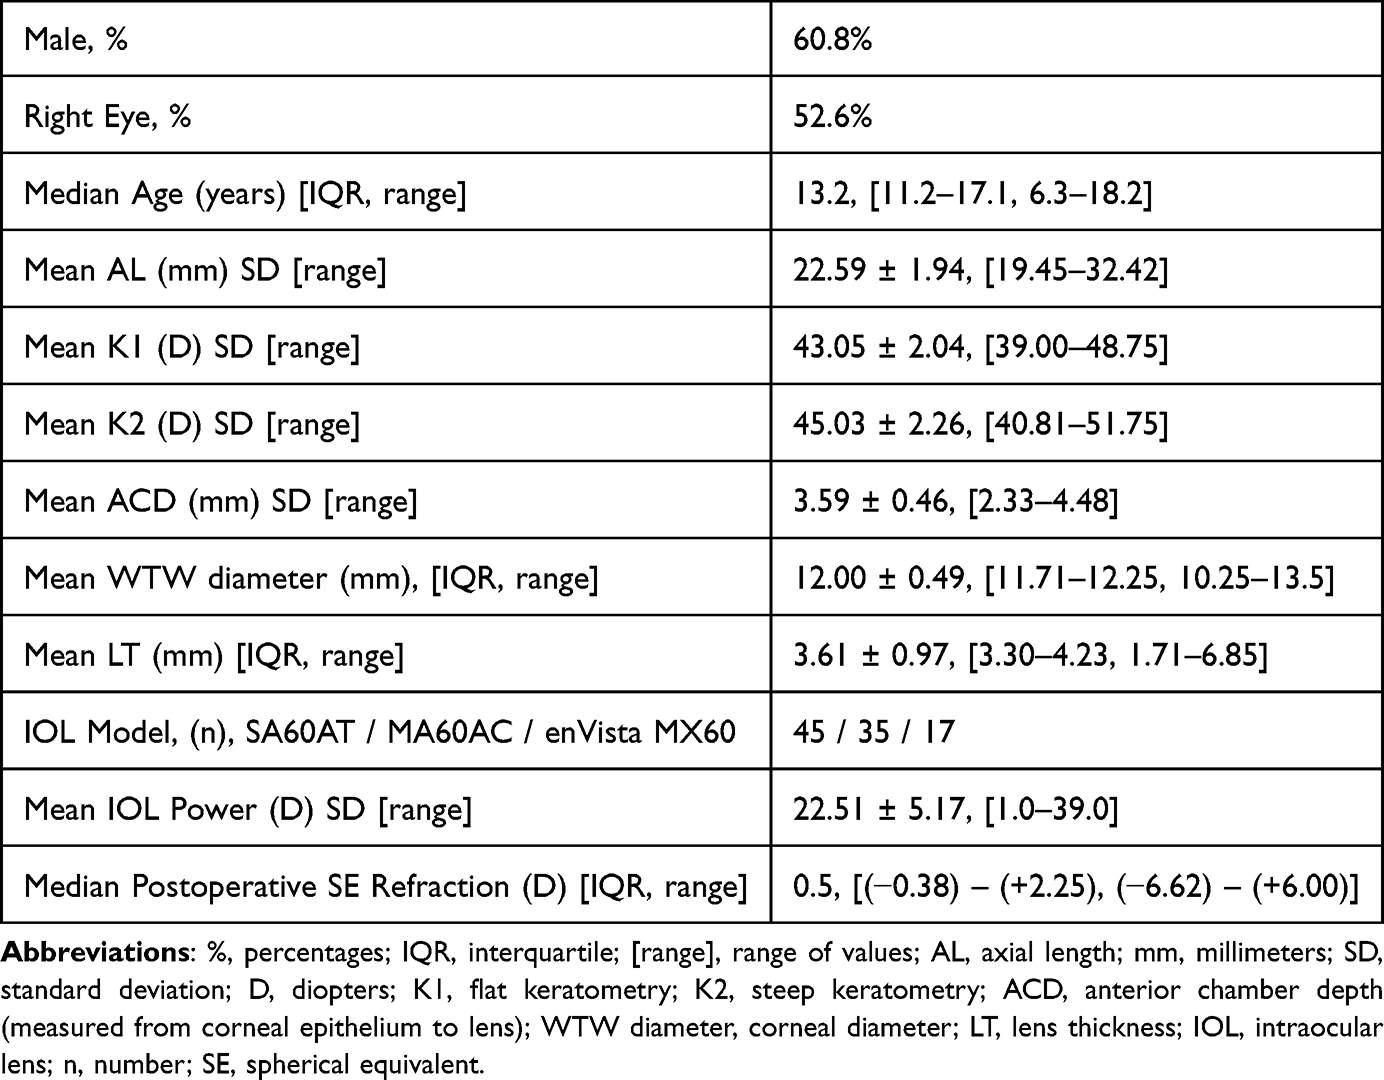 |
Table 1 Patient’s Characteristics, Biometry Measurements, the Implanted IOLs, and Postoperative Objective Spherical Equivalent Refraction |
Prediction Error: Optimized Constants
The highest percentages of eyes with a PE within ±0.25 D were represented with Hill-RBF 3.0 (29.9%), VRF-G (26.8%) and Naeser 2 (25.8%) formulas. The highest percentages of eyes with a PE within ±0.50 D were Hoffer Q (50.5%), VRF-G (48.5%), and BUII (48.5%) (Figure 1). Statistically significant differences were found between the formulas with a PE within ±0.50 D (p = 0.003) and ±1.50 D (p = 0.033). Rates of predictability within ±0.75 D, ±1.00 D, ±1.50 D, and ±2.00 D are presented in Table 2 and Figure 1.
 |
Figure 1 Stacked histogram comparing the percentage of cases with a given prediction error. Formulas are ranked according to the higher percentage for the prediction error within ≤ 0.50 D. The Hoffer Q, VRF-G, Barrett Universal II, and Hill-RBF 3.0 formulas had a significantly higher accuracy within ± 0.50 D compared with the other formulas. |
 |
Table 2 Intraocular Lens Power Calculation Predictability and Cumulative Percentage of Eyes with a Prediction Error Within ± 0.25, ± 0.50 D, ± 0.75, ± 1.00 D, ± 1.50 D, and ± 2.00 D from Target Refraction Using Non-Optimized and Optimized Constants for All IOL Formulas |
Absolute Prediction Errors: Optimized Constants
Analyzing absolute prediction errors (MedAE and MAE), Friedman’s ANOVA had no statistically significant differences among sixteen formulas (p > 0.074, Table 2). The lowest MedAE values were achieved by Hoffer Q (0.50 D), VRF-G (0.53 D), Hill-RBF 3.0 (0.54 D), and BUII (0.54 D) formulas, whereas the highest MedAEs were related to SRK/T (0.71 D), EVO 2.0 (0.66 D), LSF AI (0.66 D), and T2 (0.66 D) (Table 3).
Standard Deviations: Optimized Constants
The T2, SRK/T, and Hoffer Q formulas showed the lowest values of SD (1.32 D, 1.33 D, and 1.34 D, respectively). The heteroscedastic statistical analysis revealed a statistically significant difference in SD values only between the Hoffer Q and Naeser 2 formulas (p = 0.014). A comparison of all other formulas did not show any other statistically significant difference (p > 0.818), Table 4.
 |
Table 3 Median Absolute Predicted Error (MedAE) and Mean Absolute Predicted Error (MAE) for All IOL Formulas |
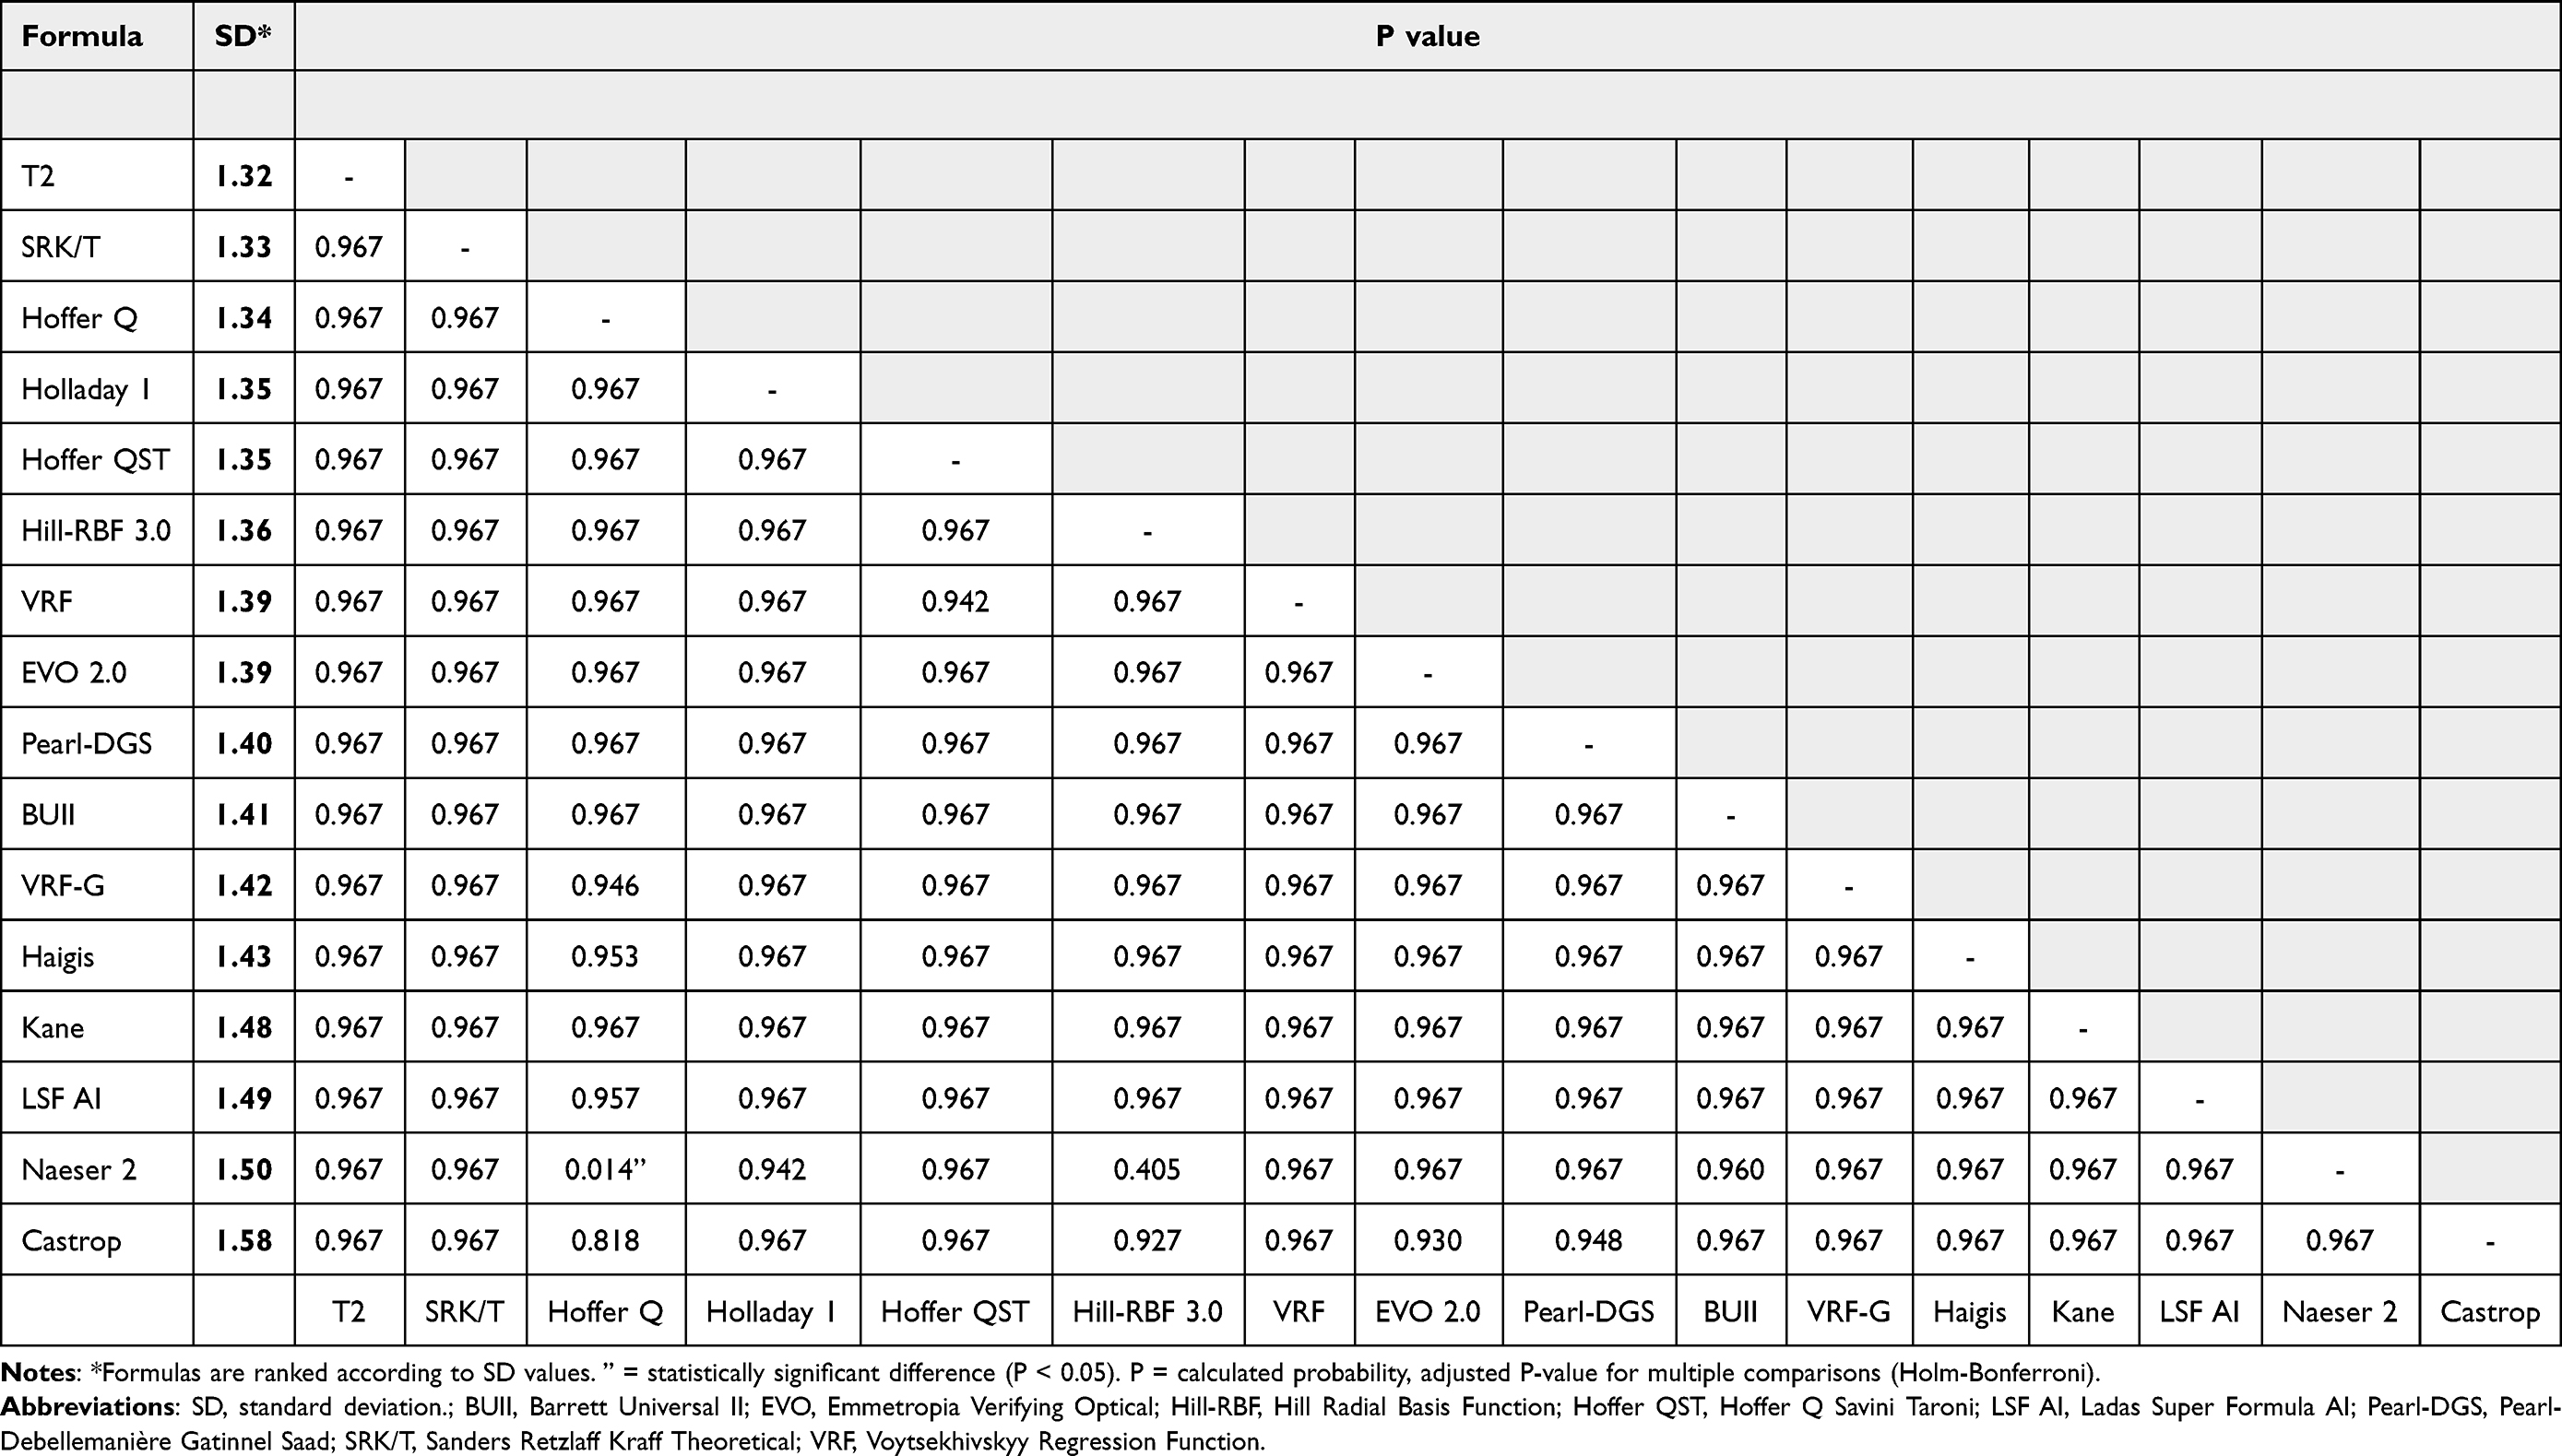 |
Table 4 Heteroscedastic Statistical Analysis by the SD of Prediction Errors |
Performance Indices: Optimized Constants
The Hoffer Q and VRF-G formulas exhibited the highest performance indices (0.256 and 0.251, respectively), followed by Hill-RBF 3.0 and BUII, with an index of 0.248.
IOL Power Calculation with Non-Optimized Constants
Prediction Error: Non-Optimized Constants
The results were generally concordant with the optimized predictability calculations. A statistically significant difference between the PE was found predominantly between Hoffer Q and Naeser 2 formulas (p = 0.027, HS test). Friedman’s ANOVA with Dunn’s post-hoc test observed significant differences between the Holladay 1 vs Haigis, LSF AI, Kane and Naeser 2 (p ≤ 0.001), Pearl-DGS vs LSF AI (p = 0.042), SRK/T vs Haigis, Kane and LSF AI (p ≤ 0.033), VRF-G vs Haigis, Kane, LSF AI and Naeser 2 (p ≤ 0.004) (Table 2).
Absolute Prediction Error: Non-Optimized Constants
The highest percentages of eyes with a PE within ±0.50 were VRF-G (43.3%), Holladay 1 (42.3%), and VRF (41.2%). The lowest MedAE values were achieved by VRF-G (0.59 D), SRK/T (0.61 D), and T2 (0.62 D) (Figure 2). A statistically significant difference in the percentage of eyes within ±0.50 D (p = 0.030), ±0.75 D (p = 0.012), ±1.00 D (p = 0.012), and ±2.00 D (p = 0.08) from target refraction was seen between the formulas (Table 2).
 |
Figure 2 Mean and median (marked with a horizontal line inside the plot box) predicted error (PE) and absolute predicted error (APE) for 16 intraocular lens calculation formulas. Plot boxes also show an interquartile range (25% to 75%). A statistically significant difference (heteroscedastic statistical test) was found predominantly between Hoffer Q and Naeser 2 formulas (p = 0.027). A statistically significant difference with non-optimized constants for the APE was found between the Holladay 1 vs. Haigis, LSF AI, Kane, and Naeser 2 (p ≤ 0.001), Pearl-DGS vs. LSF AI (p = 0.042), SRK/T vs. Haigis, Kane, and LSF AI (p ≤ 0.033), VRF-G vs. Haigis, Kane, LSF AI, and Naeser 2 (p ≤ 0.004). |
Standard Deviations: Non-Optimized Constants
The lowest SD values were obtained with T2 (1.31 D), SRK/T (1.32 D), and Hoffer QST (1.35 D). All formulas demonstrated a negative mean PE with a significant deviation from zero (p = 0.011), with Hill-RBF 3.0 as an exception (PE = 0.34 D).
Performance Indices: Non-Optimized Constants
The SRK/T and T2 formulas showed the highest performance indices (0.246 and 0.245, respectively), followed by VRF-G and Holladay 1, with an index of 0.244.
Discussion
Due to the physically younger ocular tissues, continued ocular growth, and other related anterior chamber structural differences, treating a cataract in a child differs from managing one in an adult. Because of both short- and long-term risks and the required long-term follow-up for effective management of related amblyopia, management can be difficult for a surgeon both during and after surgery. Additionally, children undergoing general anesthesia for keratometry have a loss of fixation, which results in inaccurate readings, which will result in relatively substantial refraction errors.33
Our study investigates the accuracy of sixteen IOL power calculation formulas in children undergoing cataract extraction surgery. This is the highest number of formulas investigated in one study reported to date, involving traditional thin-lens formulas and newly developed modern IOL power calculation methods based on paraxial ray tracing or AI algorithms. Our data show that the Hoffer Q, VRF-G, BUII, and Hill-RBF 3.0 performed better than other formulas investigated and achieved the lowest APE (MedAEs) with the highest percentage of eyes within ± 0.50 D. In addition, our results demonstrated that the ULIB/IOLCon constants are incompatible with IOL calculations in the pediatric population. This should be considered by clinicians in their pediatrician surgery, calling for adjustments while performing constants’ optimization.
Recently, Lin et al analyzed five intraocular lens power formulas in 110 Chinese children’s eyes with a mean age of 37.45 ± 23.28 months and AL 21.16 ± 1.29 mm.11 They showed that Barrett, Kane, and EVO 2.0 formulas were accurate in children older than 24 months with AL > 21mm, and EVO 2.0 and SRK/T formulas were relatively accurate in patients younger than 24 months and with AL ≤ 21 mm. Although we did not separate our data for age and AL due to a small number of patients, in our study, the SRK/T formula demonstrated a promising outcome with the lowest SD value (1.33 D). The SD of EVO 2.0 and Barrett were less predictable (1.39 D and 1.41 D). Based on SD values, the traditional vergence-based T2, SRK/T, and Hoffer Q formulas demonstrated superiority over modern methods. In our study, the lowest APE values (MedAE) were achieved by Hoffer Q (0.50 D) and two modern formulas, VRF-G (0.53 D) and Hill-RBF 3.0 (0.54 D). The authors did not include this method, so we cannot compare it.
A study by An-Nakhli et al of 44 eyes of 29 patients with median age at surgery of 2.85 years demonstrated the lowest MedAE with the SRK II (1.16 D), SRK/T (1.26 D), and Hoffer Q (1.27 D) formulas, while the highest values were obtained with the Holladay 2 (1.34 D), Olsen (1.34 D), and Haigis (2.00 D) formulas.34 The new Barrett, Olsen, and Holladay 2 formulas (MedAE 1.28 D, 1.34 D, and 1.34 D) were less accurate than the traditional SRK/T (MedAE 1.26 D) and Hoffer Q (MedAE 1.27 D). Those findings were in good accordance with our study, in which the Hoffer Q formula (MedAE 0.50 D) had the lowest absolute error value among the other 15 methods, and the SRK/T formula had the lowest value of SD (1.33 D).
Kou et al investigated the accuracy of five intraocular lens (IOL) power calculation formulas (SRK/T, Hoffer Q, Holladay 1, Haigis, and Holladay 2) for 75 patients of 102 pediatric eyes of different ages.35 They found that SRK/T (APE 1.13 D) and Holladay 1 (APE 1.27 D) formulas were relatively accurate in patients younger than 2 years old, while the Haigis formula (APE 0.87 D) performed better in patients older than 2 years. They did not analyze the modern formulas, so we could not compare their data with our findings. In our study, the Hoffer Q (MAE 0.88 D) formula was more precise than modern and traditional formulas and achieved the highest value of prediction error within ±0.50 D (50.5%).
Reitblat et al found a statistically significant difference in the prediction error between Hoffer Q and Haigis formulas in 62 children’s eyes (p = 0.039).10 Those findings were in good accordance with our study, in which the Hoffer Q formula (SD 1.34 D) had a statistically significant difference with the Naeser 2 (SD 1.50 D) formula. The Hoffer Q and BUII formulas provided the lowest MedAE (0.88 D and 0.88 D, respectively), whereas Holladay 1 (0.94 D) and Haigis (0.98 D) were less predictable. The Kane formula (MedAE 0.91 D) was less accurate than the Hoffer Q formula (MedAE 0.88 D). The results reported by this investigation are in good agreement with ours, as traditional formulas were the most accurate in children’s eyes.
A study by Rastogi et al investigated the five IOL power formulas in 99 eyes of 70 children 4 to 18 years old.36 The Hill-RBF 2.0, Barrett Universal II, Hoffer Q, SRK/T, and Holladay 1 formulas were analyzed. The MAEs were 1.08 ± 1.00 D for the Hill-RBF, 1.24 ± 1.20 D for the Barrett Universal II, 1.25 ± 1.06 D for the Hoffer Q, 1.25 ± 1.10 D for the SRK/T, and 1.28 ± 1.01 D for the Holladay 1 formulas. The Hill-RBF formula had the lowest MAE, which was significantly lower than the Holladay 1 and Hoffer Q formulas. However, the difference in MAE between the Hill-RBF and the SRK/T and Barrett Universal II formulas was not statistically significant (p > 0.05). The Hill-RBF 2.0 had the maximum percentage of eyes with residual error within ±0.50 D of the target refraction. In our investigation, the Hill-RBF 3.0 (MedAE 0.54 D) had the third lowest median absolute error value and second MAE (0.88 D) and outperformed all other formulas except Hoffer Q (MedAE 0.50 D and MAE 0.88 D).
Recently, Elbaz et al compared the Barrett Universal II formula with 4 traditional methods in 66 eyes of 66 children with a median age at surgery of 6.2 years.1 Overall, the Barrett had a comparable MedAE to the Hoffer Q, Holladay I, SRK/T, and Haigis formulas (BUII: 0.49D versus 0.48D, 0.61D, 0.74D and 0.58D respectively; p=0.205). The Hoffer Q, together with Barrett, produced better predictability within ±0.50 D from target refraction compared with the SRK/T formula (BUII:51.5%, Hoffer Q:51.5% versus SRK/T:31.8%, p=0.002). In our study, Hoffer Q showed a similar result with the best MedAE (0.50 D) and PE within ±0.50 D (50.5%). The BUII formula was less predictable (MedAE 0.54 D and 48.5%), being more precise than the other 15 methods with VRF-G (MedAE 0.53 D) and Hill-RBF 3.0 (MedAE 0.54 D) as exceptions.
There is no single metric to evaluate the accuracy of formulas. The different values, such as SD, MedAE, MAE, and percentage of eyes within ±0.50 D, were introduced. There is no agreement on what is more appropriate for the comparison of formula accuracy. The Formula Performance Index (FPI) that was proposed by Haigis calculates the weighted average of formula estimation.37 According to this methodology, the Hoffer Q and VRF-G formulas exhibited the highest performance indices (0.256 and 0.251, respectively), followed by Hill-RBF 3.0 and BUII, with an index of 0.248 with optimized lens constants and the SRK/T and T2 formulas showed the highest performance indices (0.246 and 0.245, respectively), followed by VRF-G and Holladay 1, with an index of 0.244 with non-optimized values. With both groups, the Hoffer Q, VRF-G, Hill-RBF 3.0, and BUII showed promising results and can be advocated for IOL power calculation in pediatric cataract eyes.
In this study, we have shown a systematic error of sixteen formulas using the optimized and non-optimized constants, gaining statistical significance with the Hoffer Q and Naeser 2 formulas (HS-test). Our findings demonstrated that the ULIB/IOLcon or the calculators’ built-in constants are not appropriate for IOL calculations in pediatric cataract surgery, and this should be considered by surgeons with the implementation of the correction factor for the systematic bias of the predicted error. Also, we estimated the formulas with the recommended IOL Formula Performance Index (FPI), along with the accepted comparison of PE, SD, MedAE, MAE, and other descriptive statistics.
There are some limitations to this study. We did not perform subgroup analyses based on age and axial length due to the small number of eyes and lack of statistical significance. Some limitations may be due to the age of the child patients studied; it should be noted that the accuracy of these formulas applies to a specific cohort of patients and may be the opposite in children of other age groups. Another limitation of this investigation emerges from the fact that we included both optical (PCI) and ultrasound-based (US) biometry. At the same time, the recently developed methods are optimized for optical biometry only. Thus, using a combination of both methods may further impact the accuracy.
Nonetheless, the practical implications of using the most accurate formulas in pediatric IOL calculations can lead to improved visual outcomes and long-term benefits for pediatric patients. It is of note that the variability of the capsular bag and the continuous change in refractive value in younger age groups bring additional considerations beyond the formulas themselves.
Finally, our results may only reflect our data set. Another study with a larger sample of pediatric eyes from different populations is needed to examine the predictive accuracy of current formulas in children undergoing cataract surgery, especially at younger ages with shorter axial lengths.
Conclusion
To the best of our knowledge, this is the only study that investigated the accuracy of sixteen traditional and newly developed intraocular lens power calculation methods in pediatric patients. Our study uncovered the performance of the majority of modern and commonly used clinical practice. This study shows that some of the modern formulas (VRF-G, Hill-RBF 3.0, and BUII) had better accuracy or were comparable to other investigated methods, except the Hoffer Q formula, which was found to be the best choice among all formulas. Notable, that the outcomes of the Hoffer Q were outstanding despite whether optimization of constants was performed or not. Additionally, this formula achieved the highest percentage of eyes with a predicted refraction within ±0.50 D.
In conclusion, the study provides valuable insights into the accuracy of various IOL power calculation formulas in pediatric patients. However, a more in-depth examination of age-related variability, clinical implications, and study limitations, along with more specific suggestions for future research, would strengthen the conclusions and allow for a more comprehensive understanding of the findings.
Disclosure
Dr. Voytsekhivskyy is the inventor and sole owner of the VRF and VRF-G formulas and has a patent on the method of estimation of postoperative lens position (ELP) and the calculation of optical power and is the author and copyright holder of a computer program VRF Suite V1.5. Dr Asim Ali reports grants, personal fees from Santen Inc., outside the submitted work. Dr Kamiar Mireskandari reports being on the Advisory Board from Bayer and Advisory Board and lecture fee from Santen Canada Ind, outside the submitted work. The authors report no other conflicts of interest in this work.
References
1. Elbaz U, Khalili S, Sella R, et al. Comparison of the Barrett universal II formula to previous generation formulae for paediatric cataract surgery. Acta Ophthalmol. 2022;100(6):682–689. doi:10.1111/AOS.15062
2. Holmes JM, Leske DA, Burke JP, Hodge DO. Birth prevalence of visually significant infantile cataract in a defined U.S. population. Ophthalmic Epidemiol. 2003;10(2):67–74. doi:10.1076/OPEP.10.2.67.13894
3. Rahi JS, Dezateux C; British Congenital Cataract Interest Group. Measuring and interpreting the incidence of congenital ocular anomalies: lessons from a national study of congenital cataract in the UK. Invest Ophthalmol Vis Sci. 2001;42(7):1444–1448.
4. Abulafia A, Barrett GD, Rotenberg M, et al. Intraocular lens power calculation for eyes with an axial length greater than 26.0 mm: comparison of formulas and methods. J Cataract Refract Surg. 2015;41(3):548–556. doi:10.1016/J.JCRS.2014.06.033
5. Cooke DL, Cooke TL. Comparison of 9 intraocular lens power calculation formulas. J Cataract Refract Surg. 2016;42(8):1157–1164. doi:10.1016/J.JCRS.2016.06.029
6. Nihalani BR, Vander Veen DK. Benchmarks for outcome indicators in pediatric cataract surgery. Eye. 2017;31(3):417–421. doi:10.1038/EYE.2016.240
7. Kekunnaya R, Gupta A, Sachdeva V, Rao HL, Vaddavalli PK, Om Prakash V. Accuracy of intraocular lens power calculation formulae in children less than two years. Am J Ophthalmol. 2012;154(1):13–19.e2. doi:10.1016/j.ajo.2011.11.031
8. Vasavada V, Shah SK, Vasavada VA, et al. Comparison of IOL power calculation formulae for pediatric eyes. Eye. 2016;30(9):1242–1250. doi:10.1038/eye.2016.171
9. Li J, Liu Z, Wang R, et al. Accuracy of intraocular lens power calculations in paediatric eyes. Clin Exp Ophthalmol. 2020;48(3):301–310.PMID: 31860154. doi:10.1111/ceo.13701.
10. Reitblat O, Khalili S, Ali A, et al. Evaluation of IOL power calculation with the Kane formula for pediatric cataract surgery. Graefes Arch Clin Exp Ophthalmol. 2022;260(9):2877–2885. doi:10.1007/s00417-022-05779-3
11. Lin L, Fang J, Sun W, et al. Accuracy of newer generation intraocular lens power calculation formulas in pediatric cataract patients. Graefes Arch Clin Exp Ophthalmol. 2023;261(4):1019–1027. doi:10.1007/s00417-022-05896-z
12. Voytsekhivskyy O, Hoffer KJ, Tutchenko L, Cooke DL, Savini G. Accuracy of 24 IOL power calculation methods. J Refract Surg. 2023;39(4):249–256. doi:10.3928/1081597X-20230131-01
13. Karakosta A, Vassilaki M, Plainis S, Elfadl NH, Tsilimbaris M, Moschandreas J. Choice of analytic approach for eye-specific outcomes: one eye or two? Am J Ophthalmol. 2012;153(3):571–579.e1. doi:10.1016/j.ajo.2011.08.032
14. Barrett GD. An improved universal theoretical formula for intraocular lens power prediction. J Cataract Refract Surg. 1993;19(6):713–720. doi:10.1016/s0886-3350(13)80339-2
15. Langenbucher A, Szentmáry N, Cayless A, et al. Considerations on the Castrop formula for calculation of intraocular lens power. PLoS One. 2021;16(6):e0252102. doi:10.1371/journal.pone.0252102
16. Yeo TK, Emmetropia Verifying Optical formula (EVO 2.0), Available from: http://www.evoiolcalculator.com.
17. Haigis W, Lege B, Miller N, Schneider B. Comparison of immersion ultrasound biometry and partial coherence interferometry for intraocular lens calculation according to Haigis. Graefes Arch Clin Exp Ophthalmol. 2000;238(9):765–773. doi:10.1007/s004170000188
18. Hill WE, Hill-RBF calculator version 3.0, Available from: https://rbfcalculator.com/.
19. Hoffer KJ. The Hoffer Q formula: a comparison of theoretic and regression formulas. J Cataract Refract Surg. 1993;19(6):700–712. doi:10.1016/s0886-3350(13)80338-0
20. Taroni L, Hoffer KJ, Pellegrini M, Lupardi E, Savini G. Comparison of the new Hoffer QST with 4 modern accurate formulas. J Cataract Refract Surg. 2023;49(4):378–384. doi:10.1097/j.jcrs.0000000000001126
21. Holladay JT, Musgrove KH, Prager TC, Lewis JW, Chandler TY, Ruiz RS. A three-part system for refining intraocular lens power calculations. J Cataract Refract Surg. 1988;14(1):17–24. doi:10.1016/S0886-3350(88)80059-2
22. Darcy K, Gunn D, Tavassoli S, Sparrow J, Kane JX. Assessment of the accuracy of new and updated intraocular lens power calculation formulas in 10 930 eyes from the UK national health service. J Cataract Refract Surg. 2020;46(1):2–7. doi:10.1016/j.jcrs.2019.08.014
23. Ladas JG, Siddiqui AA, Devgan U, Jun AS. A 3-D “super surface” combining modern intraocular lens formulas to generate a “super formula” and maximize accuracy. JAMA Ophthalmol. 2015;133(12):1431. doi:10.1001/jamaophthalmol.2015.3832
24. Næser K, Savini G. Accuracy of thick-lens intraocular lens power calculation based on cutting-card or calculated data for lens architecture. J Cataract Refract Surg. 2019;45(10):1422–1429. doi:10.1016/j.jcrs.2019.05.021
25. Debellemanière G, Dubois M, Gauvin M, et al. The PEARL-DGS formula: the development of an open-source machine learning–based thick IOL calculation formula. Am J Ophthalmol. 2021;232:58–69. doi:10.1016/j.ajo.2021.05.004
26. Retzlaff JA, Sanders DR, Kraff MC. Development of the SRK/T intraocular lens implant power calculation formula. J Cataract Refract Surg. 1990;16(3):333–340. doi:10.1016/S0886-3350(13)80705-5
27. Sheard RM, Smith GT, Cooke DL. Improving the prediction accuracy of the SRK/T formula: the T2 formula. J Cataract Refract Surg. 2010;36(11):1829–1834. doi:10.1016/j.jcrs.2010.05.031
28. Voytsekhivskyy OV. Development and clinical accuracy of a new intraocular lens power formula (VRF) compared to other formulas. Am J Ophthalmol. 2018;185:56–67. doi:10.1016/j.ajo.2017.10.020
29. Voytsekhivskyy OV. Accuracy of the VRF and VRF-G intraocular lens power calculation formulas using swept-source optical coherence tomography biometry. Clin Ophthalmol. 2023;17:3663–3672. doi:10.2147/OPTH.S439287
30. Wang L, Koch DD, Hill W, Abulafia A. Pursuing perfection in intraocular lens calculations: III. Criteria for analyzing outcomes. J Cataract Refract Surg. 2017;43(8):999–1002. doi:10.1016/j.jcrs.2017.08.003
31. Holladay JT, Wilcox RR, Koch DD, Wang L. Review and recommendations for univariate statistical analysis of spherical equivalent prediction error for IOL power calculations. J Cataract Refract Surg. 2021;47(1):65–77. doi:10.1097/j.jcrs.0000000000000370
32. Savini G, Taroni L, Schiano-Lomoriello D, Hoffer KJ. Repeatability of total Keratometry and standard Keratometry by the iolmaster 700 and comparison to total corneal astigmatism by Scheimpflug imaging. Eye. 2021;35(1):307–315. doi:10.1038/s41433-020-01245-8
33. Eibschitz-Tsimhoni M, Tsimhoni O, Archer SM, Del monte MA. Effect of axial length and keratometry measurement error on intraocular lens implant power prediction formulas in pediatric patients. J AAPOS. 2008;12(2):173–176. doi:10.1016/j.jaapos.2007.10.012
34. An-Nakhli FR. Accuracy of new and standard intraocular lens power calculations formulae in Saudi pediatric patients. Taiwan J Ophthalmol. 2019;9(1):37–42. doi:10.4103/tjo.tjo_71_18
35. Kou J, Chang P, Lin L, Li Z, Fu Y, Zhao Y. Comparison of the accuracy of iol power calculation formulas for pediatric eyes in children of different ages. J Ophthalmol. 2020; 2020:1–6. doi:10.1155/2020/8709375
36. Rastogi A, Singiri D, Kumar P, Thakar M, Baindur S, Bhardwaj A. Predictive accuracy of the hill-RBF 2.0 formula in pediatric eyes: comparison of 5 intraocular lens formulas. J Pediatr Ophthalmol Strabismus. 2023;60(4):282–287. doi:10.3928/01913913-20220811-01
37. Hoffer KJ, Savini G. Update on intraocular lens power calculation study protocols: the better way to design and report clinical trials. Ophthalmology. 2021;128(11):e115–e120. doi:10.1016/j.ophtha.2020.07.005
 © 2024 The Author(s). This work is published and licensed by Dove Medical Press Limited. The
full terms of this license are available at https://www.dovepress.com/terms.php
and incorporate the Creative Commons Attribution
- Non Commercial (unported, 3.0) License.
By accessing the work you hereby accept the Terms. Non-commercial uses of the work are permitted
without any further permission from Dove Medical Press Limited, provided the work is properly
attributed. For permission for commercial use of this work, please see paragraphs 4.2 and 5 of our Terms.
© 2024 The Author(s). This work is published and licensed by Dove Medical Press Limited. The
full terms of this license are available at https://www.dovepress.com/terms.php
and incorporate the Creative Commons Attribution
- Non Commercial (unported, 3.0) License.
By accessing the work you hereby accept the Terms. Non-commercial uses of the work are permitted
without any further permission from Dove Medical Press Limited, provided the work is properly
attributed. For permission for commercial use of this work, please see paragraphs 4.2 and 5 of our Terms.