")
Back to Journals » Journal of Inflammation Research » Volume 17
A Molecular Signature of the Ubiquitin-Proteasome System for Forecasting Prognosis in Thyroid Carcinoma Patients
Authors Zeng H, Geng X, Wan H, Qu X, Tang S, Zhang R, Zhou M, Yu Z, Pan J, Zheng H, Zhu Y, Huang S, Huang D
Received 8 October 2024
Accepted for publication 28 November 2024
Published 5 December 2024 Volume 2024:17 Pages 10397—10419
DOI https://doi.org/10.2147/JIR.S499820
Checked for plagiarism Yes
Review by Single anonymous peer review
Peer reviewer comments 2
Editor who approved publication: Dr Tara Strutt
Hong Zeng,1,2,* Xitong Geng,2,* Hao Wan,3,* Xiaoyu Qu,2 Shengwei Tang,2 Ruiyu Zhang,3 Minqin Zhou,2 Zichuan Yu,2 Jingying Pan,3 Hao Zheng,2 Yanting Zhu,2 Shuhan Huang,2 Da Huang1
1Department of Thyroid Surgery, Second Affiliated Hospital of Nanchang University, Nanchang, Jiangxi Province, People’s Republic of China; 2Second College of Clinical Medicine, Nanchang University, Nanchang, Jiangxi Province, People’s Republic of China; 3First College of Clinical Medicine, Nanchang University, Nanchang, Jiangxi Province, People’s Republic of China
*These authors contributed equally to this work
Correspondence: Da Huang, Department of Thyroid Surgery, Second Affiliated Hospital of Nanchang University, 1 minde Road, Nanchang, Jiangxi Province, 330000, People’s Republic of China, Email [email protected]
Background: The ubiquitin-proteasome system (UPS) is vital for protein quality control and its dysregulation is linked to diseases, including cancer. Targeting the UPS is becoming a promising approach in cancer therapy. However, the role of UPS modulation in thyroid carcinoma (THCA) remains to be fully elucidated.
Methods: Initially, we utilized data from The Cancer Genome Atlas (TCGA) database to employ weighted gene co-expression network analysis (WGCNA) with LASSO regression to develop a prognostic model for core UPS genes implicated in THCA. Subsequently, we stratified the THCA training set into two distinct subtypes based on ubiquitin-proteasome system prognostic model score (UPS-PMS) characteristics. Key genes within the model were then subjected to functional analysis, immunotherapy evaluation, and drug sensitivity studies.
Results: We delineated a prognostic model of the UPS comprising six genes, which we subsequently demonstrated was capable of forecasting patient prognosis. Moreover, our findings indicated a substantial correlation between UPS-PMS and immune microenvironmental factors, notably a negative correlation with myeloid immune cells and a potential influence on the Th1 to Th2 cells ratio. Especially, we observed a significant association between high UPS-PMS and an immunosuppressive microenvironment. Then, we elucidated the biological distinctions among various THCA sample subtypes, highlighting that the cluster_1 subtype is associated with an unfavorable prognosis. Of note, KCNA1 was identified as a pivotal prognostic gene within the UPS-PMS framework. We constructed a three-tiered regulatory network centered on KCNA1-related competing endogenous RNA (ceRNA). Furthermore, our results suggested that KCNA1 has potential as a target for immunotherapeutic strategies. Concurrently, drug sensitivity analyses demonstrated that high KCNA1 expression promoted gemcitabine resistance in patients, while KCNA1 knockdown increased sensitivity to gemcitabine.
Conclusion: In conclusion, we developed a novel UPS-based prognostic model for THCA, identified key gene KCNA1, and assessed immunotherapy and drug sensitivity, revealing new therapeutic targets.
Keywords: ubiquitin-proteasome system, thyroid carcinoma, prognostic model, immune microenvironment, drug sensitivity
Introduction
Thyroid carcinoma (THCA), the prevalent endocrine malignancy globally, has witnessed a steady escalation in its incidence over recent years, manifesting as an annual growth rate of approximately 4%.1–3 Despite the promising prognosis for most THCA patients following individualized treatment modalities such as surgery, radioactive iodine therapy, radiotherapy, systemic therapy, and personalized medical interventions, a subset of patients unfortunately succumbs to disease metastasis or recurrence.4–6 Consequently, unraveling the intricate molecular regulatory mechanisms underlying THCA and pinpointing novel therapeutic targets represent crucial milestones in the pursuit of innovative treatment strategies for this malignancy.
The ubiquitin-proteasome system (UPS) orchestrates the degradation of misfolded and aggregated proteins as well as the turnover of cellular proteins, thereby maintaining the homeostatic balance and functionality of organisms.7,8 This system encompasses ubiquitin (ub) activating enzymes (E1), ubiquitin conjugating enzymes (E2), ubiquitin ligases (E3), ubiquitin itself, and the 26S proteasome.9 It governs the degradation of approximately 80% of cellular proteins in eukaryotic cells and is integral to several fundamental cellular processes.10 Emerging research underscores the UPS’s involvement in a myriad of biological processes including the cell cycle, apoptosis, cell differentiation, autophagy, epigenetic regulation, angiogenesis, drug resistance, signal transduction, inflammation, and immune response.11,12 Dysregulation of UPS components through functional mutations or abnormal expression plays a role in a range of diseases, such as neurodegenerative disorders and various immune-related conditions.9 Notably, growing evidence links the UPS to the onset and progression of malignancies, positioning it as a potential target for cancer treatment. For instance, one study showed that the expression of the E3 ubiquitin ligase MYCBP2 is correlated with inflammatory cell infiltration and the prognostic outcomes of immunotherapy in patients with thyroid carcinoma.13,14 Since 2020, inhibitors of the UPS have been explored in clinical trials as potential anticancer agents.15 The combinatorial use of 26S proteasome inhibitors with other therapeutic agents has demonstrated encouraging outcomes in breast cancer treatment.16 Additionally, the proteasome inhibitor bortezomib has shown efficacy against anaplastic thyroid carcinoma. However, the functional roles and clinical implications of UPS-related genes in THCA remain to be comprehensively defined.17
In this study, we formulated a prognostic model for the central genes involved in the UPS. Following this, we stratified the THCA samples in the training set into two distinct subtypes based on UPS-PMS characteristics. Subsequent analyses identified KCNA1 as a pivotal prognostic gene within the UPS-PMS framework. Finally, we conducted comprehensive immunotherapy and drug sensitivity analyses to evaluate the therapeutic potential of targeting KCNA1.
Materials and Methods
Data Collection and Processing
We downloaded 512 thyroid carcinoma (THCA) tissues and 59 normal tissues from The Cancer Genome Atlas (TCGA) database18 (https://portal.gdc.cancer.gov), with file types in HTSEQ-FPKM. Among these, 507 thyroid carcinoma samples had clinical information. To ensure data completeness, we excluded samples lacking clinical data, resulting in 503 samples for clinical factor analysis. Additionally, the GSE29265 dataset was employed to validate the expression of genes within the prognostic model. All differential expression analyses were performed using the limma package.19 Based on previously published literature, we collected 797 ubiquitin proteasome system related genes, as shown in Supplemental Table 1.
Weighted Gene Co-Expression Network Analysis (WGCNA)
WGCNA20 is a robust bioinformatics framework that effectively aggregates highly correlated genes into modules and evaluates their associations with phenotypes. In this study, we utilized the R package (version 4.2.3) to analyze differentially expressed genes from TCGA-THCA. We determined power parameters using a soft threshold function, generated a cluster map through hierarchical clustering techniques, and constructed a module-trait association network. Modules were selected for further investigation based on Pearson’s correlation coefficients.
Functional Enrichment Analyses
Gene Ontology (GO)21 analysis is a commonly employed method for large-scale functional enrichment studies, encompassing biological processes, molecular functions, and cellular components. The Kyoto Encyclopedia of Genes and Genomes (KEGG)22 is a curated database resource that integrates diverse biological data across systematic, genomic, chemical, and health domains. Differentially expressed genes (DEGs) were annotated using GO and subjected to KEGG pathway enrichment analysis via the R package clusterProfiler. Statistical significance was set at a false discovery rate of < 0.05.
Gene expression data were analyzed using GSEA software (version 4.10) with the gene set database c2.cp.kegg.v7.4.symbols.gmt. Enrichment scores, p-values, and FDR-q values were computed. Criteria for inclusion in the enrichment evaluation required an FDR < 0.25 and p < 0.05.
Construction of UPS-Based Prognostic Model and Nomogram
We first identified DEGs across different clusters and selected intersecting DEGs for Lasso regression analysis. The glmnet R package facilitated this process, with lambda values adjusted to reduce the number of genes. A 10-fold cross-validation was used to build the model, with the optimal model selected based on lambda. The final risk score model was defined as Risk Score = Σ(exp_i * beta_i), where beta represents the multivariable coefficient, exp signifies expression levels, and i denotes the gene. A nomogram was constructed using the R package “rms”, incorporating clinical pathological features and core UPS-related genes.
Immune Characteristics Analyses
The single-sample Gene Set Enrichment Analysis (ssGSEA)23 method was used to assess the enrichment scores for 19 immune cell subtypes. This approach estimates immune cell abundance in individual samples based on overall marker genes, representing the relative proportions of each subtype as enrichment scores. Differences in immune cell proportions between groups were evaluated using the Wilcoxon rank-sum test. Additionally, the ESTIMATE algorithm was employed to assess stromal and immune infiltration. Statistical significance was determined with p-values less than 0.05.
Identification of Different UPS-Related Subtypes of THCA
Cluster analysis was conducted utilizing the R package “ConsensusClusterPlus”, a robust tool for consensus-based clustering. Through this analysis, we identified two distinct subtypes of the data. The optimal number of clusters (k) was identified using the cumulative distribution function (CDF), which allowed for an objective selection of the most appropriate k value.
Constructing Potential ceRNA Networks for KCNA1
To identify miRNAs potentially interacting with KCNA1, we employed TargetScanHuman 8.024 (http://www.targetscan.org) and DIANA-microT25 (http://diana.imis.athena-innovation.gr/DianaTools/index). Subsequently, miRNet 2.026 (https://www.mirnet.ca/miRNet/home) and starBase 3.027 (https://rnasysu.com/encori/) were used to predict and analyze the lncRNAs targeted by these miRNAs, facilitating the construction of a potential ceRNA network.
Drug Sensitivity Analyses
Connectivity Map (CMap)28 provides an open resource for exploring the relationships between diseases and potential targets using transcriptomic data. By comparing DEGs between low and high expression groups of KCNA1, we submitted these DEGs to CMap to identify potential therapeutic targets and drugs for THCA. The heatmap displays the top 50 compounds with the most negative predicted scores. Additionally, the R package “oncoPredict” was used to estimate the half-maximal inhibitory concentration (IC50) values of anti-cancer drugs for each tumor sample in TCGA-THCA, with sensitivity assessed through ridge regression analysis.
Molecular Docking Analysis
HDOCK29 (http://hdock.phys.hust.edu.cn/) is a widely utilized computing resource for molecular docking of DNA/RNA and protein-protein interactions. We utilized HDOCK for molecular docking modeling between KCNA1 and the drug gemcitabine. Subsequently, PyMOL (version 2.3.6)30 was used to remove water molecules and dissociate the original ligand from the core target protein, with the results being visualized.
Western Blotting
Cell lysates were prepared with RIPA buffer (Sigma-Aldrich) containing protease and phosphatase inhibitors. Cells were harvested, lysed in the buffer for 30 minutes, and then centrifuged for 15 minutes. Proteins (30 µg) were mixed with loading buffer and denatured at 95°C for 5 minutes. SDS-PAGE was performed on a 10% polyacrylamide gel, followed by transfer to a nitrocellulose membrane (Bio-Rad) using a wet transfer system at 100V for 1 hour. The membrane was blocked with 5% non-fat milk in TBST (Tris-buffered saline with 0.1% Tween 20) at room temperature for 1 hour. Primary antibodies (rabbit anti-KCNA1/Kv1.1 monoclonal antibody (1:1000; ab32433, Abcam) and anti-Tubulin monoclonal antibody (1:1000 dilution; Proteintech, 11224-1-AP)) were diluted in 5% BSA in TBST and incubated overnight at 4°C. After TBST washes, the membrane was incubated with HRP-conjugated secondary antibodies at room temperature for 1 hour. Protein bands were visualized with the ECL detection system and imaged using the Chemidoc XRS+ system (Bio-Rad). Band intensities were quantified using ImageJ software (NIH).
Cell Counting Kit-8 (CCK-8) Assay
The human thyroid carcinoma cell lines (Bcpap) were procured from the Shanghai Institute of Cell Biology (Shanghai, China). Cells were cultured in complete DMEM (with 10% FBS and 1% penicillin-streptomycin) at 37°C in a 5% CO2 incubator. For the CCK-8 assay, cells were seeded at 5×10³ cells per well in 96-well plates and allowed to adhere overnight. Following treatment with 100 μg of gemcitabine for 24, 48, or 72 hours, 10 µL of CCK-8 solution (Dojindo) was added to each well, and cells were incubated at 37°C for 2 hours. Absorbance was measured at 450 nm using a microplate reader (BioTek).
Half-Maximal Inhibitory Concentration (IC50)
To determine the IC50, the Bcpap cells were exposed to serially diluted gemcitabine. The viability data were analyzed using nonlinear regression to fit a dose-response curve, employing GraphPad Prism software. The IC50 value was derived from the curve as the concentration at which cell viability was reduced to 50% of the control.
Statistical Analyses
Bioinformatics, statistical analyses, and visualizations were carried out utilizing R software version 4.2.1. The Wilcoxon test was employed for comparing two groups, with statistical significance set at a P-value below 0.05. Pearson’s correlation coefficient was utilized for correlation assessments. Survival analysis was conducted with the survival and survminer packages in R, and Kaplan-Meier curves were generated for overall survival (OS). The Log rank test was used to assess differences in survival, with P-values <0.05 considered significant. Data were presented as mean ± standard deviation and analyzed using GraphPad Prism 8.0 software.
Results
Integrative Analysis Unveiled a Prognostic Model of Core Genes Associated with the UPS in THCA
To pinpoint critical genes in thyroid carcinoma (THCA), we analyzed differential expression data from TCGA-THCA, identifying 5854 genes with significant expression changes (p < 0.05) (Figure S1A). Among these, 3449 genes were upregulated and 2345 were downregulated. Furthermore, considering the vital role that Ubiquitin-proteasome system (UPS) plays in the development of THCA, we used a venn diagram and found 60 intersecting genes (26 upregulated and 34 downregulated) (Figure 1A and B). To further delineate the key genes, we conducted a weighted gene co-expression network analysis (WGCNA) using a soft threshold power of 7 to establish a scale-free network (Figure S1B). This analysis identified 16 gene co-expression modules through hierarchical clustering (Figure S1C). Following a comprehensive evaluation and screening process, four core modules were selected based on their significant association with THCA through gene expression patterns (Figure 1C). Subsequently, we employed a Venn diagram and successfully identified 28 DEGs by analyzing the intersection of the four key gene modules with the UPS (Figure 1D), which were entered into the LASSO-Cox regression model for further screening (Figure 1E and F). As a result, we successfully identified six candidate genes: potassium voltage-gated channel modifier subfamily S member 3 (KCNS3), deltex E3 ubiquitin ligase 4 [Homo sapiens (DTX4), zinc finger and BTB domain containing 21 (ZBTB21), potassium channel tetramerization domain containing 16 (KCTD16), potassium voltage-gated channel subfamily A member 1 (KCNA1), and F-box protein 15 (FBXO15), showing some degree of correlation with each other (Figure 1G). Concurrently, we determined the penalty coefficients for key genes using LASSO analysis and established a risk index by applying these coefficients to gene expression levels. The resulting formula for the ubiquitin-proteasome system prognostic model score (UPS-PMS) is as follows: UPS-PMS = (0.073 × KCNS3 exp) + (−0.008 × DTX4 exp) + (−0.221 × KCTD16 exp) + (0.463 × ZBTB21 exp) + (1.992 × KCNA1 exp) + (0.554 × FBXO15 exp). To explore the relationship between the six core genes and clinicopathologic features, including age, gender, T, M, N and pathological stage, we employed a heatmap analysis (Figure S1D). Our analysis revealed a notable similarity in the expression profiles of KCNS3 and DTX4, which exhibited higher expression levels in samples with more advanced clinical features, particularly in the T, M, and N staging parameters. In contrast, genes KCTD16, ZBTB21, KCNA1, and FBXO15 demonstrated a greater degree of expression similarity, with higher expression levels observed in samples with early clinical features according to T, M, and N staging. We identified six core genes associated with UPS in thyroid carcinoma and developed a prognostic model that predicts patient prognosis with high accuracy.
 |
Figure 1 Development of a prognostic model for UPS core genes in thyroid cancer. (A) Cross-over genes were found using Venn diagram. (B) A volcano plot identified 26 up-regulated and 34 down-regulated genes. (C and D) Weighted gene co-expression network analysis (WGCNA) was employed to pinpoint core modules and identify pivotal genes. (E and F) The prognostic model was formulated via LASSO-Cox regression. (G) Correlation analysis elucidated the interrelationships among the genes within the model (*p < 0.05, **p < 0.01, ***p < 0.001, ****p < 0.0001). |
The Development of a Novel Prognostic Assessment Tool UPS-PMS for THCA
Initially, samples were categorized into low and high UPS-PMS groups. To assess differences between these groups, we visualized patient survival times and statuses alongside the expression levels of the six core genes. This analysis revealed a notably higher incidence of mortality in the high UPS-PMS group. Additionally, gene expression analyses revealed a statistically significant upregulation of ZBTB21, KCTD16, KCNA1, and FBXO15 in the high UPS-PMS group compared to the low UPS-PMS group. Conversely, the expression levels of KCNS3 and DTX4 were significantly reduced in the high UPS-PMS group (Figure 2A). Subsequent survival analysis demonstrated that patients in the high UPS-PMS group had a significantly poorer prognosis compared to those in the low UPS-PMS group (Figure 2B). Receiver operating characteristic (ROC) curve analysis was employed to assess the sensitivity and predictive specificity of the risk scores. The area under the curve (AUC) values, specifically 0.764, 0.913, and 0.831 (Figure 2C), established UPS-PMS as a notable prognostic indicator for patients with THCA. Following that, we conducted the univariate and multivariate Cox regression analyses which demonstrated that UPS-PMS was an independent prognostic factor for THCA (Figure 2D and E). Furthermore, among the numerous clinicopathologic characteristics, gender and stage exhibited significant differences between the UPS-PMS high and low groups as shown in Table 1. The results were integrated into the nomogram, which also included other clinicopathological characteristics, namely age, gender, tumor stage, and T, M, and N classification. The integration of these variables facilitates accurate risk stratification and prognostic assessment of THCA, in line with personalized medicine by integrating comprehensive clinical and biomarker panels (Figure 2F). In the calibration plot, the nomogram-predicted result is in close alignment with the reference line, which suggests that the prediction nomogram is an optimal predictive model (Figure 2G). In conclusion, we successfully developed and validated a novel ubiquitin-proteasome system-based prognostic assessment tool for thyroid carcinoma, which provides accurate risk assessment and prognostic prediction for personalized medicine.
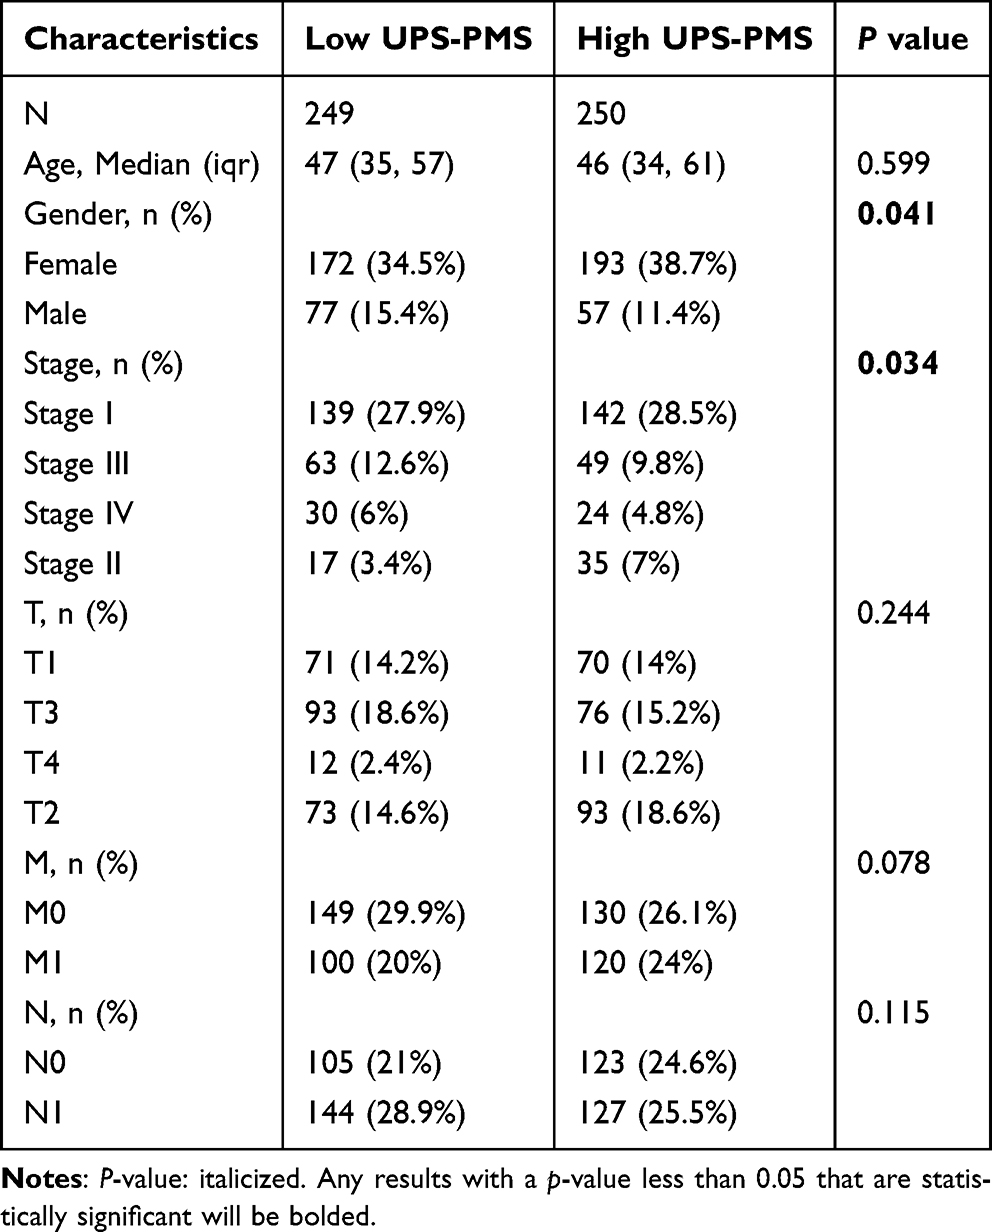 |
Table 1 Difference in Clinicopathological Characteristics Between High and Low UPS-PMS Groups |
 |
Figure 2 Development of a thyroid cancer prognosis assessment tool. (A) Survival time and status of patients in the high-UPS-PMS and low-UPS-PMS groups, and visualization of the expression of six core genes. (B) Survival analysis and (C) ROC curve analysis were performed between high-UPS-PMS group and low-UPS-PMS group. (D and E) Univariate and multivariate Cox regression analysis of UPS-PMS. (F) Prediction nomogram and (G) calibration curve of the model. |
Association Analysis of UPS-PMS with Immune and Cancer Progression Pathways in THCA Patients
To elucidate the biological functions of DEGs, we utilized volcano plot to visualize gene expression variations between the high and low UPS-PMS groups. This analysis identified 2371 genes with significant upregulation and 3482 genes with downregulation (Figure 3A). Top 100 most upregulated and downregulated genes were shown in Figure 3B. To elucidate the pathways enriched in THCA patients with high versus low UPS-PMS, we performed Gene Ontology (GO) and Kyoto Encyclopedia of Genes and Genomes (KEGG) analyses with pathway annotation shown in Supplementary Tables 2 and 3. Downregulated genes were predominantly associated with immune-related pathways, including antigen processing and presentation, lymphocyte-mediated immunity, MHC protein complex, T cell receptor binding, and Th1/Th2 cell differentiation. In contrast, upregulated genes were primarily linked to ubiquitination and cancer progression pathways, such as ubiquitin-dependent ERAD, positive regulation of protein ubiquitination, ubiquitin ligase binding, vascular endothelial growth factor receptor binding, and TGF-beta signaling (Figure 3C and D). Additionally, Gene Set Enrichment Analysis (GSEA) demonstrated that UPS-PMS was negatively correlated with the innate immune system, infectious disease response, IL-18 signaling, translation, and natural killer cell-mediated cytotoxicity and so on (Figure 3E and F). Taken together, these pathways involve immune responses, cell-cell interactions, and protein degradation and are central to cancer progression and immune regulation.
 |
Figure 3 Pathway enrichment analysis of differential genes in UPS-PMS. (A) A volcano plot visualized the differential expression patterns between the high and low UPS-PMS groups. (B) The expression profiles of the top 100 most significantly differentially expressed genes were depicted. (C) Gene ontology (GO), (D) Kyoto Encyclopedia of Genes and Genomes (KEGG) and (E and F) gene set enrichment analysis (GSEA) were harnessed to uncover the primary enriched pathways associated with the differential genes. |
Associations Between Immune Cell Heterogeneity and UPS-PMS in THCA
To investigate the relationship between risk groups and immune cell profiles, we utilized the single-sample Gene Set Enrichment Analysis (ssGSEA) algorithm to assess immune cell enrichment within the tumor microenvironment. The heatmap (Figure 4A) illustrated the distribution of various immune cells across samples and their association with UPS-PMS. The correlation analysis revealed a negative correlation between UPS-PMS and T cells (r = −0.516, p = 1.43e-08), helper T cells (r = −0.245, p < 0.001), and Th2 cells (r = −0.583, p < 0.001), while showing a positive correlation with NK cells (r = 0.530, p < 0.001), DC cells (r = 0.367, p < 0.001), Th1 cells (r = 0.430, p < 0.001), and macrophages (r = 0.436, p < 0.001) (Figure 4B). Additionally, ESTIMATE algorithm analysis demonstrated that the Immune Score and ESTIMATE Score were negatively correlated with UPS-PMS, with the low UPS-PMS group exhibiting higher scores. The Stromal Score, however, did not show a significant correlation with UPS-PMS (Figure 4C). Next, we examined immune cell infiltration in the samples, revealing distinct levels of immune infiltration between high and low UPS-PMS groups (Figure 4D). Furthermore, it was observed that immune cells in the high UPS-PMS group exhibited a greater degree of interconnectivity compared to the low-UPS-PMS group. This phenomenon may be indicative of enhanced synergism between immune cells in the context of high UPS-PMS tumor development (Figure 5A). Moreover, the expression of six immune checkpoints was consistently elevated in the low UPS-PMS group compared to the high UPS-PMS group (p < 0.05). Subsequent studies revealed a negative correlation between immune checkpoint expression and UPS-PMS (Figure 5B–G). By examining the immune microenvironment, the poor prognosis of patients with high UPS-PMS thyroid carcinoma may be associated with immunosuppression. This suggests the potential for new immunotherapy strategies.
 |
Figure 4 The heterogeneity of immune cells and their correlations with UPS-PMS. (A) Immune infiltration levels of 18 immune cells in high-UPS-PMS group vs low-UPS-PMS group. The higher or lower the Immune infiltration, the darker the color (red is high infiltration level and blue is low infiltration level), (B) Lollipop plot illustrating the correlation of UPS-PMS with various immune cells. Stem length denotes correlation magnitude, with greater green saturation indicating stronger associations. Circle size at stem termini represents P-value significance, where smaller circles denote higher statistical relevance, (C) The scatterplot depicts the relationship between UPS-PMS and ImmuneScore, StromalScore, and ESTIMATEScore, with a straight line fitting the overall correlation. The box plots visualize the differences in the above three scores between the high and low UPS-PMS groups, (D) Box plots delineate immune infiltration disparities among immune cell types between high- and low-UPS-PMS groups (*p < 0.05, ***p < 0.001). |
 |
Figure 5 The level of immune cell connectivity and checkpoint expression suggests the potential for immunotherapy. (A) Heatmap of Mantel correlations between UPS-PM core gene expression and the infiltration scores of 18 immune cells in high- and low-UPS-PMS group, (B-G) Scatter plots reveal the associations between the expression of six immune checkpoints and UPS-PMS levels, while box plots highlight the expression disparities of these checkpoints across high and low UPS-PMS groups (*p < 0.05, **p < 0.01, ***p < 0.001). |
Identification and Clinical Implications of UPS-PM-Related Subtypes in THCA
Using consensus clustering based on the expression levels of six key UPS-PM genes in THCA samples, we classified the 503 samples into two distinct subtypes (cluster_1 and cluster_2) with the optimal K-value of 2 (Figure 6A–C). Cluster_1, comprising 252 patients, exhibited higher UPS-PMS levels compared to cluster_2, which included 251 patients (Figure 6D). Survival analysis indicated that patients in cluster_2 had significantly better outcomes than those in cluster_1 (Figure 6E). By combining subtypes with UPS-PMS co-analysis, we discovered that cluster_1, which exhibited a high UPS-PMS, demonstrated the poorest survival outcome. Conversely, cluster_2, which displayed a low UPS-PMS, exhibited the most favorable survival outcome (Figure 6F). To further explore the differences between the two isoforms, we investigated clinical pathologies and found characteristic N, M, stage showed evident difference (Figure 6G–I) while gender and T had no significant variations (Table 2). Our findings indicate that cluster_1 exhibited significantly elevated UPS-PMS and were associated with a higher prevalence of terminal N and M stages and overall staging. In contrast, cluster_2 demonstrated lower UPS-PMS and a more favorable prognosis, exhibiting earlier clinicopathologic features compared to cluster_1 (Figure 6J).
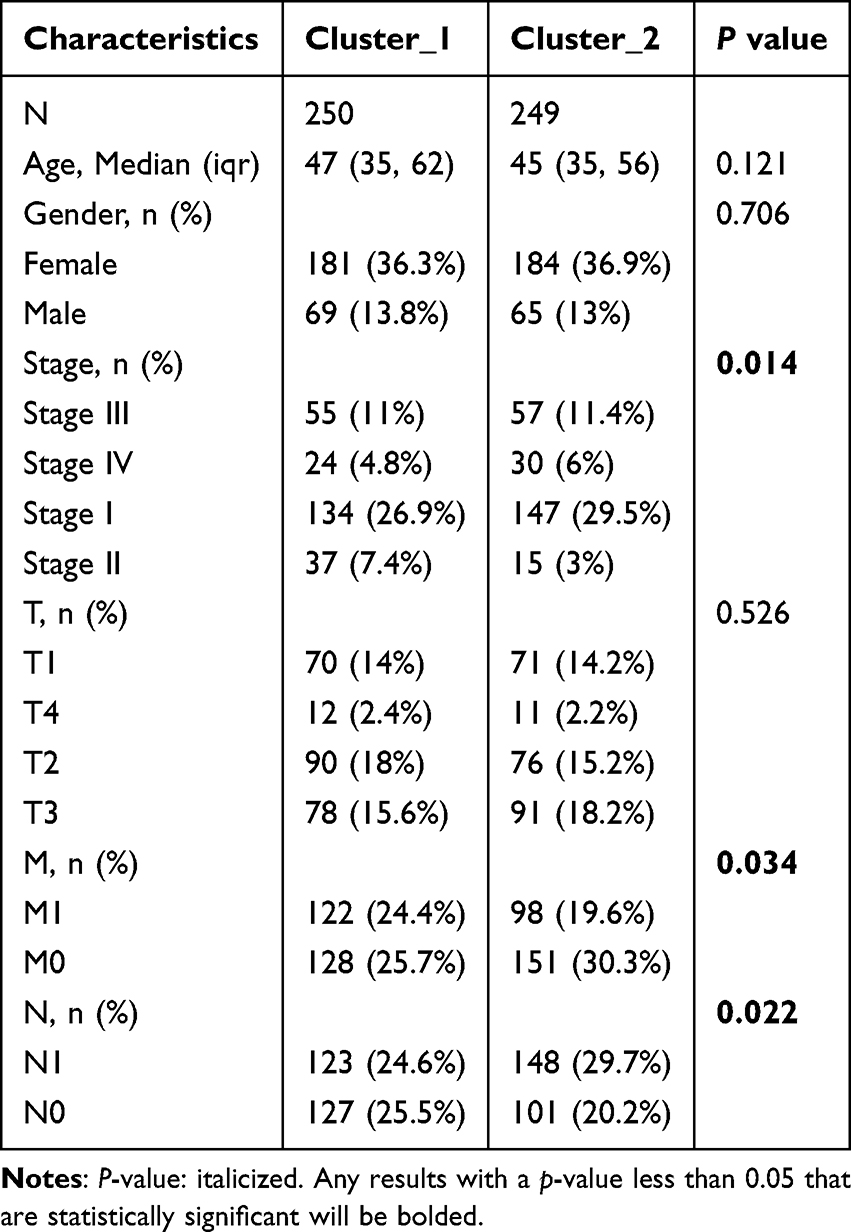 |
Table 2 Difference in Clinicopathological Characteristics Between Cluster_1 and Cluster_2 |
 |
Figure 6 The recognition of two different UPS-PM-related subtypes of THCA. (A)The cumulative distribution curve of each k value from 2 to 10 in the consensus cluster analysis, (B) The area under the curve of each k value, (C) The heat map of the two different UPS-PM-related subtypes of THCA, (D) The UPS-PMS value of cluster_1 and cluster_2, (E) The survival probability analysis of cluster_1 and cluster_2, (F) Survival analysis of THCA patients with the combined subtype and UPS-PMS, (G–I) Bar scale diagram showing differences in distinct subtypes between (G) distinct stage, (H) metastasis and (I) nodes metastasis, (J) The heatmap demonstrated the different clinicopathological features of each sample, survival, UPS-PMS and subtypes (***p < 0.001). |
Identifying Biological Difference in UPS-PM-Related THCA Subtypes
To further elucidate the biological differences between the UPS-PM-related subtypes, we conducted a differential expression analysis comparing cluster_2 to cluster_1. This analysis revealed 2680 DEGs from the TCGA-THCA dataset, with logFC > 2 and p < 0.05 (Figure S2A). Moreover, the expression profiles of the top 100 UPS-PMS-related DEGs between the two THCA subtypes were displayed in a heatmap, highlighting the unique genetic heterogeneity of each subtype (Figure S2B). To elucidate the pathway enrichment of up- and down-regulated genes, we performed GO and KEGG enrichment analyses with pathway annotation shown in Supplementary Tables 4 and 5. The upregulated genes were predominantly associated with terms related to immune processes, including antigen processing and presentation, leukocyte cell-cell adhesion, cytokine production regulation, IκB kinase/NF-κB signaling, and adaptive immune response. These terms are linked to immune cell activation, proliferation, and differentiation. Conversely, the downregulated genes were primarily involved in pathways such as oxidative stress response, ubiquitin-dependent ERAD, cellular oxidative stress response, intrinsic apoptotic signaling, and oxidative phosphorylation—pathways associated with disease onset and progression (Figure 7). In summary, our genetic analysis reveals that the distinct biological characteristics between the two UPS-PMS-related subtypes are closely associated with immune processes.
 |
Figure 7 GO & KEGG analyses of the up- and down-regulated genes. (A and B) The number of genes enriched in each KEGG pathway term is shown as the circle size, and the categories are shown by different colors. |
Cellular Infiltration and Immune Checkpoint Differences in THCA Subtypes
Given the evident link between pathway enrichment and immune functions, we employed the ssGSEA algorithm to assess immune cell infiltration in THCA samples. This analysis provided deeper insights into the immune profiles and differences between the two subtypes (Figure 8A). A notable discrepancy was observed in the ESTIMATE algorithm analysis, with the Cluster_2 group exhibiting a higher score than the Cluster_1 in the IMMUNE score category. In contrast, Cluster_1 exhibited a significantly higher Stromal score compared to Cluster_2 (Figure 8B). We examined the immune landscape of Cluster_1 and Cluster_2 by analyzing the correlation between the expression levels of six key ubiquitin-proteasome system pathway molecules (UPSPMs) and immune cell infiltration. Our results reveal a stronger correlation between the expression profiles of six UPSPMs and immune cell types in Cluster_1 compared to Cluster_2. This enhanced correlation in Cluster_1 indicates a more complex interplay between the immune landscape and the ubiquitin-proteasome system pathway, underscoring its significance in the disease’s immunopathogenesis (Figure 8C). We employed the ssGSEA method to quantify the enrichment scores of various immune cell subgroups and explore their correlations with the two clusters. The analysis revealed that NK cells, macrophages, and Th1 cells were more abundant in Cluster_2, while T cells, helper T cells, and Th2 cells were more prevalent in Cluster_1 (Figure 8E). Additionally, given the pivotal role of immune checkpoints in immunotherapy, we compared their expression between the clusters. Cluster_2 exhibited higher levels of six key immune checkpoints, including TIGIT and PDCD1LG2, relative to Cluster_1 (Figure 8D). In summary, our analysis using ssGSEA and ESTIMATE algorithms uncovered notable differences in immune cell infiltration and immune checkpoint expression between two thyroid carcinoma subtypes. These findings underscore the importance of the immune microenvironment in relation to UPS pathway molecules and their role in the immunopathology of these subtypes.
 |
Figure 8 Cellular infiltration and immune checkpoint differences in THCA subtypes. (A) Heatmap illustrating the immune infiltration levels of 19 distinct immune cell types across thyroid cancer samples, (B) Box plots delineate differences in ImmuneScore, StromalScore, and ESTIMATEScore between cluster_1 and cluster_2, (C) Heatmap of Mantel correlations between UPS-PM core gene expression and the infiltration scores of 18 immune cells in cluster_1 and cluster_2, (D) Comparative box plot analysis of immune checkpoint expression across clusters cluster_1 and cluster_2, (E) Box plots delineate immune infiltration disparities among 19 immune cell types between cluster_1 and cluster_2 (*p < 0.05, **p < 0.01, ***p < 0.001). |
Identifying a Core Prognostic Marker in THCA
To find the core genes that best characterize the model’s prognosis, the following analyses were conducted. Initially, the GSE29265 dataset was introduced for the purpose of analyzing the expression of the six genes that constitute the model in cancerous and non-cancerous tissues. The results showed that the expression of KCNA1, ZBTB21, KCTD16, FBXO15 was observed to be elevated in cancerous tissues in comparison to their expression levels in normal tissues. However, the opposite was true for KCNS3 and DTX4 (Figure 9A). In order to compare the influence of each candidate gene on survival in UPSPM prognostic signature, the overall survival was further evaluated. The results demonstrated that only two candidate genes, KCNA1 and ZBTB21, exhibited a poor prognosis when expressed at high levels (Figures 9B and S3E). To assess the prognostic value of the candidate genes, we performed a time-dependent ROC curve analysis for one-year, three-year, and five-year overall survival, calculating the corresponding AUC values. The analysis revealed that the AUCs for KCNA1 were 0.788, 0.794, and 0.642 at one, three, and five years, respectively. In contrast, ZBTB21 exhibited AUCs of 0.356, 0.851, and 0.704 for the same time points (Figures 9C and S3J). Additionally, the survival status of other genes is either as protective factors in the development of thyroid cancer or not significantly meaningful (Figure S3A–D, F-I). Considering the better integrated prediction performance of KCNA1, KCNA1 was identified as the leading gene in the prognostic characterization of UPSPM.
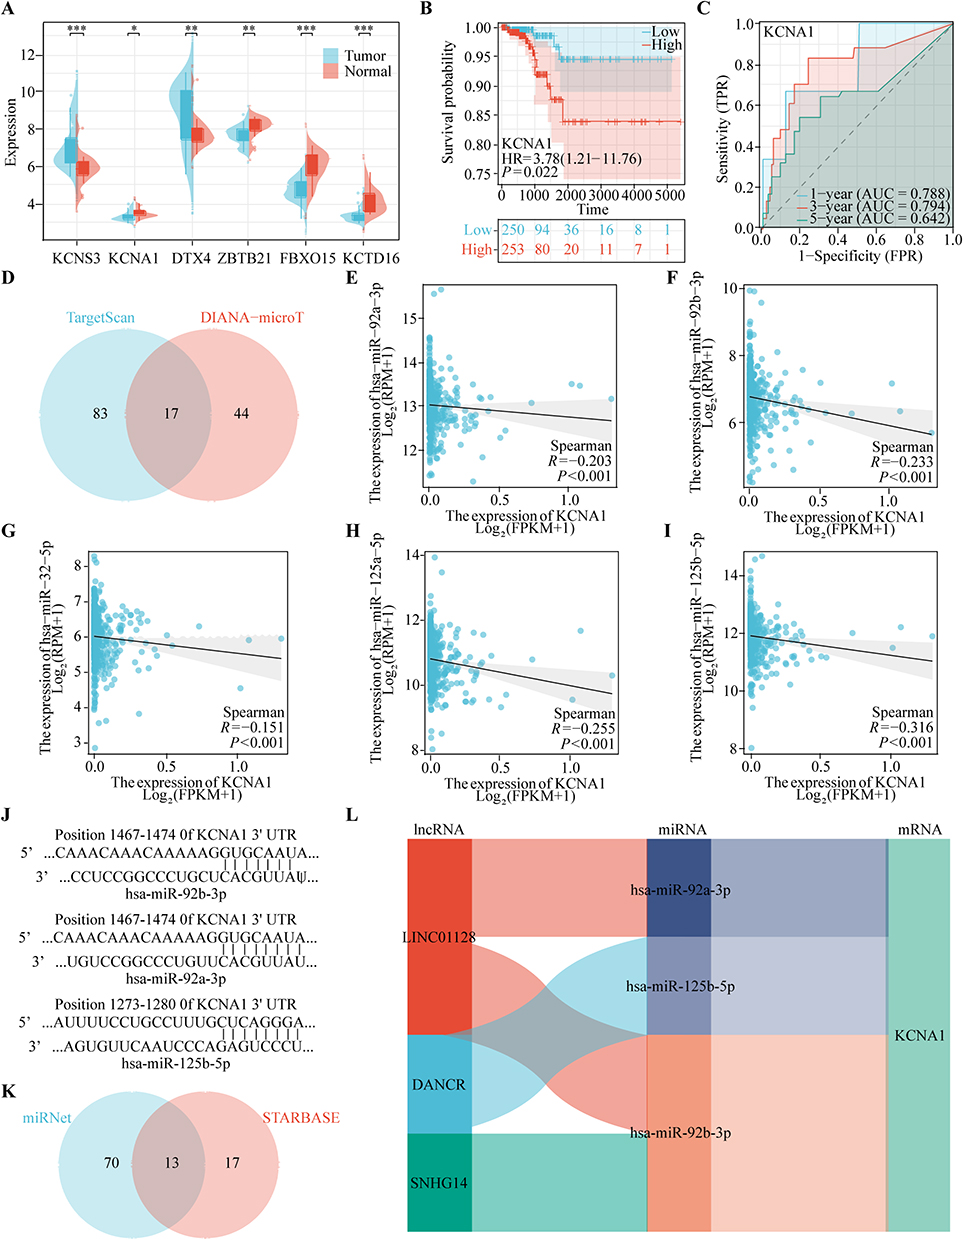 |
Figure 9 Identification of KCNA1 as the Leading Gene in the UPS-PM Signature. (A) The expression level of KCNS3, KCNA1, DTX4, ZBTB21, FBXO15 and KCTD16 in the GSE29265 dataset, (B) The survival analysis of KCNA1, (C) The area under the curve of KCNA1, (D) The miRNA intersection between TargetScan and DIANA-microT database, (E-I) The correlation analysis between KCNA1 expression and (E) hsa-miR-92a-3p, (F) hsa-miR-92b-3p, (G) hsa-miR-32-5p, (H) hsa-miR-125a-5p and (I) hsa-miR-125b-5p expression, (J) The site prediction between KCNA1 and hsa-miR-92a-3p and hsa-miR-92b-3p and hsa-miR-125b-5p, (K) The lncRNA intersection between miRNet and STARBASE database, (L) The construction of ceRNA regulatory networks (*p < 0.05, **p < 0.01, ***p < 0.001). |
To elucidate the molecular mechanisms and regulatory factors driving the upregulation of KCNA1 expression, we constructed a competing endogenous RNA (ceRNA) regulatory network for KCNA1 in THCA. Utilizing predictions from TargetScan and the DIANA-microT database, we identified a total of 17 miRNAs potentially involved in this regulatory network (Figure 9D). Scatter plots demonstrated the correlation between KCNA1 expression and the target miRNAs (Figure 9E–I). Notably, KCNA1 expression exhibited significant negative associations with several miRNAs: hsa-miR-92a-3p (r = −0.203, p < 0.001), hsa-miR-92b-3p (r = −0.233, p < 0.001), hsa-miR-32-5p (r = −0.151, p < 0.001), hsa-miR-125a-5p (r = −0.255, p < 0.001), and hsa-miR-125b-5p (r = −0.316, p < 0.001). Subsequently, we utilized the TargetScan database to identify potential binding sites for the target miRNAs within KCNA1 (Figure 9J). To further investigate, we employed the miRNet and starBase databases, which predicted 13 long non-coding RNAs (lncRNAs) potentially interacting with these miRNAs (Figure 9K). To identify lncRNAs negatively correlated with the miRNAs, we further screened and validated these lncRNAs in THCA using the starBase database. Based on these findings, we constructed four ceRNA regulatory networks implicated in THCA (Figure 9L). In conclusion, in order to deeply investigate the complex relationship between the genetic elements affecting the expression of UPSPM, we chose KCNA1 gene as the main research object. And a three-layer ceRNA regulatory network centered on KCNA1 was constructed.
Drug Sensitivity Analysis and Immunotherapy Potential of KCNA1 Expression in THCA
In light of the growing significance of immunotherapy in the management of the disease, we undertook an investigation into the therapeutic potential of immunotherapy. The findings showed that the group with higher KCNA1 gene expression had higher tumor immune dysfunction and exclusion (TIDE) scores and lower immunotherapy response rates (Figure 10A and B). To explore potential therapeutic interventions targeting KCNA1, we conducted a Connectivity Map (CMap) analysis. We developed a KCNA1-associated gene signature, which included 168 upregulated and 162 downregulated genes. Heatmap clustering of this signature highlighted the enrichment of the top 50 compounds (Figure 10D). Besides, we also conducted another drug sensitivity exploration with the Cancer Therapeutics Response Portal (CTRP), obtaining 218 potential drugs (Figure 10C). Subsequently, the intersection of the two resulted in the identification of five drugs (gemcitabine, TW-37, PAC-1, LY-2183240 and isoliquiritigenin) (Figure 10E). A review of the literature indicates that gemcitabine is the only drug extensively used in clinical practice for THCA. Besides, our findings revealed that the half maximum inhibitory concentration (IC50) for gemcitabine was significantly elevated in the cohort exhibiting high KCNA1 gene expression (Figure 10F). To determine the effects of gemcitabine on KCNA1, we performed a comprehensive set of experiments. Firstly, the CCK8 assay demonstrated that gemcitabine is capable of inhibiting the viability of cancer cells (Figure 10G). Subsequently, the WB assay revealed that gemcitabine can suppress the protein expression of KCNA1 (Figure 10H). The IC50 assay demonstrated that KCNA1 knockdown increased cellular sensitivity to gemcitabine (Figure 10I). To investigate the three-dimensional structure of KCNA1, we utilized AlphaFold for tertiary structure prediction and consulted the PDB database. Subsequently, we employed the H-DOCK server to predict potential binding sites between KCNA1 and gemcitabine, as illustrated in Figure 10J.
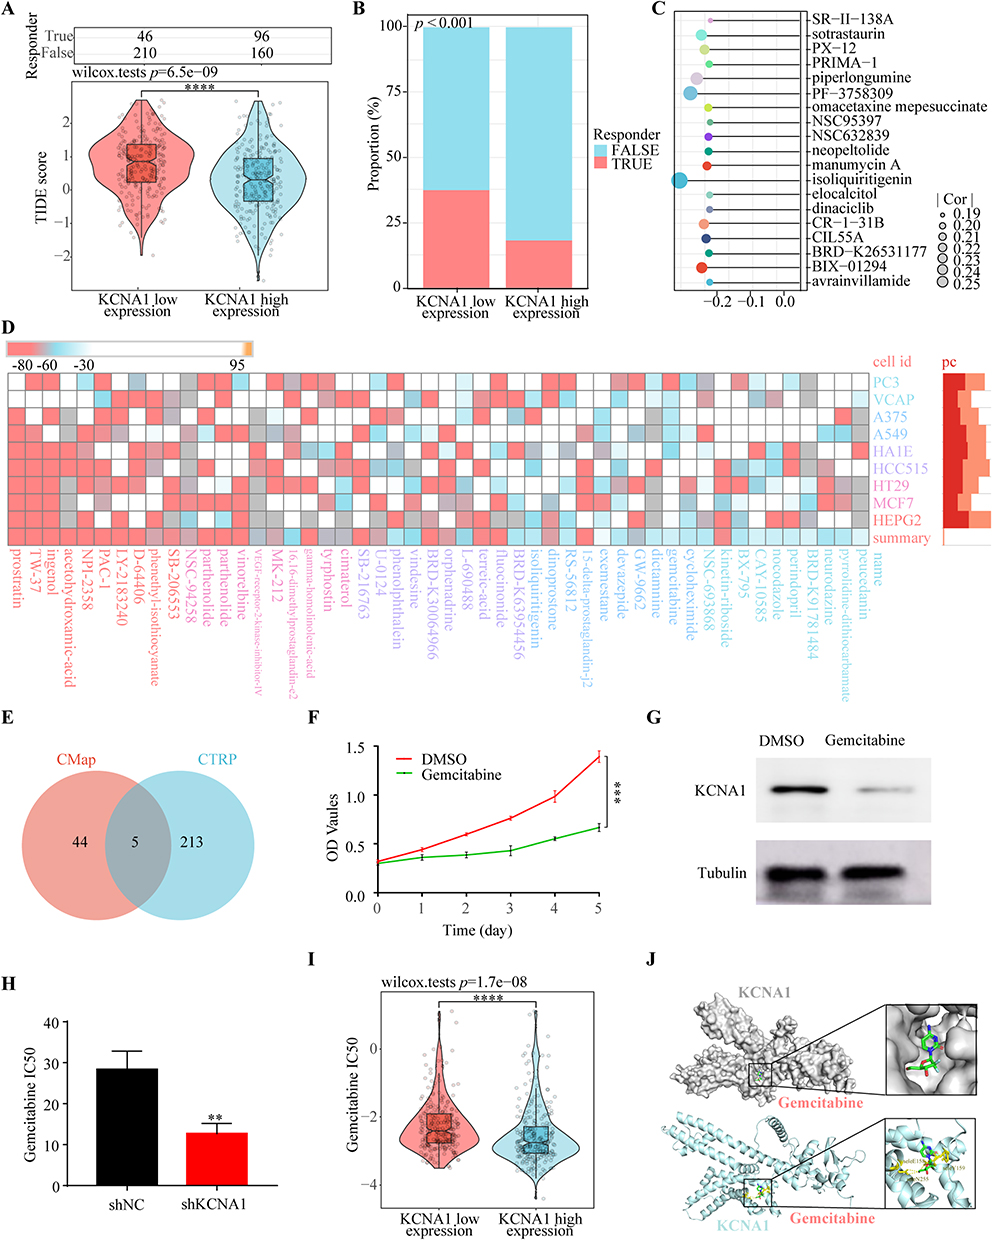 |
Figure 10 Drug Sensitivity analysis and Immunotherapy Potential of KCNA1 expression in THCA. (A) The TIDE score between low KCNA1 expression group and high KCNA1 expression group, (B) The response ratio between low KCNA1 expression group and high KCNA1 expression group, (C) Correlation analysis of KCNA1 expression and chemotherapeutic agents in the CTPR database, (D) Reflection of DEGs between KCNA1 high and low expression groups in the Cmap database to drugs in different cell lines, (E) The chemotherapeutic agents intersection between CTPR and Cmap database, (F) CCK8 assay for inhibition of Bcpap cell proliferation in administered gemcitabine and control groups, (G) Protein expression of KCNA1 after treatment with gemcitabine and control groups, (H) The IC50 changes of gemcitabine after KCNA1 knockdown, (I) The IC50 profile of gemcitabine in the KCNA1 highland expression group, (J) The docking site prediction between KCNA1 and gemcitabine (**p < 0.01, ***p < 0.001, ****p < 0.0001). |
Discussion
The ubiquitin-proteasome system (UPS) plays a crucial role in protein quality control and the regulation of cellular homeostasis. Increasing evidence highlights the UPS as a focal point and therapeutic target in cancer treatment.31 However, previous findings have often been confined to the role of individual ubiquitination regulators in prognostic efficacy or chemotherapy resistance, lacking a comprehensive and integrated investigation of UPS regulators.32 In our research, we integrated known regulatory factors within the UPS, identified differentially expressed UPS regulators, and established a UPS-based model to predict outcomes and immune microenvironment in thyroid carcinoma (THCA) patients.
Utilizing the expression profiles of UPS regulators in THCA and machine learning techniques, we developed a six-gene prognostic risk signature comprising KCNS3, DTX4, ZBTB21, KCTD16, FBXO15, and KCNA1. This signature demonstrates strong predictive capability regarding the prognosis of THCA patients. KCNS3, a member of the voltage-gated potassium channel modifier subfamily S, has been implicated in the progression of esophageal cancer.33 Previous studies confirmed that Deltex E3 ubiquitin ligase 4 (DTX4) acts as a regulator of both the Notch signaling pathway and the interferon (IFN)-I signaling pathway in innate immunity, promoting thyroid carcinoma progression via stearoyl-CoA desaturase 1.34–36 ZBTB21, a zinc-finger protein, may function as a DNA-binding motif in transcriptional regulation, closely associated with cancer development.37,38 KCTD16, containing 16 potassium channel oligomerization domains, predominantly operates upstream or within the regulatory scope of G protein-coupled receptor signaling pathways.39 FBXO15, an F-box protein, suppresses breast cancer progression through the EGFR/STAT3/miR-92a-3p axis.40 KCNA1, a member of the voltage-gated potassium channel subfamily A, promotes tumor progression by regulating mitochondrial damage and ferroptosis while limiting tumorigenesis through potassium channel-dependent senescence.41–43 Collectively, these six significant UPS regulators play direct or potential roles in cancer progression. Additionally, based on the aforementioned six-gene signature, we identified two distinct UPS-associated subtypes of THCA. Notably, these subtypes effectively differentiate the prognostic outcomes and varying clinical-pathological features of THCA patients. In summary, our research characterizes the relationship and features between THCA, its subtypes, and the UPS signature, potentially providing novel insights into personalized treatment strategies for THCA.
During tumorigenesis and evolution, dysregulation of the UPS manifests in various biological functions, including signal transduction, immune infiltration, and other critical biological processes.44 Further pathway enrichment analyses revealed that the UPS signature is significantly positively correlated with pathways related to oxidative stress response, epithelial-mesenchymal transition, vascular endothelial growth factor receptor binding, positive regulation of protein ubiquitination, and ubiquitin ligase binding. Conversely, significant negative correlations were observed with pathways involving UPS antigen processing and presentation, B cell-mediated immune responses, MHC protein complexes, Th17 cell differentiation, and Th1 and Th2 cell differentiation. These results suggest that the UPS signature regulates the progression of THCA through interactions with cancer-related pathways and immune-related pathways.
The UPS plays a pivotal role in the tumor immune microenvironment by regulating critical aspects of both innate and adaptive immunity, including signaling pathways, protein homeostasis, and antigen processing.45 Through pattern recognition receptors (PRRs), the UPS modulates intracellular signaling triggered by danger signals, thus influencing innate immune responses.46 Additionally, the UPS affects adaptive immunity by altering levels and functions of T cell signaling intermediates or influencing transcription factors that drive CD4+ T cell identity and function.47 Notably, emerging evidence underscores the UPS’s significant regulatory role in the differentiation of Th1 and Th2 cells. The E3 ubiquitin ligase CUL4B inhibits Th1 and Th2 differentiation by ubiquitinating H2AK119.48 Our study reveals a marked negative correlation between UPS signature and myeloid-derived immune cells, including NK cells, dendritic cells, and macrophages, suggesting potential immunosuppressive features of UPS signature. Interestingly, UPS signature is positively correlated with T cells, helper T cells, and Th2 cells, but negatively correlated with Th1 cells, indicating that UPS signature may reshape the tumor microenvironment by modulating the Th1/Th2 balance, thereby promoting immune suppression and escape. Furthermore, high-risk UPS signatures often display a “hot” immune state with highly active interactions and cross-talk among immune cells. In THCA subtypes, the worse prognosis of the C1 subtype was associated with an immune infiltration profile similar to that of high UPS signature states. In summary, the UPS signature may contribute to the progression of THCA by creating an immunosuppressive microenvironment through immune infiltration.
As research progresses, the UPS has been recognized as a key regulator of resistance to various therapeutic modalities, including chemotherapy, targeted therapy, immunotherapy, and radiotherapy.45 Targeting the UPS presents an effective strategy to counteract resistance across different cancer types, thereby enhancing therapeutic approaches and improving patient outcomes.49 Our initial screening identified KCNA1 as having significant clinical value. Further investigation into KCNA1’s impact on immunotherapy and chemotherapy sensitivity revealed that high KCNA1 expression was associated with higher tumor immune dysfunction and exclusion (TIDE) scores and lower response rates to immunotherapy compared to low KCNA1 expression, confirming its detrimental effect on immunotherapy. Additionally, bioinformatics and experimental analyses demonstrated that silencing KCNA1 expression effectively reduced the IC50 of gemcitabine, alleviating gemcitabine resistance in THCA patients. Thus, targeting KCNA1 offers a novel therapeutic avenue for THCA treatment.
It is widely acknowledged that E3 ubiquitin ligases, the proteasome, and deubiquitinating enzymes have emerged as novel targets for anticancer therapeutics.31,50 Nonetheless, the development of UPS inhibitors in clinical trials remains limited.31 The underlying mechanisms through which these components regulate cellular processes are intricate, with much of the previous research focusing primarily on apoptosis and autophagy.51,52 Presently, there is an urgent need for exploration into the mechanisms governing UPS immunological functions, as well as the development of anticancer drugs that target these processes.8 Our recent findings unveil a novel interplay between UPS prognostic risk signatures and thyroid immunity, offering a glimmer of hope for the development of targeted UPS inhibitors. Notably, these UPS signatures may reshape the immunological microenvironment by modulating the Th1/Th2 ratio, thereby fostering an immunosuppressive milieu. In essence, our study not only underscores the untapped potential of UPS as a therapeutic target but also provides a compelling rationale for future investigations into the interplay between UPS and immune regulation in THCA.
However, this study has limitations. Due to the lack of survival data for THCA patients in the GEO database, we only validated the UPS signature at the expression level without prognostic validation. Additionally, future research should include functional experiments to elucidate the mechanisms of KCNA1. Lastly, the reliability of this prognostic feature should be improved through iterative long-term clinical application.
In conclusion, the UPS signature accurately predicts the prognosis of THCA patients and can serve as a decision-making tool for guiding their treatment. Furthermore, KCNA1, a key gene within the UPS signature, holds clinical potential in THCA therapy.
Conclusion
Research on the ubiquitin-proteasome system (UPS) in thyroid carcinoma remains limited. Our study elucidated the UPS landscape in thyroid carcinoma by developing a UPS-mediated model to predict patient survival accurately and to delve into the tumor immune microenvironment. We subsequently identified two UPS-associated subtypes by evaluating ubiquitin-proteasome system prognostic model score (UPS-PMS) and their relationship with various clinical parameters and immune responses, which provide insights into patient prognosis and immune profiles. Additionally, we validated the clinical relevance of the prognostically significant E3 ubiquitin ligase KCNA1 in immune therapy and chemotherapy sensitivity through bioinformatics and experimental validation. Collectively, our work introduces an accurate and innovative model aimed at enhancing precise diagnosis and personalized treatment for thyroid carcinoma, deepening the understanding of the relationship between thyroid carcinoma and UPS, and potentially setting the stage for future research breakthroughs.
Abbreviations
UPS, ubiquitin-proteasome system; THCA, thyroid carcinoma; WGCNA, weighted gene co-expression network analysis; UPSPM, ubiquitin-proteasome system prognostic model; UPS-PMS, ubiquitin-proteasome system prognostic model score; ceRNA, competing endogenous RNA; GO, Gene Ontology; KEGG, Kyoto Encyclopedia of Genes and Genomes; GSEA, Gene Set Enrichment Analysis; DEGs, differentially expressed genes; AUC, area under the curve; ssGSEA, single-sample Gene Set Enrichment Analysis; CDF, cumulative distribution function; IC50, Half-maximal inhibitory concentration.
Data Sharing Statement
The datasets used and/or analyzed during the current study are available from the corresponding author on reasonable request.
Ethics Approval and Informed Consent
The item 1 and 2 of Article 32 of “the Measures for Ethical Review of Life Science and Medical Research Involving Human Subjects”, which was reviewed by the National Science and Technology Ethics Committee, approved by the State Council of China, and jointly promulgated by the National Health Commission, the Ministry of Education, the Ministry of Science and Technology and the State Administration of Traditional Chinese Medicine, published on Feb. 18, 2023. Written informed consent for participation was not required for this study in accordance with the national legislation and the institutional requirements.
Acknowledgments
We would like to thank TCGA, and GEO databases for their free use.
Author Contributions
All authors made a significant contribution to the work reported, whether that is in the conception, study design, execution, acquisition of data, analysis and interpretation, or in all these areas; took part in drafting, revising or critically reviewing the article; gave final approval of the version to be published; have agreed on the journal to which the article has been submitted; and agree to be accountable for all aspects of the work.
Funding
This study was supported by grants from Science and Technology Project of Jiangxi Provincial Health Commission (202210611), Science and Technology project of traditional Chinese medicine in Jiangxi province (2023Z030), Natural Science Foundation of Jiang xi Province Youth Science Foundation (20224BAB216055) and National Natural Science Foundation of China (82260472).
Disclosure
The authors report no conflicts of interest in this work.
References
1. Chen D, Zhao H, Guo Z, et al. Identification of m6A-related lncRNAs LINC02471 and DOCK9-DT as potential biomarkers for thyroid cancer. Int Immunopharmacol 2024;133:112050 doi: 10.1016/j.intimp.2024.112050
2. Tang M, Luo W, Zhou Y, Zhang Z, Jiang Z. Anoikis-related gene CDKN2A predicts prognosis and immune response and mediates proliferation and migration in thyroid carcinoma. Transl Oncol 2024;40:101873 doi: 10.1016/j.tranon.2023.101873
3. Zhu J, Guo L, Dai H, et al. RNF115 aggravates tumor progression through regulation of CDK10 degradation in thyroid carcinoma. Cell Biol Toxicol 2024;40(1):14 doi: 10.1007/s10565-024-09845-w
4. Fang X, Huang X, Lu J, Su D. Causal role of immune cells in thyroid cancer: a bidirectional Mendelian randomization study. Front Immunol 2024;15:1425873 doi: 10.3389/fimmu.2024.1425873
5. Li G, Ye Z, Wei T, Zhu J, Li Z, Lei J. Clinical Outcomes and Implications of Radioactive Iodine Therapy on Cancer-specific Survival in WHO Classification of FTC. J Clin Endocrinol Metab 2024;109(9):2294–2305 doi: 10.1210/clinem/dgae122
6. Liu Y, Song Y, He Y, et al. Kruppel-like factor 13 acts as a tumor suppressor in thyroid carcinoma by downregulating IFIT1. Biol Direct 2023;18(1):65 doi: 10.1186/s13062-023-00422-5
7. Dong Y, Chen Y, Ma G, Cao H. The role of E3 ubiquitin ligases in bone homeostasis and related diseases. Acta Pharm Sin B 2023;13(10):3963–3987 doi: 10.1016/j.apsb.2023.06.016
8. Spano D, Catara G Targeting the Ubiquitin-Proteasome System and Recent Advances in Cancer Therapy. Cells 2023;13(1) doi: 10.3390/cells13010029
9. Li X, Li W, Zhang Y, Xu L, Song Y Exploiting the potential of the ubiquitin-proteasome system in overcoming tyrosine kinase inhibitor resistance in chronic myeloid leukemia. Genes Dis 2024;11(5):101150 doi: 10.1016/j.gendis.2023.101150
10. Alhasan BA, Morozov AV, Guzhova IV, Margulis BA The ubiquitin-proteasome system in the regulation of tumor dormancy and recurrence. Biochim Biophys Acta Rev Cancer 2024;1879(4):189119 doi: 10.1016/j.bbcan.2024.189119
11. Narayanan S, Cai CY, Assaraf YG, et al Targeting the ubiquitin-proteasome pathway to overcome anti-cancer drug resistance. Drug Resist Updat 2020;48:100663 doi: 10.1016/j.drup.2019.100663
12. Zhang J, Liu L, Wang Z, et al Ubiquitin-proteasome system-based signature to predict the prognosis and drug sensitivity of hepatocellular carcinoma. Front Pharmacol 2023;14:1172908 doi: 10.3389/fphar.2023.1172908
13. Din MAU, Lin Y, Wang N, Wang B, Mao F Ferroptosis and the ubiquitin-proteasome system: exploring treatment targets in cancer. Front Pharmacol 2024;15:1383203 doi: 10.3389/fphar.2024.1383203
14. Wang G, Miao C, Mo L, et al MYCBP2 expression correlated with inflammatory cell infiltration and prognosis immunotherapy in thyroid cancer patients. Front Immunol 2022;13:1048503 doi: 10.3389/fimmu.2022.1048503
15. Kim YJ, Lee Y, Shin H, Hwang S, Park J, Song EJ Ubiquitin-proteasome system as a target for anticancer treatment-an update. Arch Pharm Res 2023;46(7):573–597 doi: 10.1007/s12272-023-01455-0
16. Han D, Wang L, Jiang S, Yang Q The ubiquitin-proteasome system in breast cancer. Trends Mol Med 2023;29(8):599–621 doi: 10.1016/j.molmed.2023.05.006
17. Altmann A, Markert A, Askoxylakis V, et al. Antitumor effects of proteasome inhibition in anaplastic thyroid carcinoma. J Nucl Med 2012;53(11):1764–1771 doi: 10.2967/jnumed.111.101295
18. Tomczak K, Czerwińska P, Wiznerowicz M The Cancer Genome Atlas (TCGA): an immeasurable source of knowledge. Contemp Oncol 2015;19(1a):A68–77 doi: 10.5114/wo.2014.47136
19. Ritchie ME, Phipson B, Wu D, et al. limma powers differential expression analyses for RNA-sequencing and microarray studies. Nucleic Acids Res 2015;43(7):e47 doi: 10.1093/nar/gkv007
20. Langfelder P, Horvath S WGCNA: an R package for weighted correlation network analysis. BMC Bioinf. 2008;9:559 doi: 10.1186/1471-2105-9-559
21. The Gene Ontology Resource: 20 years and still GOing strong. Nucleic Acids Res 2019;47(D1):D330–d38 doi: 10.1093/nar/gky1055
22. Kanehisa M, Goto S KEGG: Kyoto encyclopedia of genes and genomes. Nucleic Acids Res 2000;28(1):27–30 doi: 10.1093/nar/28.1.27
23. Barbie DA, Tamayo P, Boehm JS, et al. Systematic RNA interference reveals that oncogenic KRAS-driven cancers require TBK1. Nature 2009;462(7269):108–112 doi: 10.1038/nature08460
24. McGeary SE, Lin KS, Shi CY, et al The biochemical basis of microRNA targeting efficacy. Science 2019;366(6472) doi: 10.1126/science.aav1741
25. Tastsoglou S, Alexiou A, Karagkouni D, Skoufos G, Zacharopoulou E, Hatzigeorgiou AG DIANA-microT 2023: including predicted targets of virally encoded miRNAs. Nucleic Acids Res 2023;51(W1):W148–w53 doi: 10.1093/nar/gkad283
26. Chang L, Zhou G, Soufan O, Xia J miRNet 2.0: network-based visual analytics for miRNA functional analysis and systems biology. Nucleic Acids Res. 2020;48(W1):W244–w51 doi: 10.1093/nar/gkaa467
27. Li JH, Liu S, Zhou H, Qu LH, Yang JH starBase v2.0: decoding miRNA-ceRNA, miRNA-ncRNA and protein-RNA interaction networks from large-scale CLIP-Seq data. Nucleic Acids Res 2014;42:D92–7 doi: 10.1093/nar/gkt1248
28. Lamb J, Crawford ED, Peck D, et al The Connectivity Map: using gene-expression signatures to connect small molecules, genes, and disease. Science. 2006;313(5795):1929–1935 doi: 10.1126/science.1132939
29. Yan Y, Zhang D, Zhou P, Li B, Huang SY HDOCK: a web server for protein-protein and protein-DNA/RNA docking based on a hybrid strategy. Nucleic Acids Res 2017;45(W1):W365–w73 doi: 10.1093/nar/gkx407.
30. Janson G, Zhang C, Prado MG, Paiardini A PyMod 2.0: improvements in protein sequence-structure analysis and homology modeling within PyMOL. Bioinformatics 2017;33(3):444–446 doi: 10.1093/bioinformatics/btw638
31. Park J, Cho J, Song EJ Ubiquitin-proteasome system (UPS) as a target for anticancer treatment. Arch Pharm Res 2020;43(11):1144–1161 doi: 10.1007/s12272-020-01281-8
32. Pal A, Young MA, Donato NJ Emerging potential of therapeutic targeting of ubiquitin-specific proteases in the treatment of cancer. Cancer Res. 2014;74(18):4955–4966. doi: 10.1158/0008-5472.Can-14-1211
33. Alotaibi A, Gadekar VP, Gundla PS, et al. Global comparative transcriptomes uncover novel and population-specific gene expression in esophageal squamous cell carcinoma. Infect Agent Cancer 2023;18(1):47 doi: 10.1186/s13027-023-00525-8
34. Cui J, Li Y, Zhu L, et al NLRP4 negatively regulates type I interferon signaling by targeting the kinase TBK1 for degradation via the ubiquitin ligase DTX4. Nat Immunol 2012;13(4):387–395 doi: 10.1038/ni.2239[published
35. Cui Y, Luo J, Bai N, Yu Z Deltex E3 ubiquitin ligase 4 promotes thyroid cancer progression through stearoyl-CoA desaturase 1. Funct Integr Genomics 23;(3):280 doi: 10.1007/s10142-023-01215-9
36. Wang L, Sun X, He J, Liu Z Functions and Molecular Mechanisms of Deltex Family Ubiquitin E3 Ligases in Development and Disease. Front Cell Dev Biol 2021;9:706997 doi: 10.3389/fcell.2021.706997
37. Collins T, Stone JR, Williams AJ All in the family: the BTB/POZ, KRAB, and SCAN domains. Mol Cell Biol 2001;21(11):3609–3615 doi: 10.1128/mcb.21.11.3609-3615.2001
38. Qiao M, Huang Q, Wang X, Han J ZBTB21 suppresses CRE-mediated transcription to impair synaptic function in Down syndrome. Sci Adv 2024;10(27):eadm7373 doi: 10.1126/sciadv.adm7373
39. Zuo H, Glaaser I, Zhao Y, et al. Structural basis for auxiliary subunit KCTD16 regulation of the GABA(B) receptor. Proc Natl Acad Sci U S A 2019;116(17):8370–8379 doi: 10.1073/pnas.1903024116
40. Zhao Y, Shim N, Cui YH, et al. FBXO15 plays a critical suppressive functional role in regulation of breast cancer progression. Signal Transduct Target Ther 2021;6(1):211 doi: 10.1038/s41392-021-00605-4
41. Lallet-Daher H, Wiel C, Gitenay D, et al. Potassium channel KCNA1 modulates oncogene-induced senescence and transformation. Cancer Res 2013;73(16):5253–5265 doi: 10.1158/0008-5472.Can-12-3690
42. Liu L, Chen Y, Zhang Q, Li C Silencing of KCNA1 suppresses the cervical cancer development via mitochondria damage. Channels 2019;13(1):321–330 doi: 10.1080/19336950.2019.1648627
43. Wang W, Zhang Y, Li X, et al KCNA1 promotes the growth and invasion of glioblastoma cells through ferroptosis inhibition via upregulating SLC7A11. Cancer Cell Int 2024;24(1):7 doi: 10.1186/s12935-023-03199-9
44. Young MJ, Hsu KC, Lin TE, Chang WC, Hung JJ The role of ubiquitin-specific peptidases in cancer progression. J Biomed Sci 2019;26(1):42 doi: 10.1186/s12929-019-0522-0
45. Owens T, Benmamar-Badel A, Wlodarczyk A, et al. Protective roles for myeloid cells in neuroinflammation. Scand J Immunol 2020;92(5):e12963 doi: 10.1111/sji.12963
46. Laiosa CV, Stadtfeld M, Graf T Determinants of lymphoid-myeloid lineage diversification. Annu Rev Immunol 2006;24:705–738 doi: 10.1146/annurev.immunol.24.021605.090742
47. Layman AA, Oliver PM Ubiquitin Ligases and Deubiquitinating Enzymes in CD4+ T Cell Effector Fate Choice and Function. J Immunol 2016;196(10):3975–3982 doi: 10.4049/jimmunol.1502660
48. Qin L, Song Y, Zhang F. CRL4B complex-mediated H2AK119 monoubiquitination restrains Th1 and Th2 cell differentiation. Cell Death Differ 2023;30(6):1488–1502 doi: 10.1038/s41418-023-01155-8
49. Gao H, Xi Z, Dai J, et al. Drug resistance mechanisms and treatment strategies mediated by Ubiquitin-Specific Proteases (USPs) in cancers: new directions and therapeutic options. Mol Cancer 2024;23(1):88 doi: 10.1186/s12943-024-02005-y
50. Eletr ZM, Wilkinson KD. Regulation of proteolysis by human deubiquitinating enzymes. Biochim Biophys Acta 2014;1843(1):114–128 doi: 10.1016/j.bbamcr.2013.06.027
51. Huang HC, Shi J, Orth JD, Mitchison TJ. Evidence that mitotic exit is a better cancer therapeutic target than spindle assembly. Cancer Cell 2009;16(4):347–358 doi: 10.1016/j.ccr.2009.08.020
52. Huang ZJ, Zhu JJ, Yang XY, Biskup E. NEDD4 promotes cell growth and migration via PTEN/PI3K/AKT signaling in hepatocellular carcinoma. Oncol Lett 2017;14(3):2649–2656 doi: 10.3892/ol.2017.6532
 © 2024 The Author(s). This work is published and licensed by Dove Medical Press Limited. The
full terms of this license are available at https://www.dovepress.com/terms.php
and incorporate the Creative Commons Attribution
- Non Commercial (unported, 3.0) License.
By accessing the work you hereby accept the Terms. Non-commercial uses of the work are permitted
without any further permission from Dove Medical Press Limited, provided the work is properly
attributed. For permission for commercial use of this work, please see paragraphs 4.2 and 5 of our Terms.
© 2024 The Author(s). This work is published and licensed by Dove Medical Press Limited. The
full terms of this license are available at https://www.dovepress.com/terms.php
and incorporate the Creative Commons Attribution
- Non Commercial (unported, 3.0) License.
By accessing the work you hereby accept the Terms. Non-commercial uses of the work are permitted
without any further permission from Dove Medical Press Limited, provided the work is properly
attributed. For permission for commercial use of this work, please see paragraphs 4.2 and 5 of our Terms.