")
Back to Journals » Journal of Inflammation Research » Volume 17
A Nomogram Incorporating Inflammation and Nutrition Indexes for Predicting Outcomes in Patients with Acute Coronary Syndrome and Chronic Kidney Disease
Received 5 September 2024
Accepted for publication 31 October 2024
Published 4 November 2024 Volume 2024:17 Pages 8181—8198
DOI https://doi.org/10.2147/JIR.S488674
Checked for plagiarism Yes
Review by Single anonymous peer review
Peer reviewer comments 2
Editor who approved publication: Dr Adam Bachstetter
Weicheng Ni,1 Zhen-ze Pan,2 Hao Zhou1
1Department of Cardiology, The First Affiliated Hospital of Wenzhou Medical University, Wenzhou, People’s Republic of China; 2Department of Statistics and Management, Shanghai University of Finance and Economics, Shanghai, People’s Republic of China
Correspondence: Hao Zhou, Department of Cardiology, The First Affiliated Hospital of Wenzhou Medical University, NanBai Xiang Avenue, Ouhai District, Wenzhou, 325000, People’s Republic of China, Email [email protected]
Background: Inflammation, immunity, and nutriture are associated with prognosis in cardiovascular disease. We aimed to devise a novel nomogram model based on inflammation and nutrition indexes that accurately predicts Major adverse renal and cardiovascular events (MARCE) in patients diagnosed with acute coronary syndrome (ACS) and coexisting chronic kidney disease (CKD).
Methods: We enrolled 685 individuals with ACS and CKD between January 2013 and August 2021. All patients were randomized into the training (70%) and validation (30%) cohorts. Univariable and multivariable Cox regression analyses were used to identify independent predictors for MARCE. The performance of the nomogram model was evaluated using receiver operating characteristic (ROC) analysis, calibration curves, and decision curve analysis (DCA). The performance of the nomogram and GRACE score were compared.
Results: The nomogram included six variables: age, left ventricular ejection fraction, systemic immune-inflammatory index (SII), controlling nutritional status (CONUT) score, use of beta-blockers, and use of statins. The constructed nomogram demonstrated robust predictive performance, achieving ROC ranging from 0.830 to 0.935 in the training set and 0.793 to 0.889 in the validation set, respectively. Furthermore, the calibration curves exhibited excellent agreement between the predicted probabilities and the observed outcomes, indicating the reliability of the nomogram’s predictions. Finally, the DCA confirmed the clinical value of the nomogram by demonstrating its potential to improve decision-making processes in the context of managing the condition under study. Compared with the GRACE score, the nomogram was superior in terms of both discrimination and reclassification ability.
Conclusion: Our novel nomogram, which incorporates the CONUT score and SII, shows promising utility for predicting MARCE in patients with ACS and CKD. The identification of patients at heightened risk through our nomogram model is paramount as it serves as a cornerstone for the implementation of targeted interventions aimed at modifiable variables.
Keywords: acute coronary syndrome, chronic kidney disease, GRACE score, major adverse renal and cardiovascular events, nomogram, prediction model
Introduction
Chronic kidney disease (CKD) is prevalent, affecting approximately 30–40% of acute coronary syndrome (ACS).1,2 However, major randomized clinical trials, particularly those focusing on cardiovascular disease, often underrepresent or exclude patients with CKD.3 This underrepresentation can contribute to the underuse of evidence-based treatment for these patients, which in turn may lead to poorer outcomes despite their high-risk status.2,4 Patients with CKD face an elevated risk of ACS, exhibit notably higher mortality rates, and are predisposed to renal function deterioration.4–6 Managing a single-organ dysfunction without acknowledging the interconnectedness of the secondary organ within the cardiorenal axis can be misguided and potentially detrimental. The American Heart Association advocates for the utilization of major adverse renal and cardiovascular events (MARCE) as an innovative clinical endpoint for patients with cardiorenal diseases, as it offers a comprehensive definition of prognosis.7 Identifying patients at increased risk of MARCE is an unmet need for individuals combined with ACS and CKD.
The current clinical scoring systems have been used in clinical practice for over a decade.8–10 Among them, the Global Registry of Acute Coronary Events (GRACE) score stands as an efficacious indicator, endorsed by guidelines, for predicting mortality and adverse events in patients diagnosed with ACS.8,11 Recent studies have shown that predictive models incorporating creatinine and cardiac enzyme markers could underestimate the risk of major events for patients with kidney dysfunction.12,13 Therefore, these models may not be widely adopted for patients combined with CKD. Moreover, models that effectively assess the prognosis of ACS and CKD are still lacking. The nomogram we developed aims to fill this gap by considering malnutrition and inflammation factors, thereby better capturing the complex interplay between nutrition and inflammation that underpin CVD risk, providing more accurate risk prediction and personalized interventions for ACS and CKD patients.
It is noteworthy that in recent years, several emerging risk models and biomarkers (such as proteomics, metabolomics, etc.) have also been proposed for predicting the prognosis of cardiorenal patient populations.14,15 However, these methods often focus on specific biomarkers or genetic characteristics, posing issues such as higher detection costs, the need for special equipment, and professional knowledge, thereby limiting their use in clinical practice. In contrast, ACS and CKD share non-traditional cardiovascular risk factors, including malnutrition and inflammatory mediators that promote atherosclerosis.16,17 The correlation between malnutrition, inflammation, and atherosclerosis is referred to as the malnutrition–inflammation–atherosclerosis syndrome, which is closely associated with death, cardiovascular events, and renal dysfunction.17–19
The Controlling Nutritional Status (CONUT) score, devised utilizing solely three readily obtainable laboratory parameters, has been established as a screening tool for malnutrition and has emerged as a strong predictor of adverse prognosis in both cardiovascular diseases and kidney diseases.20–22 Meanwhile, the Systemic Immune-Inflammation Index (SII), a comprehensive inflammatory biomarker, provides an accurate portrayal of patients’ inflammatory and immune states.23 Notably, the SII has been correlated with cardiovascular events and renal impairment in patients with cardiovascular diseases,24,25 thereby suggesting its potential utility in predicting MARCE. However, these newly validated predictors have rarely been included as variables in existing prediction models.
Hence, our objective was to devise a nomogram for predicting MARCE in patients with ACS and CKD, and subsequently validate its clinical efficacy. We hypothesized that a combination of malnutrition score, inflammatory index, and other clinical parameters, could enhance the precision of risk stratification and facilitate informed clinical decision-making for this patient population.
Methods
Study Population
In this retrospective study, we consecutively collected data from 902 patients with ACS and CKD who underwent percutaneous coronary intervention (PCI) at the First Affiliated Hospital of Wenzhou Medical University, spanning the period from January 2013 to August 2021. The definition of ACS adhered to current guidelines,26 encompassing both ST-segment elevation myocardial infarction (STEMI) and non-ST-segment elevation acute coronary syndrome (NSTE-ACS), the latter comprising unstable angina (UA) and non-ST-segment elevation myocardial infarction (NSTEMI). STEMI was characterized by chest discomfort or other ischemic symptoms accompanied by new ST-segment elevations in two contiguous leads or new bundle branch blocks, along with elevated cardiac biomarkers. NSTEMI was distinguished by chest discomfort or other ischemic symptoms, elevated cardiac biomarkers, and the absence of ST-segment elevation on the electrocardiogram. UA was defined as newly developed or accelerated chest symptoms within two weeks of exertional or resting angina, without elevated cardiac biomarkers. CKD was diagnosed based on a history of the disease or an estimated glomerular filtration rate (eGFR) of less than 60 mL/min/1.73 m² for three months or longer, as calculated using the Chronic Kidney Disease Epidemiology Collaboration (CKD-EPI) equation.27 The exclusion criteria included death during hospitalization, current dialysis or end-stage renal disease, severe infections, combined hematologic or rheumatic immune system diseases, and a history of malignancy. After exclusions, 685 participants with ACS and CKD were included and randomly assigned to training and validation cohorts (7:3) for the construction and validation of the prediction model. Details of the recruitment process are displayed in Figure 1.
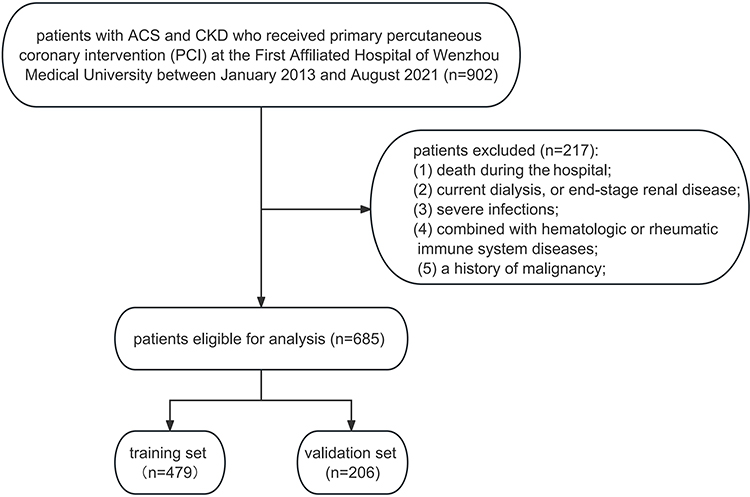 |
Figure 1 Flowchart of the study design. |
We additionally collected 278 patients with ACS complicated by CKD who met the above inclusion and exclusion criteria as an external validation cohort. These patients were from different time periods (from December 2021 to January 2024) at the First Affiliated Hospital of Wenzhou Medical University.
The trial protocol was approved by the Ethics Review Board of the First Affiliated Hospital of Wenzhou Medical University, and our work was reported following the TRIPOD statement guideline.28
Data Collection
We gathered baseline characteristics of the study cohort, encompassing age, gender, and a comprehensive array of clinical data. This encompassed presentation characteristics, medical history, procedural details, laboratory findings, and treatment data, all sourced from electronic medical records. To gauge the nutritional status of the patients, we employed the CONUT score.21 This tool integrates serum albumin level, total cholesterol level, and lymphocyte count to provide a comprehensive assessment. The CONUT score was calculated in accordance with the previously established reference.21
The SII23 was a novel index to measure systemic immune-inflammation status of patients and calculated using the following formula: total peripheral platelet count (P) × neutrophil-to-lymphocyte ratio (N/L); that is, SII = P×N/L.
The large multinational observational GRACE score, recommended by clinical guidelines,8,11 was used to predict adverse events in patients with ACS. The GRACE score was calculated at discharge and compared with the developed nomogram.
Outcome Definition
The endpoint of the study was MARCE after discharge, defined as a composite of all-cause mortality, nonfatal acute myocardial infarction, nonfatal stroke, and renal function worsening (initiation of renal replacement therapy, transplantation, or a doubling of the serum creatinine level).7 The choice of the 6-, 12-, and 24-month intervals for outcome prediction in our study is based on their clinical relevance, their ability to capture critical stages in disease progression, and their common use in clinical research to provide a comprehensive view of various follow-up terms. Follow-up data were collected every six months after discharge from medical records, outpatient clinician visits, and telephone conversations to assess outcomes.
Nomogram Development
To develop the nomogram, we first conducted univariable and multivariable Cox regression analyses in the training cohort to identify independent predictors of MARCE. Variables with a P-value less than 0.05 in the multivariable analysis were included in the final nomogram model. The six predictors identified were age, left ventricular ejection fraction (LVEF), systemic immune-inflammatory index (SII), controlling nutritional status (CONUT) score, use of beta-blockers, and use of statins.
The selected variables in the nomogram were represented in the model by connecting each predictor to a particular point on the point axis. The total sum of scores for each variable was displayed on the “Total Points” axis, and a vertical line was then drawn downward from the plotted total point on the axis to intersect with the probability axis, thereby determining the probability of MARCE at 6, 12, and 24 months.
Nomogram Validation
The performance of the nomogram was evaluated in both the validation cohort and the external validation cohort. The discriminative ability of the nomogram was assessed using the receiver operating characteristic (ROC) curve and the area under the ROC curve (AUC). Additionally, calibration curves were used to visually assess the agreement between the predicted probabilities and the observed outcomes.
Decision curve analysis (DCA) was also conducted to estimate the clinical practicality and net benefit of the nomogram. Furthermore, we compared the performance of the nomogram with the existing GRACE score in terms of AUC, net reclassification improvement (NRI), and integrated discrimination improvement (IDI).
Statistical Analyses
Continuous variables are presented as mean ± standard deviation for normally distributed variables and median (interquartile range) for non-normally distributed variables, while categorical variables are presented as numbers (percentages). The clinical characteristics of patients were compared using appropriate statistical tests, namely the Student’s t-test, Wilcox test and Chi-square test. Variables with a loss rate of less than 15% were maintained and filled in with the multiple imputation using chained equations.29
Statistical significance was set at a P-value of less than 0.05 (two-tailed) for all analyses conducted in this study. All statistical analyses were conducted using SPSS version 25.0 (IBM Corp, Armonk, NY, USA) and R version 4.2.2.
Results
Baseline Characteristics of the Study Population
Between January 2013 and August 2021, 902 patients were retrospectively screened. After exclusion, a total of 685 patients were finally enrolled in the study. The mean age of these patients was 72.1 years, with a standard deviation of 10.6 years. The majority of the patients were male, accounting for 74.8% of the total. These patients were then randomly divided into two cohorts: a training cohort consisting of 479 patients, and a validation cohort comprising 206 patients (Figure 1). In the total population, there were 147 all-cause deaths, 51 nonfatal acute myocardial infarctions, 28 nonfatal strokes, and 77 renal function worsening. During a median follow-up of 31 months, MARCE occurred in 188 (39.2%) and 81 (39.3%) cases in the training and validation sets, respectively. For the training set, the MARCE rates were 10.6%, 11.9%, and 20.5% after 6, 12, and 24 months, respectively, whereas those for the validation set were 9.2%, 11.7%, and 16%, respectively. Table 1 presents a comparison of the baseline characteristics between the training and validation sets, and the results indicate that there are no statistically significant differences between the two groups for any of the measured variables (all P-values greater than 0.05).
 |
Table 1 Baseline Characteristics of Patients with ACS and CKD in the Training and Validation Sets |
Table 2 presents a comparison of baseline characteristics between patients in the training set who experienced MARCE and those who did not. Significant differences were observed between the MARCE and non-MARCE groups in terms of age; BMI; heart rate; Killip class; hemoglobin, albumin, and triglyceride (TG); white blood cell, neutrophil, and lymphocyte counts; SII; left ventricular ejection fraction (LVEF); multivessel disease; left circumflex artery (LCX) stenosis ≥50%; use of beta-blockers; use of ACEI/ARB; use of statins; and GRACE and CONUT scores (all P < 0.05).
 |
Table 2 Baseline Characteristics of Patients with and without MARCE in the Training Set |
Univariable and Multivariable Cox Regression Analyses in the Training Set
Univariable and multivariable Cox regression results are presented in Table 3. Based on the univariable Cox regression analysis, 14 variables (age, heart rate, Killip class, diabetes mellitus, hemoglobin level, SII, creatinine level, CONUT score, LVEF, multivessel disease, LCX stenosis ≥50%, use of beta-blockers, use of ACEI/ARB, and use of statins) had P-values < 0.1 and were considered potential predictors. The results of the multivariable Cox regression analysis conducted on the training set indicate that several factors are independently associated with the rate of major adverse renal and cardiovascular events (MARCE) in the study population. Specifically, the analysis identified age, the systemic immune-inflammation index (SII), the CONUT score, left ventricular ejection fraction (LVEF), the use of beta-blockers, and the use of statins as significant predictors of MARCE (all with P values < 0.05). Notably, the CONUT score and SII included albumin level, total cholesterol level, lymphocyte count, platelet count, and N/L; therefore, these variables were excluded from the Cox regression analysis.
 |
Table 3 Univariable and Multivariable Cox Regression Analyses for MARCE in the Training Set |
Development and Validation of the Nomogram
The six variables that were included in the nomogram model for predicting MARCE in patients with ACS and CKD were age, SII, CONUT score, LVEF, use of beta-blockers, and use of statins (Figure 2).
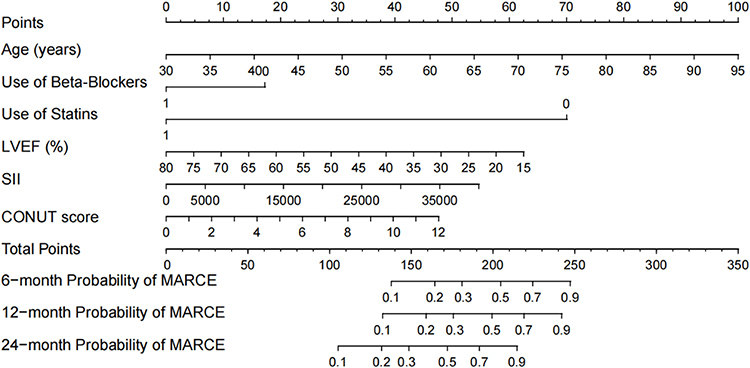 |
Figure 2 Nomogram for predicting the risk of MARCE in patients with ACS and CKD. |
In the training set, the AUC for the model was 0.935 (95% CI 0.894–0.973), 0.917 (95% CI 0.879–0.958), and 0.830 (95% CI 0.784–0.880) at 6, 12, and 24 months, respectively (Figure 3A). The calibration plots showed that the model’s predicted probabilities were close to the observed probabilities for all time points (Figure 4A–C). The DCA results indicated that the nomogram could bring net benefit when the threshold probabilities ranged from 0.017 to 0.789, 0.013 to 0.831, and 0.027 to 0.932 at 6, 12, and 24 months, respectively (Figure 5A).
 |
Figure 3 ROC curve for the nomogram predicting MARCE in patients with ACS and CKD. (A) Training set and (B) Validation set. |
 |
Figure 4 Calibration curve for predicting MARCE probability. (A) 6 months, (B) 12 months, and (C) 24 months in the training set; (D) 6 months, (E) 12 months, and (F) 24 months in the validation set. The nomogram-predicted probability is plotted on the X-axis, while the actual probability is plotted on the Y-axis. |
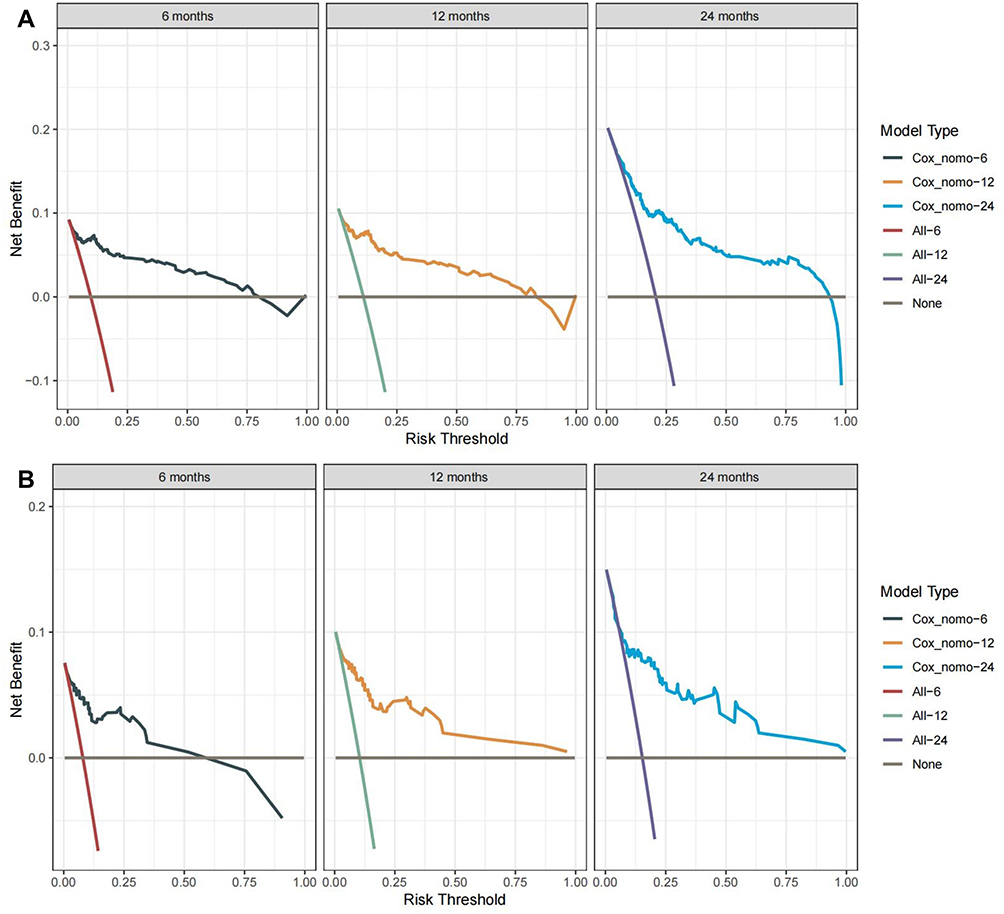 |
Figure 5 Decision curve analysis demonstrating the clinical usefulness of the nomogram in predicting MARCE in the training set (A) and validation set (B). |
In the validation set, the AUC was 0.889 (95% CI 0.812–0.966) at 6 months, 0.886 (95% CI 0.819–0.954) at 12 months, and 0.793 (95% CI 0.693–0.894) at 24 months (Figure 3B). The calibration plots presented in Figure 4D–F for the nomogram demonstrate excellent agreement between the observed and predicted probabilities across all time points, indicating a high degree of consistency and accuracy in the predictive model. The decision curves revealed a broad spectrum of high-risk threshold probabilities within the validation set, implying that the nomogram possesses significant clinical utility and can inform decision-making across a variety of scenarios (Figure 5B).
Comparison of Nomogram with GRACE Score
In the training and validation sets, we compared the performance of the nomogram with the GRACE score in terms of AUC, IDI, and NRI (Table 4). The results showed that the nomogram had better discrimination and reclassification ability than the GRACE score.
 |
Table 4 Comparisons of the Risk Scores for Predicting MARCE |
Sensitivity Analysis in the Whole Cohort
Patients with ACS and CKD have comorbidities such as elderly, hypertension, and diabetes. For sensitivity analysis, we calculate AUC values in different subgroups of the whole cohort (Table 5). Subgroup analysis revealed that the nomogram had a relatively great discrimination ability across different subgroups (Age, Sex, Hypertension, Diabetes, Type of ACS, and eGFR).
 |
Table 5 Sensitivity Analysis in the Whole Cohort |
External Validation
Based on the data from 278 cases collected between December 2021 and January 2024, which served as an external dataset, 79 patients experienced MARCE events, while 199 did not. The model built from the training set was used for external validation. The AUC for the external validation population was 0.81 (95% CI: 0.71–0.92) (Figure 6A). The predictive model was discriminative, indicating that the model could be extrapolated to a certain extent. The calibration curve showed that the predicted probabilities of the model were close to the actually observed probabilities, demonstrating a certain degree of consistency (Figure 6B). Decision curve analysis indicated a broad range of threshold probabilities for predicting MARCE in patients (Figure 6C), suggesting that using this nomogram for MARCE prediction would provide greater clinical benefit than standard treatment-none or treat-all approaches.
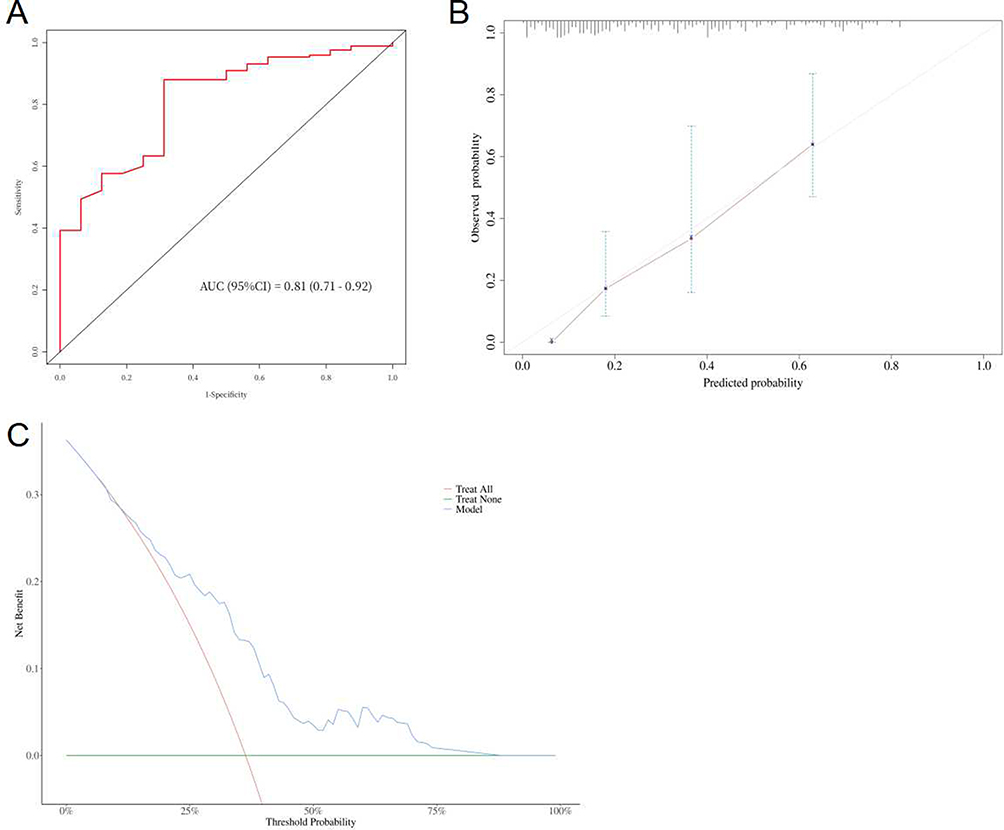 |
Figure 6 External validation of ROC curve (A), calibration curve (B), and decision curve analysis (C). |
Discussion
In this study, we have developed a nomogram aimed at accurately predicting the risk of MARCE in patients diagnosed with ACS and CKD. Based on univariable and multivariable analyses, this nomogram had the following six predictors: age, SII, CONUT score, LVEF, use of beta-blockers, and use of statins. The prediction model of MARCE risk demonstrated good discrimination and calibration ability. To the best of our knowledge, this nomogram represents the inaugural clinical prediction model specifically designed to forecast the risk of MARCE in patients with concurrent ACS and CKD. Notably, in our study, the CONUT score and SII were included in the prediction model for predicting MARCE.
The primary treatment for ACS is typically PCI.2,11 However, studies have shown limited benefits of invasive treatment for patients with CKD, as they often experience a high incidence of postoperative cardiovascular and renal events.5,6,30 To address this, stratification models have been established to identify patients at high risk of MARCE and implement early interventions following PCI to reduce such events and preserve kidney function.7
Effective risk stratification models have been previously developed, but their clinical application is limited for patients with CKD.8–10 The classic risk score, GRACE, has been in use for decades but may not accurately predict outcomes in patients with CKD.13 These models were developed in populations without advanced CKD and incorporated serum creatinine and cardiac markers, which could be elevated in patients with renal function impairment.12 Consequently, the prognostic impact of these variables may be diminished among patients with CKD, leading to an underestimation of major events.13 Additionally, previous models focused only on cardiovascular events and did not account for kidney endpoints, making them less accurate in predicting the cardiovascular and renal events that occur in patients with ACS and CKD.
ACS is triggered by the rupture of atherosclerotic plaques, which is caused by a chronic inflammatory response.31 Patients with CKD have higher inflammatory burden and incidence of malnutrition.17,32,33 Malnutrition and inflammation may interact to contribute to the development of atherosclerosis, which can worsen as renal function declines.16,17 In recent years, the interaction between inflammation, malnutrition, and atherosclerosis has been termed the malnutrition–inflammation–atherosclerosis syndrome, which is strongly associated with death, adverse cardiovascular events, and deterioration of renal function.17–19
The CONUT score, initially devised as a screening instrument for malnutrition, incorporates serum albumin level, total cholesterol level, and total blood lymphocyte count as its key components.21 Recent research endeavors have unveiled a significant correlation between the CONUT score and both mortality and cardiovascular events among individuals afflicted with cardiovascular diseases, as well as those with kidney diseases.20,22,34,35 Reportedly, high CONUT scores are associated with worsening renal function.35,36 Serum albumin levels reflect both systemic inflammation and nutritional status,37 while a decline in lymphocyte count may result from acute stress or gradual depletion of bodily reserves.38 Total cholesterol levels are correlated with metabolism, antioxidant reserve, and inflammatory response.39,40 Considering these factors, the CONUT score could be a powerful predictor to predict MARCE in patients with ACS and CKD.
SII is an inflammatory index introduced in recent years that comprehensively reflects the inflammation and immune system status of patients.23 In the study by Zhu, SII was identified as a valid predictor for cardiovascular events among patients with STEMI, which is consistent with our research.25 An elevated level of SII has been found to be associated with increased mortality in patients with CKD;41,42 however, its predictive value for risk stratification has not been validated. From a pathophysiological perspective, neutrophils play a mediating role in renal tubular injury and induce atherosclerotic plaque rupture and thrombosis.43,44 As inflammation and immune response increase, platelets tend to increase and adhere to the surface of the endothelial cells, leading to local ischemia, hypoxia, and microthrombosis.45,46 Studies have validated that platelet count is a strong predictor of death, reinfarction, kidney injury, and stroke.47,48
Several studies have included age as a predictor to estimate mortality and cardiovascular events in patients with ACS.8–10 LVEF is another widely accepted indicator that serves to mirror the deterioration of both cardiac and renal function, and it has been shown to predict adverse outcomes in both cardiovascular and kidney diseases.9,10,49 As an optimal medication recommended by cardiovascular guidelines,11 the use of beta-blockers was found to be a protective factor against MARCE in patients with CKD.50 Furthermore, beta-blockers have been found to decrease renal oxygen consumption and increase renal plasma flow, which can prevent worsening renal function.51,52 Moreover, statins exhibit protective effects in both patients with CKD and cardiovascular diseases.53,54 Despite the protective effects demonstrated by beta-blockers and statins, patients with ACS and CKD are less likely to receive these evidence-based therapies,4,5,7,55 which suggests that the administration of these drugs could predict a favorable prognosis. In recent years, emerging cardiorenal biomarkers have been found to play a key role in the diagnosis and prognosis of cardiorenal syndrome.14 It is necessary to apply these novel cardiorenal markers to patients with ACS and CKD in the future.
Nevertheless, our study has some limitations. First, the dataset used to develop the model was obtained from a single center, and the sample size was moderate. Second, although the model was internally validated, further multi-center studies, particularly those involving other ethnic groups, are necessary to strengthen the credibility and clinical applicability of the results. Thirdly, the retrospective design of the study may introduce biases pertaining to data acquisition and patient selection. Last, the exclusion of patients with hematologic or rheumatic immune system diseases made the etiology of CKD patients incomplete, although the etiology of CKD could be an important implication.
Conclusion
In this study, we developed a nomogram that incorporated the CONUT score and SII, which demonstrated high accuracy and clinical utility in predicting MARCE at 6, 12, and 24 months. The risk stratification provided by this nomogram could facilitate the identification of modifiable variables for interventions that could benefit patients with ACS and CKD. Nonetheless, external validations of this model are warranted before its widespread clinical application.
Data Sharing Statement
The raw data supporting the conclusion of this article will be made available by the authors without undue reservation.
Ethics Statement
This retrospective study was conducted at the First Affiliated Hospital of Wenzhou Medical University, and it did not require patient consent to review their medical records as per the guidelines set by the Ethics Review Board. Due to the nature of this study being retrospective and the research data being sourced from the hospital’s electronic medical record system, which does not involve direct intervention or additional risks to patients’ current treatment, it is reasonable to exempt patient consent for this study. The study adhered to the principles of data confidentiality and ensured that all personal information was anonymized to protect patient privacy. Furthermore, the research complied with the ethical standards outlined in the Helsinki Declaration for medical research involving human subjects.
Acknowledgments
We appreciate all the participants who contributed to this study. We gratefully acknowledge the significant contributions of Miss Ling Cheng, Miss San-ling Shi, Mr Yu-cheng Lu, Miss Shu-ting Kong, Dr Shizhi Chen, and Dr He Zou, as well as Mr Ruihao Jiang, Mr Jianhan Zhu, Mr Di Xu, and Mr Ken Lin, whose dedication, support, and expertise were instrumental to the success of this research.
Funding
Dr. Hao Zhou wishes to acknowledge the support from the National Natural Science Foundation of China (81800048 and 81873468) and Science and Technology Planning Project of Wenzhou Science & Technology Bureau of Zhejiang Province of China (Y20160118).
Disclosure
The authors report no conflict of interest.
References
1. Go AS, Chertow GM, Fan D, McCulloch CE, Hsu CY. Chronic kidney disease and the risks of death, cardiovascular events, and hospitalization. N Engl J Med. 2004;351:1296–1305. doi:10.1056/NEJMoa041031
2. Fox CS, Muntner P, Chen AY, et al. Use of evidence-based therapies in short-term outcomes of ST-segment elevation myocardial infarction and non-ST-segment elevation myocardial infarction in patients with chronic kidney disease. Circulation. 2010;121:357–365. doi:10.1161/circulationaha.109.865352
3. Charytan D, Kuntz RE. The exclusion of patients with chronic kidney disease from clinical trials in coronary artery disease. Kidney Int. 2006;70(11):2021–2030. doi:10.1038/sj.ki.5001934
4. Smilowitz NR, Gupta N, Guo Y, Mauricio R, Bangalore S. Management and outcomes of acute myocardial infarction in patients with chronic kidney disease. Int J Cardiol. 2017;227:1–7. doi:10.1016/j.ijcard.2016.11.026
5. Charytan D, Mauri L, Agarwal A, Servoss S, Scirica B, Kuntz RE. The use of invasive cardiac procedures after acute myocardial infarction in long-term dialysis patients. Am Heart J. 2006;152(3):558–564. doi:10.1016/j.ahj.2006.02.021
6. Tsai TT, Patel UD, Chang TI, et al. Contemporary incidence, predictors, and outcomes of acute kidney injury in patients undergoing percutaneous coronary interventions: insights from the NCDR Cath-PCI registry. JACC Cardiovasc Interv. 2014;7(1):1–9. doi:10.1016/j.jcin.2013.06.016
7. Rangaswami J, Bhalla V, Blair JEA, et al. Cardiorenal syndrome: classification, pathophysiology, diagnosis, and treatment strategies: a scientific statement from the American Heart Association. Circulation. 2019;139(16):e840–e878. doi:10.1161/CIR.0000000000000664
8. Granger CB, Goldberg RJ, Dabbous O, et al. Predictors of hospital mortality in the global registry of acute coronary events. Arch Intern Med. 2003;163(19):2345–2353. doi:10.1001/archinte.163.19.2345
9. Halkin A, Singh M, Nikolsky E, et al. Prediction of mortality after primary percutaneous coronary intervention for acute myocardial infarction: the Cadillac risk score. J Am Coll Cardiol. 2005;45(9):1397–1405. doi:10.1016/j.jacc.2005.01.041
10. Farooq V, van Klaveren D, Steyerberg EW, et al. Anatomical and clinical characteristics to guide decision making between coronary artery bypass surgery and percutaneous coronary intervention for individual patients: development and validation of SYNTAX score II. Lancet. 2013;381(9867):639–650. doi:10.1016/S0140-6736(13)60108-7
11. Amsterdam EA, Wenger NK, Brindis RG, et al. 2014 AHA/ACC guideline for the management of patients with non-ST-elevation acute coronary syndromes: executive summary: a report of the American College of Cardiology/American Heart Association task force on practice guidelines [published correction appears in Circulation. 2014 Dec 23;130(25):e431–e432. Dosage error in article text]. Circulation. 2014;130(25):2354–2394. doi:10.1161/CIR.0000000000000133
12. Li D, Jialal I, Keffer J. Greater frequency of increased cardiac troponin T than increased cardiac troponin I in patients with chronic renal failure. Clin Chem. 1996;42(1):114–115. doi:10.1093/clinchem/42.1.114
13. Gurm HS, Gore JM, Anderson FA, et al. Comparison of acute coronary syndrome in patients receiving versus not receiving chronic dialysis (from the Global Registry of Acute Coronary Events [GRACE] Registry). Am J Cardiol. 2012;109(1):19–25. doi:10.1016/j.amjcard.2011.07.062
14. Gembillo G, Visconti L, Giusti MA, et al. Cardiorenal syndrome: new pathways and novel biomarkers. Biomolecules. 2021;11(11):1581. doi:10.3390/biom11111581
15. Khan SS, Coresh J, Pencina MJ, et al. Novel prediction equations for absolute risk assessment of total cardiovascular disease incorporating cardiovascular-kidney-metabolic health: a scientific statement from the American Heart Association. Circulation. 2023;148(24):1982–2004. doi:10.1161/CIR.0000000000001191
16. Hatamizadeh P, Fonarow GC, Budoff MJ, Darabian S, Kovesdy CP, Kalantar-Zadeh K. Cardiorenal syndrome: pathophysiology and potential targets for clinical management. Nat Rev Nephrol. 2013;9(2):99–111. doi:10.1038/nrneph.2012.279
17. Peev V, Nayer A, Contreras G. Dyslipidemia, malnutrition, inflammation, cardiovascular disease and mortality in chronic kidney disease. Curr Opin Lipidol. 2014;25(1):54–60. doi:10.1097/MOL.0000000000000045
18. Sueta D, Hokimoto S, Sakamoto K, et al. Validation of the high mortality rate of malnutrition-inflammation-atherosclerosis syndrome: community-based observational study. Int J Cardiol. 2017;230:97–102. doi:10.1016/j.ijcard.2016.12.072
19. Akdag I, Yilmaz Y, Kahvecioglu S, et al. Clinical value of the malnutrition-inflammation-atherosclerosis syndrome for long-term prediction of cardiovascular mortality in patients with end-stage renal disease: a 5-year prospective study. Nephron Clin Pract. 2008;108(2):c99–c105. doi:10.1159/000113526
20. Zhou H, Chao W, Cui L, Li M, Zou Y, Yang M. Controlling Nutritional Status (CONUT) score as immune-nutritional predictor of outcomes in patients undergoing peritoneal dialysis. Clin Nutr. 2020;39(8):2564–2570. doi:10.1016/j.clnu.2019.11.018
21. Ignacio de Ulíbarri J, González-Madroño A, de Villar NG, et al. CONUT: a tool for controlling nutritional status. First validation in a hospital population. Nutr Hosp. 2005;20(1):38–45.
22. Raposeiras Roubín S, Abu Assi E, Cespón Fernandez M, et al. Prevalence and prognostic significance of malnutrition in patients with acute coronary syndrome. J Am Coll Cardiol. 2020;76(7):828–840. doi:10.1016/j.jacc.2020.06.058
23. Hu B, Yang XR, Xu Y, et al. Systemic immune-inflammation index predicts prognosis of patients after curative resection for hepatocellular carcinoma. Clin Cancer Res. 2014;20(23):6212–6222. doi:10.1158/1078-0432.CCR-14-0442
24. Qiu H, Zhu Y, Shen G, Wang Z, Li W. A predictive model for contrast-induced acute kidney injury after percutaneous coronary intervention in elderly patients with ST-segment elevation myocardial infarction. Clin Interv Aging. 2023;18:453–465. doi:10.2147/CIA.S402408
25. Zhu Y, He H, Qiu H, Shen G, Wang Z, Li W. Prognostic value of systemic immune-inflammation index and NT-proBNP in patients with acute ST-elevation myocardial infarction. Clin Interv Aging. 2023;18:397–407. doi:10.2147/CIA.S397614
26. Thygesen K, Alpert JS, Jaffe AS, et al. Fourth universal definition of myocardial infarction (2018). J Am Coll Cardiol. 2018;72(18):2231–2264. doi:10.1016/j.jacc.2018.08.1038
27. Levey AS, Stevens LA, Schmid CH, et al. A new equation to estimate glomerular filtration rate [published correction appears in Ann Intern Med. 2011 Sep 20; 155(6):408]. Ann Intern Med. 2009;150(9):604–612. doi:10.7326/0003-4819-150-9-200905050-00006
28. Collins GS, Reitsma JB, Altman DG, Moons KG. Transparent reporting of a multivariable prediction model for individual prognosis or diagnosis (TRIPOD): the TRIPOD statement. BMJ. 2015;350:g7594. doi:10.1136/bmj.g7594
29. White IR, Royston P, Wood AM. Multiple imputation using chained equations: issues and guidance for practice. Stat Med. 2011;30(4):377–399. doi:10.1002/sim.4067
30. Szummer K, Lundman P, Jacobson SH, et al. Influence of renal function on the effects of early revascularization in non-ST-elevation myocardial infarction: data from the Swedish Web-System for Enhancement and Development of Evidence-Based Care in Heart Disease Evaluated According to Recommended Therapies (SWEDEHEART). Circulation. 2009;120(10):851–858. doi:10.1161/CIRCULATIONAHA.108.838169
31. Lehrke M, Millington SC, Lefterova M, et al. CXCL16 is a marker of inflammation, atherosclerosis, and acute coronary syndromes in humans. J Am Coll Cardiol. 2007;49(4):442–449. doi:10.1016/j.jacc.2006.09.034
32. Gupta J, Mitra N, Kanetsky PA, et al. Association between albuminuria, kidney function, and inflammatory biomarker profile in CKD in CRIC. Clin J Am Soc Nephrol. 2012;7(12):1938–1946. doi:10.2215/CJN.03500412
33. Amdur RL, Feldman HI, Dominic EA, et al. Use of measures of inflammation and kidney function for prediction of atherosclerotic vascular disease events and death in patients with CKD: findings from the CRIC study. Am J Kidney Dis. 2019;73(3):344–353. doi:10.1053/j.ajkd.2018.09.012
34. Sze S, Pellicori P, Kazmi S, et al. Prevalence and prognostic significance of malnutrition using 3 scoring systems among outpatients with heart failure: a comparison with body mass index. JACC Heart Fail. 2018;6(6):476–486. doi:10.1016/j.jchf.2018.02.018
35. Tsuda S, Nakayama M, Tanaka S, et al. The association of controlling nutritional status score and prognostic nutritional index with cardiovascular diseases: the Fukuoka kidney disease registry study. J Atheroscler Thromb. 2023;30(4):390–407. doi:10.5551/jat.63501
36. Otaki Y, Watanabe T, Shimizu M, et al. Association of malnutrition with renal dysfunction and clinical outcome in patients with heart failure. Sci Rep. 2022;12(1):16673. doi:10.1038/s41598-022-20985-z
37. Soeters PB, Wolfe RR, Shenkin A. Hypoalbuminemia: pathogenesis and clinical significance. JPEN J Parenter Enteral Nutr. 2019;43(2):181–193. doi:10.1002/jpen.1451
38. Núñez J, Miñana G, Bodí V, et al. Low lymphocyte count and cardiovascular diseases. Curr Med Chem. 2011;18(21):3226–3233. doi:10.2174/092986711796391633
39. Oh TK, Kim HH, Park DJ, et al. Association of preoperative serum total cholesterol level with postoperative pain outcomes after laparoscopic surgery for gastric cancer. Pain Pract. 2018;18(6):729–735. doi:10.1111/papr.12659
40. Wang Q, Lau WY, Zhang B, et al. Preoperative total cholesterol predicts postoperative outcomes after partial hepatectomy in patients with chronic hepatitis B- or C-related hepatocellular carcinoma. Surgery. 2014;155(2):263–270. doi:10.1016/j.surg.2013.08.017
41. Lai W, Xie Y, Zhao X, et al. Elevated systemic immune inflammation level increases the risk of total and cause-specific mortality among patients with chronic kidney disease: a large multi-center longitudinal study. Inflamm Res. 2023;72(1):149–158. doi:10.1007/s00011-022-01659-y
42. Guo W, Song Y, Sun Y, et al. Systemic immune-inflammation index is associated with diabetic kidney disease in Type 2 diabetes mellitus patients: evidence from NHANES 2011–2018. Front Endocrinol. 2022;13:1071465. doi:10.3389/fendo.2022.1071465
43. Klopf J, Brostjan C, Eilenberg W, Neumayer C. Neutrophil extracellular traps and their implications in cardiovascular and inflammatory disease. Int J Mol Sci. 2021;22(2):559. doi:10.3390/ijms22020559
44. Petzold T, Zhang Z, Ballesteros I, et al. Neutrophil “plucking” on megakaryocytes drives platelet production and boosts cardiovascular disease. Immunity. 2022;55(12):2285–2299.e7. doi:10.1016/j.immuni.2022.10.001
45. Schrottmaier WC, Mussbacher M, Salzmann M, Assinger A. Platelet-leukocyte interplay during vascular disease. Atherosclerosis. 2020;307:109–120. doi:10.1016/j.atherosclerosis.2020.04.018
46. Hally KE, La Flamme AC, Larsen PD, Harding SA. Platelet Toll-like receptor (TLR) expression and TLR-mediated platelet activation in acute myocardial infarction. Thromb Res. 2017;158:8–15. doi:10.1016/j.thromres.2017.07.031
47. Nikolsky E, Grines CL, Cox DA, et al. Impact of baseline platelet count in patients undergoing primary percutaneous coronary intervention in acute myocardial infarction (from the Cadillac trial). Am J Cardiol. 2007;99(8):1055–1061. doi:10.1016/j.amjcard.2006.11.066
48. Jansen MPB, Florquin S, Roelofs JJTH. The role of platelets in acute kidney injury. Nat Rev Nephrol. 2018;14(7):457–471. doi:10.1038/s41581-018-0015-5
49. Huang TH, Chiu H, Wu PY, et al. The association of echocardiographic parameters on renal outcomes in chronic kidney disease. Ren Fail. 2021;43(1):433–444. doi:10.1080/0886022X.2021.1885444
50. Toyama T, Kasama S, Sato M, et al. Most important prognostic values to predict major adverse cardiovascular, cerebrovascular, and renal events in patients with chronic kidney disease including hemodialysis for 2 years. Cardiology. 2019;142(1):14–23. PMID: 30865950. doi:10.1159/000496330
51. Limkunakul C, Srisantithum B, Lerdrattanasakulchai Y, Laksomya T, Jungpanich J, Sawanyawisuth K. Any heart failure treatments associated with worsening renal function in patients admitted due to acute heart failure? Ren Fail. 2021;43(1):123–127. doi:10.1080/0886022X.2020.1858100
52. Hall ME, Rocco MV, Morgan TM, et al. Beta-blocker use is associated with higher renal tissue oxygenation in hypertensive patients suspected of renal artery stenosis. Cardiorenal Med. 2016;6(4):261–268. doi:10.1159/000445302
53. Natanzon SS, Matetzky S, Beigel R, et al. Statin therapy among chronic kidney disease patients presenting with acute coronary syndrome. Atherosclerosis. 2019;286:14–19. doi:10.1016/j.atherosclerosis.2019.05.002
54. Hsiao CC, Yeh JK, Li YR, et al. Statin uses in adults with non-dialysis advanced chronic kidney disease: focus on clinical outcomes of infectious and cardiovascular diseases. Front Pharmacol. 2022;13:996237. doi:10.3389/fphar.2022.996237
55. El-Menyar A, Zubaid M, Sulaiman K, et al. In-hospital major clinical outcomes in patients with chronic renal insufficiency presenting with acute coronary syndrome: data from a Registry of 8176 patients. Mayo Clin Proc. 2010;85(4):332–340. doi:10.4065/mcp.2009.0513
 © 2024 The Author(s). This work is published and licensed by Dove Medical Press Limited. The
full terms of this license are available at https://www.dovepress.com/terms.php
and incorporate the Creative Commons Attribution
- Non Commercial (unported, 3.0) License.
By accessing the work you hereby accept the Terms. Non-commercial uses of the work are permitted
without any further permission from Dove Medical Press Limited, provided the work is properly
attributed. For permission for commercial use of this work, please see paragraphs 4.2 and 5 of our Terms.
© 2024 The Author(s). This work is published and licensed by Dove Medical Press Limited. The
full terms of this license are available at https://www.dovepress.com/terms.php
and incorporate the Creative Commons Attribution
- Non Commercial (unported, 3.0) License.
By accessing the work you hereby accept the Terms. Non-commercial uses of the work are permitted
without any further permission from Dove Medical Press Limited, provided the work is properly
attributed. For permission for commercial use of this work, please see paragraphs 4.2 and 5 of our Terms.