")
Back to Journals » Journal of Pain Research » Volume 17
Abnormal Topological Organization of Human Brain Connectome in Primary Dysmenorrhea Patients Using Graph Theoretical Analysis
Authors Chen RB , Zhong MY, Zhong YL
Received 22 March 2024
Accepted for publication 13 August 2024
Published 27 August 2024 Volume 2024:17 Pages 2789—2799
DOI https://doi.org/10.2147/JPR.S470194
Checked for plagiarism Yes
Review by Single anonymous peer review
Peer reviewer comments 2
Editor who approved publication: Dr Jinlei Li
Ri-Bo Chen,1,* Mei-Yi Zhong,2,* Yu-Lin Zhong3
1Department of Radiology, Jiangxi Provincial People’s Hospital, The First Affiliated Hospital of Nanchang Medical College, Nanchang, Jiangxi, 330006, People’s Republic of China; 2The First Clinical Medical College, Jiangxi Medical College, Nanchang University, Nanchang, Jiangxi, 330006, People’s Republic of China; 3Department of Ophthalmology, Jiangxi Provincial People’s Hospital, The First Affiliated Hospital of Nanchang Medical College, Nanchang, Jiangxi, 330006, People’s Republic of China
*These authors contributed equally to this work
Correspondence: Yu-Lin Zhong, Department of Ophthalmology, Jiangxi Provincial People’s Hospital, No. 152, Ai Guo Road, Dong Hu District, Nanchang, Jiangxi, 330006, People’s Republic of China, Tel +86 15970475954, Email [email protected]
Background: Accumulating studies have revealed altered brain function and structure in regions linked to sensory, pain and emotion in individuals with primary dysmenorrhea (PD). However, the changes in the topological properties of the brain’s functional connectome in patients with PD experiencing chronic pain remain poorly understood.
Purpose: Our study aimed to explore the mechanism of functional brain network impairment in individuals withPD through a graph-theoretic analysis.
Material and Methods: This study was a randomized controlled trial that included individuals with PD and healthy controls (HC) from June 2021 to June 2022. The experiment took place in the magnetic resonance imaging facility at Jiangxi Provincial People’s Hospital. Static MRI scans were conducted on 23 female patients with PD and 23 healthy female controls. A two-sample t-test was conducted to compare the global and nodal indices between the two groups, while the Network-Based Statistics (NBS) method was utilized to explore the functional connectivity alterations between the groups.
Results: In the global index, The PD group exhibited decreased Sigma (p = 0.0432) and Gamma (p = 0.0470) compared to the HC group among the small-world network properties.(p< 0.05) In the nodal index, the PD group displayed reduced betweenness centrality and increased degree centrality in the default mode network (DMN), along with decreased nodal efficiency and increased degree centrality in the visual network (VN). (P < 0.05, Bonferroni-corrected) Furthermore, in the connection analysis, PD patients showed altered functional connectivity in the basal ganglia network (BGN), VN, and DMN.(NBS corrected).
Conclusion: Our results indicate that individuals with PD showed abnormal brain network efficiency and abnormal connection within DMN, VN and BGN related to pain matrix. These findings have important references for understanding the neural mechanism of pain in PD.
Keywords: primary dysmenorrhea, graph theory, functional connectivity, resting-state functional magnetic resonance imaging
Introduction
Dysmenorrhea is classified pathophysiologically into primary dysmenorrhea, with no identified pelvic pathology or physical abnormalities, and secondary dysmenorrhea, which is linked to potential pelvic pathology.1. The characteristics of PD occurred before menstrual period or periods of lower abdominal pain.2 It is the most prevalent gynecological issue, impacting 90% of adolescent girls and over 50% of menstruating women globally.3 Numerous risk factors contribute to PD, encompassing biological, psychological, social, and lifestyle influences.4,5 Current studies indicate that the pathogenesis of dysmenorrhea is attributed to increased secretion of Prostaglandin F2a (PGF2α) and Prostaglandin E2 (PGE2), leading to the contraction of uterine vessels and muscles.6,7
Changes in brain structure, function, and metabolism have been revealed in individuals with PD.8 Liu et al found that alterations in interregional functional connectivity in PD patients mainly observed between the limbic pathway regions of the cortical mesolimbic region and sensory and motor-related regions.9 Huo et al discovered structural abnormalities and related functional alterations in multiple brain regions in patients with PD, particularly those crucial for the emotional and sensory components of dysmenorrhea.10 Yu et al found changes in frequency-specific functional connection density in PD patients.11 Zhang et al found that the low-frequency fluctuation amplitude of multiple brain regions in PD patients was reduced compared with HC.12 In a series of neuroimaging studies, functional magnetic resonance imaging (fMRI) played a crucial role in diagnosing primary dysmenorrhea (PD). Dong et al utilized fMRI to identify alterations in brain activity before and after acupuncture treatment, providing diagnostic insights into the effectiveness of acupuncture for PD patients.13 Yang et al employed fMRI to detect changes in brain activity pre- and post-acupuncture treatment.14 In the study conducted by Tu et al, fMRI was utilized to explore potential alterations in the descending pain regulatory system in individuals with PD following acupuncture treatment.15 This method enables a deeper exploration of the central mechanisms of PD and offers a fresh perspective on comprehending the pathogenesis of dysmenorrhea. However, the presence of noticeable individual variations in fMRI results poses certain limitations on its diagnostic utility for PD. Current research primarily emphasizes the functional and structural changes in specific brain regions among individuals with PD, the investigation of brain network topology and functional connectivity in PD patients through graph theory has been relatively overlooked, which is the focus of our research.
Previous knowledge indicates that the neurons in the brain form a intricate network, which serves as the physiological foundation for information processing in the brain.16 These methods offer a robust approach for quantifying both the structural and functional systems of the brain.17 In graph theory, a network is represented as a graph G (nodal, the number of edges).18 The topology of a graph is defined as a network comprising nodes and their interconnected edges, represented concisely in a link matrix format.19 Graph theory has been widely used to study the neural mechanism of various diseases such as major depressive disorder (MDD)20 birth defects21 and multiple sclerosis (MS).22 Thus, Our study will use graph theory to further investigate the brain topology of patients with primary dysmenorrhea.
This study compared the HC group with the PD group using static fMRI to investigate potential abnormal global and nodal network properties and variations in brain connectivity topology in PD patients.
Materials and Methods
Participate
In a randomized controlled trial, Ethical decision number: 202310114.23 patients with PD and 23 healthy individuals (HC) from Jiangxi Provincial People’s Hospital were recruited. Our disease diagnosis is performed by an experienced gynecologist for PD diagnosis. All participants met the inclusion criteria detailed as follows: (1) no contraindications to MRI scanning; (2) absence of claustrophobia; and (3) no history of cardiac or brain diseases.
The inclusion criteria for PD patients encompassed: (1) females aged 16–30 years experiencing infertility, right-handed; (2) regular menstrual cycle between 21–35 days; (3) patients with at least 1-year history of PD; and (4) a visual analog score of menstrual pain (VAS) of 40 or higher in the past three months (0=no pain sensation, 100=the worst pain sensation) in the three recent menstrual cycles; (5) no exogenous hormones or centrally acting medicine in the previous 6 months.
Exclusion criteria for PD were as follows: (1) secondary dysmenorrhea caused by pelvic organic diseases, such as endometriosis, pelvic inflammation and so on; (2) having severe life-threatening disease, asthma, or psychiatric disorder (anxiety and depression), etc.; (3) any oral contraceptives, analgesics and antidepressant having been used within 6 months; (4) having any contraindication of MRI examination.
The HC met the following inclusion criteria: (1) Absence of abdominal pain symptoms or diseases; (2) No history of cardiovascular disease or mental disorders; (3) No contraindications to MRI scans.
MRI Parameters
MRI scanning was conducted using a 3-Tesla magnetic resonance scanner (Discovery MR 750W system; GE Healthcare, Milwaukee, WI, USA) equipped with an eight-channel head coil. In the process of the experiment, we adopted a randomized controlled study, in the process of subjects undergoing FMRI scanning, participants participated in the blind method, and the identity of the two groups of subjects was disclosed after the final experiment was completed. The whole-brain fMRI data was recorded by applying gradient-recalled echo-planar imaging sequence with parameters as follows: TR/TE, 2000 ms/25 ms; gap, 1.2 mm, thickness, 3.0 mm; FOV, 240×240 mm2; acquisition matrix, 64 × 64; 35 axial slices; and flip angle, 90°. The whole scanning time was ~15 min, and a total of 240 volumes of functional images were acquired. Participants were instructed to keep their eyes closed and maintain stillness during the scan, while being reminded not to fall asleep.
Ethical Statement
Research involving human subjects adhered to the principles outlined in the Declaration of Helsinki and received approval from the Medical Ethics Committee of Jiangxi Provincial People’s Hospital. All participants provided written informed consent before participating in the study.
Data Preprocessing
Based on statistical parameter mapping, fMRI data were preprocessed using the Brain Imaging Data Processing and Analysis Toolbox in MATLAB 2013a (Myers Walker, Natick, MA, USA).23 The procedures involved the following steps: (1) Converting the image format to NIFTI, with the exclusion of the initial 10 volumes. (2) Correcting for slice time effects and head motion. (3) Registering structural images with fMRI data. (4) Implementing linear regression analysis with multiple covariates. (5) Applying a time bandpass filter set at 0.01–0.08 Hz.24
Functional Network Construction
Node and Edge Definitions
The network was constructed by using the graph theoretical network analysis toolbox GRETNA (http://www.nitrc.org/projects/gretna/).25 Node definition involves segmenting each subject’s brain into 90 cortical and subcortical regions of interest based on the automated anatomical labeling technique (AAL) atlas.26 Pearson correlation coefficients were computed for the 90 brain regions, and these values were utilized as edges in the network, resulting in a 90×90 Pearson correlation coefficient matrix.
Network Analysis
Various sparsity (Sp) thresholds were applied to all correlation matrices, where Sp represents the ratio of the actual number of connections in the network to the maximum possible number of connections. A broad range of Sp levels (0.05 < Sp < 0.5, with an interval of 0.01) was examined. The area under the curve (AUC) was determined for each network metric from S1 to Sn across Sp values, with ∆S as the spacing.27 Figure 1 shows the process of data collection, processing and analysis.
 |
Figure 1 The entire data processing and analysis procedure using graph theory method is depicted. Initially, time series were extracted from the fMRI data. Subsequently, the whole brain was partitioned using the Automated Anatomical Labeling (AAL) atlas. Following this, brain networks for both the primary dysmenorrhea (PD) and healthy control (HC) groups were formed. Finally, the global and nodal properties alongside the connectivity of brain networks were computed. |
Global Metrics and Nodal Metrics of Functional Networks
At each threshold, both global and local brain functional network topological properties were computed. Global metrics encompassed network efficiency and small-world parameters. Network efficiency was further categorized into Eglob and Eloc, while small-world parameters consisted of the clustering coefficient (Cp), characteristic path length (Lp), Gamma, normalized characteristic path length (Lambda), and scalar small-world (Sigma).28 With γ = Cpreal / Cprand > 1 and λ = Lpreal / Lprand ≈ 1 as criteria, the small-world equations are constituted with σ = γ / λ > 1.
Node metrics of functional networks comprise betweenness centrality, degree centrality, clustering coefficient, nodal efficiency, nodal local efficiency, and nodal shortest path.
Statistical Analysis
A two-sample t-test was performed for global network parameters, with a significance level set at p < 0.05. Similarly, a two-sample t-test was conducted for node parameters, also at a significance level of p < 0.05, including Bonferroni correction. Age, menstrual cycle, and mean visual analog score served as covariates within the sparsity (Sp) range (0.05 < Sp < 0.5, using 0.01 intervals) to determine the area under the curve for each covariate.
Brain region pairs showing intergroup variations in junctional characteristics were initially pinpointed. Subsequently, the significance of these components was assessed using a network-based statistics (NBS) approach, incorporating age, menstrual cycle, and visual analog scores as covariates through a nonparametric permutation method (1000 permutations). A cluster of statistically significant alterations among any connectivity components was delineated (p < 0.01; threshold T = 2.649), thus pinpointing brain pairs with modified functional connectivity in patients with primary dysmenorrhea.
Result
Demographic Measurements
There was no significant difference in age (PD=24.26±1.00, HC=24.47±1.31), gender and handedness among the groups. For VAS, PD=54.2±17.4As shown in Table 1.
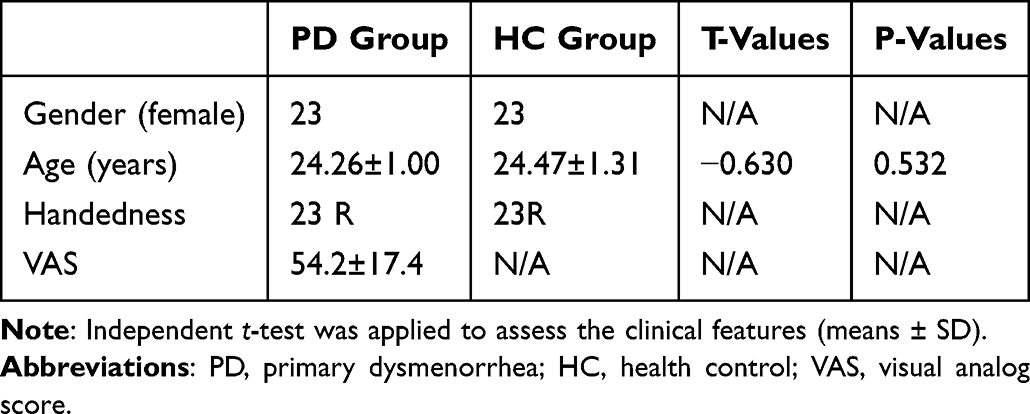 |
Table 1 Demographics and Visual Measurements Between Two Groups |
Small-World Properties of Functional Brain Networks
Within the defined threshold range (0.05 < Sp < 0.50, step= 0.01), the PD and HC groups were compared to exhibit small-world topological differences in the functional brain connectome. Table 2 demonstrates the global network parameters of the PD and HC groups, and the Gamma (p = 0.0432) and sigma (p = 0.0470) were significantly lower in the PD group than in the HC group. However, in other parameters: Eg (p=0.9524), Eloc (p=0.5046), Cp (p=0.7928), Lambda (p=0.5360), and Lp (p=0.3558) the two groups did not show a significant difference. (Figure 2)
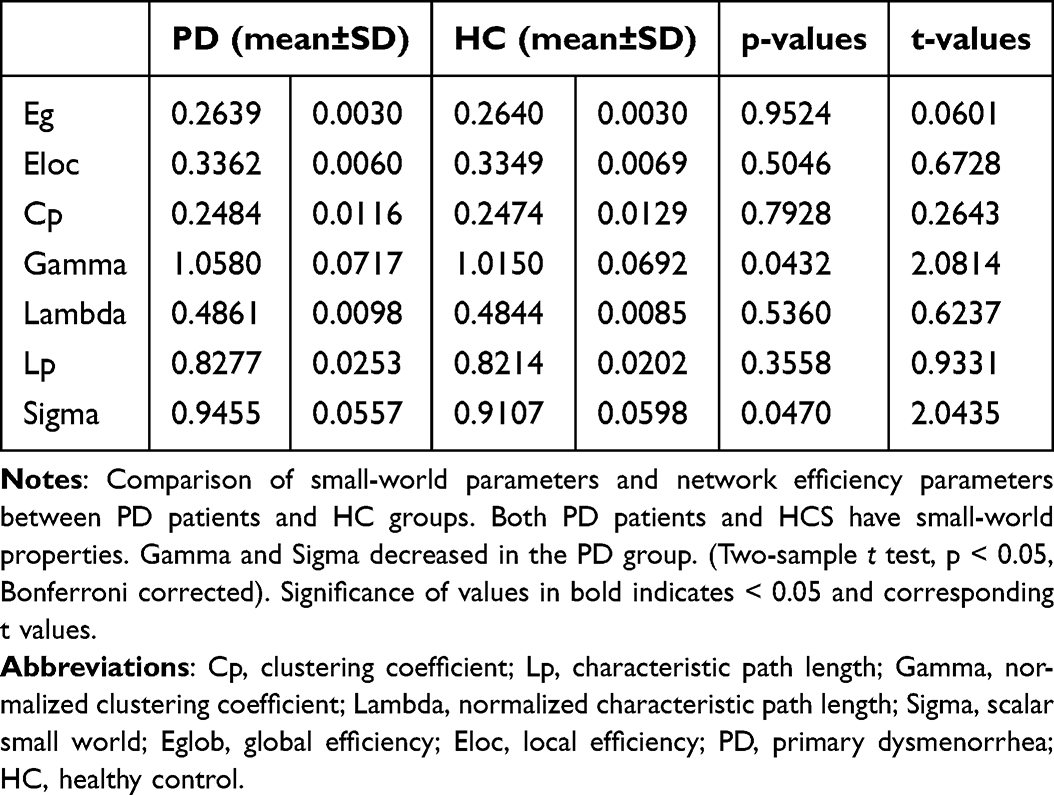 |
Table 2 Differences in Integrated Global Network Parameters Between Two Groups |
 |
Figure 2 In the defined sparsity range (0.10< S< 0.05), both the PD group and the HC group showed typical small-world properties (γ=Cpreal/ Cprand>1, λ=Lpreal/Lprand≈1). Circles and squares correspond to the mean PD and hc, respectively, and error bars correspond to the standard error of the subject group in each state. The AUCs of small word properties and network efficiency are represented by histograms. Abbreviations: Cp, clustering coefficient; Lp, characteristic path length; Gamma, normalized clustering coefficient; Lambda, normalized characteristic path length; Sigma, scalar small world; Eglob, global efficiency; Eloc, local efficiency; AUC, area under curve; PD, primary dysmenorrhea; HC, healthy control. |
Nodal Characteristics of Brain Functional Networks
We identified brain regions that exhibited significant between-group differences in at least one nodal metric between the two groups of PD and HC (p < 0.05, Bonferroni corrected). As shown in Table 3, compared with the HC group, the PD group showed a decrease in Betweenness Centrality on the Inferior frontal gyrus, opercular part (IFGoperc.R) (p=0.0002, t=−4.0455); an increase in Degree Centrality on both the Superior occipital gyrus (SOG.R)(p=0.0001, t=4.2021) and the Superior parietal gyrus (SPG.R)(p=0.0001, t=4.1232); and a decrease in nodal efficiency on the Superior occipital gyrus (SOG.R)(p=0.0004, t=3.8076). (Figure 3)
 |
Table 3 Significant Differences in Nodal Characteristics Between PD and HCs |
 |
Figure 3 Significant nodal characteristics map the differences between two groups. Abbreviations: IFGoperc. R, Inferior frontal gyrus, opercular part; SPG.R, Superior parietal gyrus; SOG. R, Superior occipital gyrus. Notes: Compared with the HC group, the PD group showed a decrease in Betweenness Centrality on the IFGoperc.R; an increase in Degree Centrality on both the SOG.R and the SPG.R; and a decrease in nodal efficiency on the SOG.R. |
Alterations in Brain Functional Connectivity
Using the NBS method in the PD and HC groups, a significantly altered network was identified, located mainly in the Frontal, Prefrontal, Occipital, Parietal and Subcortical. The network consisted of 11 connections and 11 nodes. Alterations in brain functional connectivity primarily including increased functional connectivity in the Frontal-Occipital, Prefrontal-Occipital, Frontal-Parietal, Occipital-Subcortical and Parietal-Subcortical, as well as decreased functional connectivity in the Prefrontal-Frontal, Prefrontal-Subcortical, Frontal-Subcortical and Subcortical-Subcortical.(ROL.R-SOG.R)(p=0.00009, t=4.32770),(OLF.L-SOG.R)(p=0.00089, t=3.56540)(ROL.R-SPG.R)(p=0.00001, t=5.14137),(SOG.R-PUT.R)(p=0.00011, t=4.25433),(SPG.R-PUT.R)(p=0.00001, t=4.93766)(REC.R-DCG.L)(p=0.00006, t=−4.42763),(REC.R-DCG.R)(p=0.00001, t=−4.89336),(ACG.L-CAU.L)(p=0.00049, t=−3.76694)(DCG.L-CAU.L)(p=0.00055, t=−3.72892),(ACG.L-CAU.R)(p=0.00054, t=−3.73545)(CAU.L-CAU.R)(p=0.00010t=−4.27647); These nodes are mainly located in the basal ganglia network (BGN), visual network (VN) and default mode network (DMN).(Table 4, Figure 4)
 |
Table 4 Significantly Altered Functional Connectivities in PD Patients Compared with HCs |
 |
Figure 4 PD-related alterations in FC. Abbreviations: ROL.R, Rolandic operculum; OLF.L, Olfactory cortex; SOG.R, Superior occipital gyrus; SPG. R, Superior parietal gyrus; REC.R, Gyrus rectus; DCG.L, Median cingulate and paracingulate gyri; ACG.L, Anterior cingulate and paracingulate gyri; CAU. L, Caudate nucleus; PUT.R, Lenticular nucleus, putamen; DCG.R, Median cingulate and paracingulate gyri; CAU. R, Caudate nucleus. Notes: NBS method identified a significantly altered network (11 nodes and 11 connections) in PD group relative to HCs. (P<0.01; threshold T=2.649). The PD patients showed abnormal long-distance and short-distance functional connections between/within VN, DMN and FPN. |
Discussion
In this study, we utilized resting-state fMRI and graph theory to examine changes in the topological organization of functional brain networks in PD patients. The key findings from the study are as follows: (1) PD patients exhibited reduced Gamma and Sigma compared to the healthy control (HC) group; (2) The PD group displayed a reduction in Betweenness Centrality in the Inferior frontal gyrus, opercular part, an increase in degree centrality in the superior occipital gyrus and superior parietal gyrus, and a decrease in nodal efficiency in the superior occipital gyrus; (3) Alterations in the functional connectivity were observed in the Basal Ganglia Network (BGN) (subcortical), Visual Network (VN) (occipital lobe), and Default Mode Network (DMN) (frontal lobe, prefrontal lobe, and parietal lobe) in PD patients.
Networks, viewed from both an intuitive and a formal graph theoretical standpoint, consist of items (or nodes) that are interconnected by pairwise relationships known as edges.29 Certainly, the brain can also be viewed as a network. We can conceptualize a brain network composed of billions of interconnected neurons, where cortical neurons are organized hierarchically into columns, functional areas, and functional systems.30 Prior research has established that the human brain network exhibits a well-connected system characterized by substantial small-world organization, featuring high clustering coefficients and short path lengths. This structural configuration promotes efficient segregation and integration of information while minimizing wiring and energy expenses.31 In this study, patients with PD exhibited reduced Gamma and Sigma values compared to the HC group. Gamma, in the context of network metrics, represents the difference in clustering coefficient (Cp) between the actual network and surrogate random networks. Cp reflects the degree to which neighboring nodes of a specific node are interconnected, indicating the level of local clustering.32 The term sigma in network metrics represents small-worldness, which signifies the balance within a network between randomness and order.28 In the study conducted by Wu et al, patients with PD exhibited a noteworthy reduction in global parameter stability and a marked increase in variability.33 Lee et al discovered that the small-world properties of functional brain networks were consistently observed in both the PD and control groups. The acute menstrual pain experienced by young individuals with PD did not impact the overall efficiency and small-world characteristics of resting-state functional brain networks.34,35 This discrepancy with our study results may be attributed to variations in subjects, imaging methodologies, and network analyses. Apart from investigating the global network topology, we also explored the nodal properties of functional network alterations in PD patients. Our research unveiled notable shifts in node properties among individuals with PD. Contrary to our findings, Lee et al observed that local network metrics remained unaltered in PD patients.17In the study conducted by Zhang et al, it was noted that patients with primary dysmenorrhea exhibited increased VMHC in the bilateral superior orbital frontal gyrus and the bilateral middle frontal gyrus in comparison to healthy controls.36 In the study by Liu et al, structural alterations were identified in the occipital lobe of patients with PD, raising the question of whether PD patients experience visual changes alongside the reported pain.9
Leveraging the Network-Based Statistic (NBS) approach, our investigation revealed aberrant functional connectivity patterns encompassing 11 nodes and 11 connections, predominantly situated within the Visual Network (VN), Default Mode Network (DMN), and Basal Ganglia Network (BGN). Existing research has indicated that women with PD may display anomalous functional connectivity among regions of the Default Mode Network (DMN).18 The DMN includes the frontal midline and posterior midline as well as extensive portions of the inferior parietal lobule.21,37 The DMN is inhibited during tasks that require external attention and is active during memory, imagining the future, and making social inferences.38 The study by Lee et al found that the brain response to skin heat pain in the PD group, namely the posterior part of the DMN, was significantly lower than that in the control group during the menstrual phase (pain phase).39 The study by Jones et al found significantly higher median DMN connectivity in the superior frontal gyrus, where pain frequency was higher.40 The study by Huang et al found decreased in-network FC in the left v DMN superior parietal lobule in the PD group.5 Aligned with the outcomes of the current study, disturbances related to the Default Mode Network (DMN) are prevalent among patients with PD, a sentiment echoed by numerous neuroimaging investigations. This discovery may offer novel perspectives on the underlying disease mechanisms. The basal ganglia network is chiefly involved in orchestrating movements while regulating cognitive and emotional reactions. Research by Shen et al revealed that functional connectivity (FC) between the amygdala (a component of the basal ganglia network) and the ventral tegmental area (VTA) was linked to plasma Prostaglandin E2 (PGE2) levels in PD patients.8 Research has indicated that individuals with PD exhibit alterations in the functional connectivity of the basal ganglia network. These findings imply that PD patients might experience difficulties in emotion and cognition, potentially contributing to a predisposition to depression among individuals with PD.41
Our study is subject to several limitations. Firstly, the sample size was small, potentially impacting the stability of the results. Secondly, variations in the choice of template regions could have influenced the outcomes of graph-based theoretical parameters. Furthermore, the assessment of neurological dysfunction in patients with primary dysmenorrhea was not included in the scope of this study. In the future study, we will study the longitudinal brain network changes in PD patients before and after treatment, and at the same time, we will use multimodal magnetic resonance imaging technology in the future to provide more precise biological markers for the mechanism of central nervous system changes in PD patients.
Conclusion
Our results indicate that individuals with PD showed abnormal brain network efficiency and abnormal connection within DMN, VN and BGN related to pain matrix. These findings have important references for understanding the neural mechanism of pain in PD, and provide important biological targets for the future neuroregulatory treatment of PD.
Data Sharing Statement
The raw data supporting the conclusions of this article will be made available. Further inquiries can be directly to the corresponding author.
Acknowledgments
We acknowledge the assistance provided by Jiangxi Provincial Health Technology Project (202210012, 202310114 and 202410008), and Jiangxi Provincial traditional Chinese Technology Project (2022B840 and 2023A0138).
Disclosure
The authors declare that they have no conflicts of interest with regard to this work.
References
1. Doğan H, Eroğlu S, Akbayrak T. The effect of kinesio taping and lifestyle changes on pain, body awareness and quality of life in primary dysmenorrhea. Complement Ther Clin Pract. 2020;39:101120. doi:10.1016/j.ctcp.2020.101120
2. Iacovides S, Avidon I, Baker FC. What we know about primary dysmenorrhea today: a critical review. Hum Reprod Update. 2015;21(6):762–778. doi:10.1093/humupd/dmv039
3. Low I, Wei SY, Lee PS, et al. Neuroimaging studies of primary dysmenorrhea. Adv Exp Med Biol. 2018;1099:179–199. doi:10.1007/978-981-13-1756-9_16
4. Fernández-Martínez E, Onieva-Zafra MD, Parra-Fernández ML. Lifestyle and prevalence of dysmenorrhea among Spanish female university students. PLoS One. 2018;13(8):e0201894. doi:10.1371/journal.pone.0201894
5. Yi SJ, Chen RB, Zhong YL, Huang X. The effect of long-term menstrual pain on large-scale brain network in primary dysmenorrhea patients. J Pain Res. 2022;15:2123–2131. doi:10.2147/JPR.S366268
6. Ferries-Rowe E, Corey E, Archer JS. Primary dysmenorrhea: diagnosis and therapy. Obstet Gynecol. 2020;136(5):1047–1058. doi:10.1097/AOG.0000000000004096
7. Chen B, Guo Q, Zhang Q, Di Z, Zhang Q. Revealing the central mechanism of acupuncture for primary dysmenorrhea based on neuroimaging: a narrative review. Pain Res Manag. 2023;2023:8307249. doi:10.1155/2023/8307249
8. Shen Z, Yu S, Wang M, et al. Abnormal amygdala resting-state functional connectivity in primary dysmenorrhea. Neuroreport. 2019;30(5):363–368. doi:10.1097/WNR.0000000000001208
9. Liu N, Li Y, Hong Y, et al. Altered brain activities in mesocorticolimbic pathway in primary dysmenorrhea patients of long-term menstrual pain. Front Neurosci. 2023;17:1098573. doi:10.3389/fnins.2023.1098573
10. Liu N, Huo J, Li Y, et al. Changes in brain structure and related functional connectivity during menstruation in women with primary dysmenorrhea. Quant Imaging Med Surg. 2023;13(2):1071–1082. doi:10.21037/qims-22-683
11. Yu S, Xu J, Shen Z, et al. Frequency-specific alterations in brain function in patients with primary dysmenorrhea. Pain Med Malden Mass. 2022;23(5):902–911. doi:10.1093/pm/pnab225
12. Zhang YN, Huo JW, Huang YR, Hao Y, Chen ZY. Altered amplitude of low-frequency fluctuation and regional cerebral blood flow in females with primary dysmenorrhea: a resting-state fMRI and arterial spin labeling study. J Pain Res. 2019;12:1243–1250. doi:10.2147/JPR.S177502
13. Dong X, Yang J, Wei W, et al. Efficacy and cerebral mechanism of acupuncture and moxibustion for treating primary dysmenorrhea: study protocol for a randomized controlled clinical trial. Trials. 2022;23(1):964. doi:10.1186/s13063-022-06675-1
14. Yang H, Li X, Guo XL, et al. Moxibustion for primary dysmenorrhea: a resting-state functional magnetic resonance imaging study exploring the alteration of functional connectivity strength and functional connectivity. Front Neurosci. 2022;16:969064. doi:10.3389/fnins.2022.969064
15. Tu CH, Lee YC, Chen YY, et al. Acupuncture treatment associated with functional connectivity changes in primary dysmenorrhea: a resting state fMRI study. J Clin Med. 2021;10(20):4731. doi:10.3390/jcm10204731
16. Sl B. Large-scale cortical networks and cognition. Brain Res Brain Res Rev. 1995;20(3). doi:10.1016/0165-0173(94)00016-i
17. B E, S O. Complex brain networks: graph theoretical analysis of structural and functional systems. Nat Rev Neurosci. 2009;10(3). doi:10.1038/nrn2575
18. Xia M, He Y. Magnetic resonance imaging and graph theoretical analysis of complex brain networks in neuropsychiatric disorders. Brain Connect. 2011;1(5):349–365. doi:10.1089/brain.2011.0062
19. Sporns O. Graph theory methods: applications in brain networks. Dialogues Clin Neurosci. 2018;20(2):111–121. doi:10.31887/DCNS.2018.20.2/osporns
20. Yang H, Chen X, Chen ZB, et al. Disrupted intrinsic functional brain topology in patients with major depressive disorder. Mol Psychiatry. 2021;26(12):7363–7371. doi:10.1038/s41380-021-01247-2
21. Raichle ME, MacLeod AM, Snyder AZ, Powers WJ, Gusnard DA, Shulman GL. A default mode of brain function. Proc Natl Acad Sci. 2001;98(2):676–682. doi:10.1073/pnas.98.2.676
22. Fleischer V, Radetz A, Ciolac D, et al. Graph theoretical framework of brain networks in multiple sclerosis: a review of concepts. Neuroscience. 2019;403:35–53. doi:10.1016/j.neuroscience.2017.10.033
23. Yan CG, Wang XD, Zuo XN, Zang YF. DPABI: data processing & analysis for (Resting-State) brain imaging. Neuroinformatics. 2016;14(3):339–351. doi:10.1007/s12021-016-9299-4
24. Huang X, Tong Y, Qi CX, Xu YT, Dan HD, Shen Y. Disrupted topological organization of human brain connectome in diabetic retinopathy patients. Neuropsychiatr Dis Treat. 2019;15:2487–2502. doi:10.2147/NDT.S214325
25. Wang J, Wang X, Xia M, Liao X, Evans A, He Y. GRETNA: a graph theoretical network analysis toolbox for imaging connectomics. Front Hum Neurosci. 2015;9:386. doi:10.3389/fnhum.2015.00386
26. Tzourio-Mazoyer N, Landeau B, Papathanassiou D, et al. Automated anatomical labeling of activations in SPM using a macroscopic anatomical parcellation of the MNI MRI single-subject brain. NeuroImage. 2002;15(1):273–289. doi:10.1006/nimg.2001.0978
27. Zhang J, Wang J, Wu Q, et al. Disrupted brain connectivity networks in drug-naive, first-episode major depressive disorder. Biol Psychiatry. 2011;70(4):334–342. doi:10.1016/j.biopsych.2011.05.018
28. Latora V, Marchiori M. Efficient behavior of small-world networks. Phys Rev Lett. 2001;87(19):198701. doi:10.1103/PhysRevLett.87.198701
29. Vogel AC, Power JD, Petersen SE, Schlaggar BL. Development of the brain’s functional network architecture. Neuropsychol Rev. 2010;20(4):362–375. doi:10.1007/s11065-010-9145-7
30. Churchland PS, Sejnowski TJ. Perspectives on cognitive neuroscience. Science. 1988;242(4879):741–745. doi:10.1126/science.3055294
31. Bassett DS, Bullmore ET. Small-world brain networks revisited. Neurosci Rev J Bringing Neurobiol Neurol Psychiatry. 2017;23(5):499–516. doi:10.1177/1073858416667720
32. Rubinov M, Sporns O. Complex network measures of brain connectivity: uses and interpretations. NeuroImage. 2010;52(3):1059–1069. doi:10.1016/j.neuroimage.2009.10.003
33. Wu X, Yu W, Hu H, et al. Dynamic network topological properties for classifying primary dysmenorrhoea in the pain‐free phase. Eur J Pain. 2021;25(9):1912–1924. doi:10.1002/ejp.1808
34. Lee LC, Chen YH, Lin CS, et al. Unaltered intrinsic functional brain architecture in young women with primary dysmenorrhea. Sci Rep. 2018;8(1):12971. doi:10.1038/s41598-018-30827-6
35. Liu P, Liu Y, Wang G, et al. Aberrant default mode network in patients with primary dysmenorrhea: a fMRI study. Brain Imaging Behav. 2017;11(5):1479–1485. doi:10.1007/s11682-016-9627-1
36. Zhang Y, Huang Y, Liu N, et al. Abnormal interhemispheric functional connectivity in patients with primary dysmenorrhea: a resting-state functional MRI study. Quant Imaging Med Surg. 2022;12(3):1958–1967. doi:10.21037/qims-21-731
37. Raichle ME. The brain’s default mode network. Annu Rev Neurosci. 2015;38(1):433–447. doi:10.1146/annurev-neuro-071013-014030
38. Buckner RL, DiNicola LM. The brain’s default network: updated anatomy, physiology and evolving insights. Nat Rev Neurosci. 2019;20(10):593–608. doi:10.1038/s41583-019-0212-7
39. Lee LC, Chen YY, Li WC, et al. Adaptive neuroplasticity in the default mode network contributing to absence of central sensitization in primary dysmenorrhea. Front Neurosci. 2023;17:1094988. doi:10.3389/fnins.2023.1094988
40. Jones SA, Morales AM, Holley AL, Wilson AC, Nagel BJ. Default mode network connectivity is related to pain frequency and intensity in adolescents. NeuroImage Clin. 2020;27:102326. doi:10.1016/j.nicl.2020.102326
41. Itani R, Soubra L, Karout S, Rahme D, Karout L, Khojah HMJ. Primary dysmenorrhea: pathophysiology, diagnosis, and treatment updates. Korean J Fam Med. 2022;43(2):101–108. doi:10.4082/kjfm.21.0103
 © 2024 The Author(s). This work is published and licensed by Dove Medical Press Limited. The
full terms of this license are available at https://www.dovepress.com/terms.php
and incorporate the Creative Commons Attribution
- Non Commercial (unported, 3.0) License.
By accessing the work you hereby accept the Terms. Non-commercial uses of the work are permitted
without any further permission from Dove Medical Press Limited, provided the work is properly
attributed. For permission for commercial use of this work, please see paragraphs 4.2 and 5 of our Terms.
© 2024 The Author(s). This work is published and licensed by Dove Medical Press Limited. The
full terms of this license are available at https://www.dovepress.com/terms.php
and incorporate the Creative Commons Attribution
- Non Commercial (unported, 3.0) License.
By accessing the work you hereby accept the Terms. Non-commercial uses of the work are permitted
without any further permission from Dove Medical Press Limited, provided the work is properly
attributed. For permission for commercial use of this work, please see paragraphs 4.2 and 5 of our Terms.