")
Back to Journals » Clinical Ophthalmology » Volume 18
Advanced Analysis of OCT/OCTA Images for Accurately Differentiating Between Glaucoma and Healthy Eyes Using Deep Learning Techniques
Authors Pourjavan S , Gouverneur F, Macq B, Van Drooghenbroeck T , De Potter P, Boschi A, El Maftouhi A
Received 4 April 2024
Accepted for publication 4 November 2024
Published 26 November 2024 Volume 2024:18 Pages 3493—3502
DOI https://doi.org/10.2147/OPTH.S472231
Checked for plagiarism Yes
Review by Single anonymous peer review
Peer reviewer comments 2
Editor who approved publication: Dr Scott Fraser
Sayeh Pourjavan,1 François Gouverneur,2 Benoit Macq,2 Thomas Van Drooghenbroeck,2 Patrick De Potter,1 Antonella Boschi,1 Adil El Maftouhi3
1Department of Ophthalmology, Cliniques Universitaires Saint Luc, UCL, Brussels, Belgium; 2Institute for Information and Communication Technologies, Electronics, and Applied Mathematics (ICTEAM), Louvain School of Engineering, UCLouvain, Louvain-la-Neuve, Belgium; 3Centre Ophtalmologique de RIVE, Geneve, Switzerland
Correspondence: Sayeh Pourjavan, Email [email protected]
Purpose: To evaluate the discriminative power of optical coherence tomography (OCT) and optical coherence tomography angiography (OCTA) images, identifying the best image combination for differentiating glaucoma from healthy eyes using deep learning (DL) with a convolutional neural network (CNN).
Methods: This cross-sectional study included 157 subjects contributing 1,106 eye scans. We used en-face images of the superficial and choroid layers for OCTA-based vessel density and OCT-based structural thickness of the macula (M) and optic disc (D). Images were preprocessed, resized, and normalized for CNN analysis. The CNN architecture had two components: one extracted features for each image type (OCT-D, OCT-M, OCTA-D, OCTA-M), while the second combined these features to classify eyes as healthy or glaucomatous. Performance was measured by accuracy, sensitivity, specificity, and area under the curve (AUC).
Results: For OCT images, the D+M combination outperformed disc (D) or macula (M) alone in three of the four metrics. For OCTA images, D+M also performed better than D or M alone, with D+M outperforming disc (D) in all criteria. Across all metrics for combined OCT+OCTA images, D+M performed better than D or M alone, and the macula (M) outperformed the disc (D). In disc (D) imaging, OCTA outperformed both OCT and OCT+OCTA in accuracy, sensitivity, and specificity, while OCT+OCTA had a higher AUC. OCTA consistently outperformed OCT and OCT+OCTA across all metrics for combined D+M images.
Conclusion: The OCTA D+M combination performed best, followed by the OCT+OCTA D+M combination. When both en-face images are available, OCTA is preferred. Always include both disc and macula images for optimal diagnosis.
Keywords: glaucoma, OCTA, optic disc, macula, vessel density, deep learning, AI-Glau-OCTA, health expenditure
Introduction
Glaucoma is a degenerative neuro-ophthalmic disease, characterized by progressive loss of retinal ganglion cells. It causes morphological changes in the optic nerve head and the deterioration of the visual field, which if untreated can ultimately lead to irreversible blindness. It is one of the leading causes of blindness worldwide.1 Due to its subtle symptoms, 50% of patients do not know that they are affected by the disease.2,3 Intraocular pressure (IOP), next to advancing age, is the most important and the only treatable risk factor.4
Individual anatomical differences in optic nerve head appearances, complicate the diagnosis of glaucoma, resulting in discrepancies in diagnosis between and within observers. Accurate and prompt diagnosis of glaucoma is challenging since the condition frequently exhibits equivocal symptoms in its early stages.5,6
It has been shown that early treatment can significantly reduce the progression of the disease,7 allowing patients to maintain quality of life and social activities.8,9 Early intervention also positively impacts economic health expenditure and decreases the cost of blindness.10 Therefore, early diagnosis is a “golden tool”.
The diagnosis of glaucoma is based on examination of the optic disc, visual field, and IOP. Multiple factors, IOP & non-IOP related, can cause structure and functional changes in, contrast sensitivity, visual field, and visual acuity.11 Therefore, tools that enable early diagnosis are essential in glaucoma treatment to prevent irreversible vision loss.
Fundus pictures, optical coherence tomography (OCT), and optical coherence tomography angiography (OCTA) are the three main imaging modalities commonly utilized to identify glaucoma with each of their characteristics. Although fundus photography provides a thorough understanding of retinal and optic nerve disorders, it is limited by its two-dimensionality, lack of depth perception, and low-resolution image quality. Additionally, the interpretation of the pictures is qualitative and subjective.12
OCT allows us to measure quantitatively the retina nerve fibre layer (RNFL) thickness on peripapillary and macular zones and to detect early loss of RNFL before the symptomatic visual field’s loss.13
OCTA is a relatively new diagnostic tool that reflects the vascular density of the optic disc and macula, both of which are important in developing glaucoma. It also shows complete choriocapillaris loss in areas of localized peripapillary atrophy, the so-called deep microvascular dropout.14
While OCT provides high-resolution cross-sectional images for structural analysis, fundus imaging provides a complete view of the ocular’s constituent parts. On the other hand, OCTA detects abnormal perfusion by displaying the vasculature in every layer of the optic disc and retina and the macula (Figure 1).
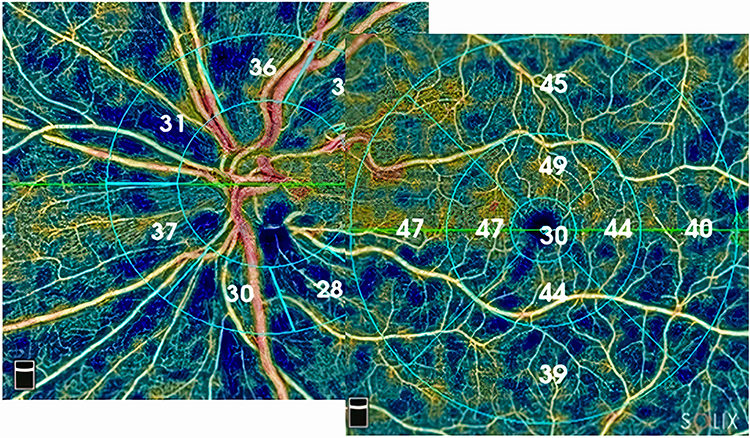 |
Figure 1 OCTA imaging of the en-face superficial layer of a patient with glaucoma. Decreased vessel density on macular vulnerable zone stretching as an arciform defect inferiorly. |
Several investigations have employed Deep Learning (DL), especially Convolutional Neural Networks (CNN), for analyses of OCT and OCTA readings to identify ocular illnesses such as retinal vein occlusion or diabetic retinopathy. However, although DL has already been used on OCT images to detect glaucoma, this is much rarer in the case of OCTA images.15,16
CNNs can automatically extract key image features that are pertinent to the diagnosis of glaucoma. CNNs are well-known for their efficacy as image classifiers. Their potential as effective glaucoma detectors are further enhanced by the use of non-clinical variables related to vascular pathways in glaucoma during CNN training.17
We aimed to develop and evaluate a CNN architecture for both OCT and OCTA, compare their diagnostic accuracy and secondly assess the value of CNN-derived combined OCT+OCTA images in diagnosing glaucoma.
Participant
The Institutional Ethical Commission of the Cliniques Universitaires Saint-Luc in Brussels approved the study protocol. This research adheres to the principles outlined in the Declaration of Helsinki for studies involving human subjects. It complies with all relevant national ethical guidelines, including the General Data Protection Regulation (GDPR) for data privacy and confidentiality within Europe. While HIPAA is specific to the United States, the GDPR ensures similar standards in the European context. Written informed consent was obtained from each participant before inclusion in the study.
All the participants were recruited from our clinic. An experienced glaucoma specialist (SP) determined the ground truth for glaucoma diagnosis.
Healthy subjects (non-glaucoma) had booked an appointment for an annual check-up or control of refractive error. They had a normal appearance of the optic disc on direct funduscopy with an intact neuroretinal rim and normal retina nerve fibre layer (RNFL) on OCT and an IOP ≤ 21 mmHg in both eyes. We did not perform standard visual field testing if it was not needed, for each healthy subject because of its inability to detect early glaucomatous damage, especially in the macula.18
All healthy subjects had a comprehensive ophthalmological examination, including auto-refractometry, BCVA, and tonometry. After obtaining their consent, we did an OCT/ OCTA examination in conjunction with our “standard of care”. Thirteen residents of the Ophthalmology Department, five students, three secretaries, and one consultant took voluntary part in this study as well.
Glaucomatous participants were selected from our database of Glaucoma-OCTA study group, and from referred glaucomatous patients to one of the glaucoma consultants for surgery. They had an abnormal optic disc with thinning of the RNFL and the neuroretinal rim with or without visual field loss. The IOP levels were not considered as an inclusion criterion because most patients were already medically treated.
We did not exclude any participants with high refractive error if the quality of the images was acceptable.
Methods
OCTA and Acquisition of the Images
The AngioVue imaging system, Solix Optovue, Inc. in Fremont, CA, USA (Solix V1.1.100.20 FullRang AngioVue Expert 8/2020), was utilized to conduct OCTA and Spectral-domain OCT imaging of the nerve head (ONH) and macula. This system allows for the acquisition of OCTA and Spectral-domain OCT images from the same scans, ensuring precise alignment and automatic segmentation of the regions of interest being analyzed. AngioAnalytics™ OCT-A Metrics enables a non-invasive, dye-free OCT-based approach for visualization and quantification of retinal vasculature. It allows the 6.4 mm AngioVue® Retina scans to assess retinal vascular density, FAZ, flow area, non-flow area, and retinal layer thickness.
Additionally, it permits optic disc measurements for 6 mm AngioVue® disc scans as well as the determination of radial peripapillary capillary (RPC) density and RNFL thickness.
DualTrac™ Motion Correction Technology (MCT) with enhanced visualization combines real-time tracking and patented post-processing to enable true 3D motion correction. It uses the split-spectrum amplitude-decorrelation angiography (SSADA) algorithm to visualize the perfused retinal vasculature in high resolution in three dimensions at various user-defined layers of the retina, including the capillary level. This algorithm captures the dynamic motion of red blood cells from sequential cross-sectional B-scans. The percentage of the measured area filled by flowing blood vessels—defined as pixels with decorrelation values surpassing a predetermined threshold level—is automatically calculated by the AngioVue program. As such, the vessel density and thickness values that this software provides are from scans that have undergone accurate automatic registration.
The vessel density (VD) measurements are determined only with projection artefact removal (PAR) correction. PAR removes the shadow effect of the higher vascular beds in the visualization of deeper layers.
Comprehensive analysis combining structural and vascular pictures and data, including ONH, ganglion cell complex (GCC), focal loss of volume (FLV), global loss of volume (GLV), Bruch’s membrane opening (BMO), and vessel density (VD) registration with Garway-Heath nerve fibre sectors, is provided by the Optovue Solix glaucoma package.
OCTA macula imaging 6.4×6.4 mm2 was obtained, centred on the fovea, to ensure the examination of the eventual enlarged foveal avascular zone (FAZ) that can increase in diameter in glaucoma patients.19
The predefined en-face slabs used initially for this study were the superficial retinal capillary plexuses (en-face S) in a slab from the internal limiting membrane to the inner plexiform layer −10 μm and choroid slab (en-face C) extending from upper limit = BRM-10µm to lower limit = BRM+30µm. The whole image of 6.4×6.4 mm2 of the macula was divided into 9 equal sectors grid and the vascular density was calculated by the machine (Figure 2).
 |
Figure 2 Vessel density measurements in nine equally divided quadrants of the en-face superficial layer. |
The disc images were obtained from the optic disc cube area of 6×6 mm2. The peripapillary region is defined by two rings of 2.5mm and 4.5mm centred on the disc centre and as determined by BMO fitted circle (Figure 3), divided into the middle, superior, and inferior hemi-sectors and 8 equal peripapillary sectors.
 |
Figure 3 Defining the peripapillary region by two rings of 2.5mm and 4.5mm centred on the disc centre and as determined by Bruch’s membrane opening (BMO) fitted circle. |
The radial peripapillary capillary (RPC) network was visualized with excellent detail as a distinctive pattern of parallel, long, uniform-diameter vessels around ONH, oriented parallel to the retinal nerve fibre layer.
The whole image of 6×6 mm2 of disc scan was also divided into 9 equal sectors grid and the vascular density was calculated (Figure 4).
 |
Figure 4 Vessel density calculation in nine equal sectors grid on the en-face layer centred on the optic disc. |
Based on the evidence of the publications of two groups, namely Lee et al20 and Schottenhaml et al21 we decided to use only the data of the en-face superficial layer for our CNN models.
In their work, Lee et al used OCTA and macula-centred OCT pictures from individuals with high myopia to compare CNN models. The evaluation of ImageNet over various layers with OCTA superficial layers had an AUC of 0.946, which was similar to OCT GCL+ IPL (ganglion cell layer + inner plexiform layer) at 0.982. With an AUC of 0.779, both models performed much better than OCTA deep-layer images. This implies that a more successful diagnostic approach than using images from the deep layer is to use a CNN based on OCTA images from the superficial layer. The work by Schottenhamml et al, which contrasted a CNN based on 3×3 mm2 images from various levels, comes to a similar conclusion.
All the scans with a quality score (SQ) lower than 6 and/or signal strength index (SSI) values lower than 48 were discarded as VD measurements are positively correlated with SSI.22 All the en-face pictures were examined by the glaucoma specialist (SP) and the images with any other abnormality of the macula (drusen, membrane, etc) were rejected as well.
Convolutional Neural Networks (CNN) with Deep Learning
Image Pre-Processing
The OCTA images of en-face S of the macula and optic disc of glaucomatous patients and healthy subjects and the OCT images of the same anatomical locations were used for the dataset. The gathered images had a resolution of 512×512 pixels in black and white color which were scaled to 128×128 pixels and normalized from 0 − 255 to 0 − 1 for computational performance. Additionally, the dataset was divided into 48 eyes for testing and 190 eyes for training using a 5-fold stratified classification. The testing set included only images that had not been used for training purposes by the model. Twenty completely independent different runs were performed. Each time the performance metrics (accuracy, AUC, sensitivity, and specificity) of the testing were registered.
AI-GlauOCTA Architecture
The CNN architecture consists of two main parts.23 The first part is tailored to each image type and location (OCT-D, OCT-M, OCTA-D, OCTA-M), involving convolutional, pooling, and flattening layers. The second part involves concatenating these flattened vectors and passing them through four fully connected layers, resulting in a binary output that distinguishes between healthy and glaucomatous eyes. This approach allows for an effective classification process (Figure 5).
 |
Figure 5 AI-Glau-OCTA’s intermediate fusion CNN architecture for glaucoma detection with four image types as input. |
IOP Measurements
Eye pressure was measured by calibrated Goldmann tonometry after OCT/OCTA measurements to prevent image distortion.
Visual Field Testing
For the visual field test, we used Humphrey Field Analyzer, Carl Zeiss; 24–2C Sitafaster grid that incorporates 10 additional test points within the central 10° from fixation, 5 in each hemifield, to be able to identify the initial glaucoma damage in the central visual field which previously was less remarkable with Sita standard 24–2 algorithm.24
Results
The baseline demographic characteristics are shown in Table 1. Patients with Glaucoma had significantly worse VFI, MD, lower RNFL and older age. The average mean deviation of the glaucoma patients was nearly −8 dB which according to the VF loss classification scoring system, proposed in the 5th Guidelines of the European Glaucoma Society refers to a moderate loss of function.
 |
Table 1 Patient Characteristics |
The range of values for the attained accuracy was from 82.35% to 92.44%, the AUC values were from 91.40% to 96.94%, the sensitivity was from 83.74% to 94.71%, and the specificity was from 77.7% to 89.34%.
Table 2 presents the comprehensive outcomes, which include the 95% confidence intervals derived from bootstrap resampling.
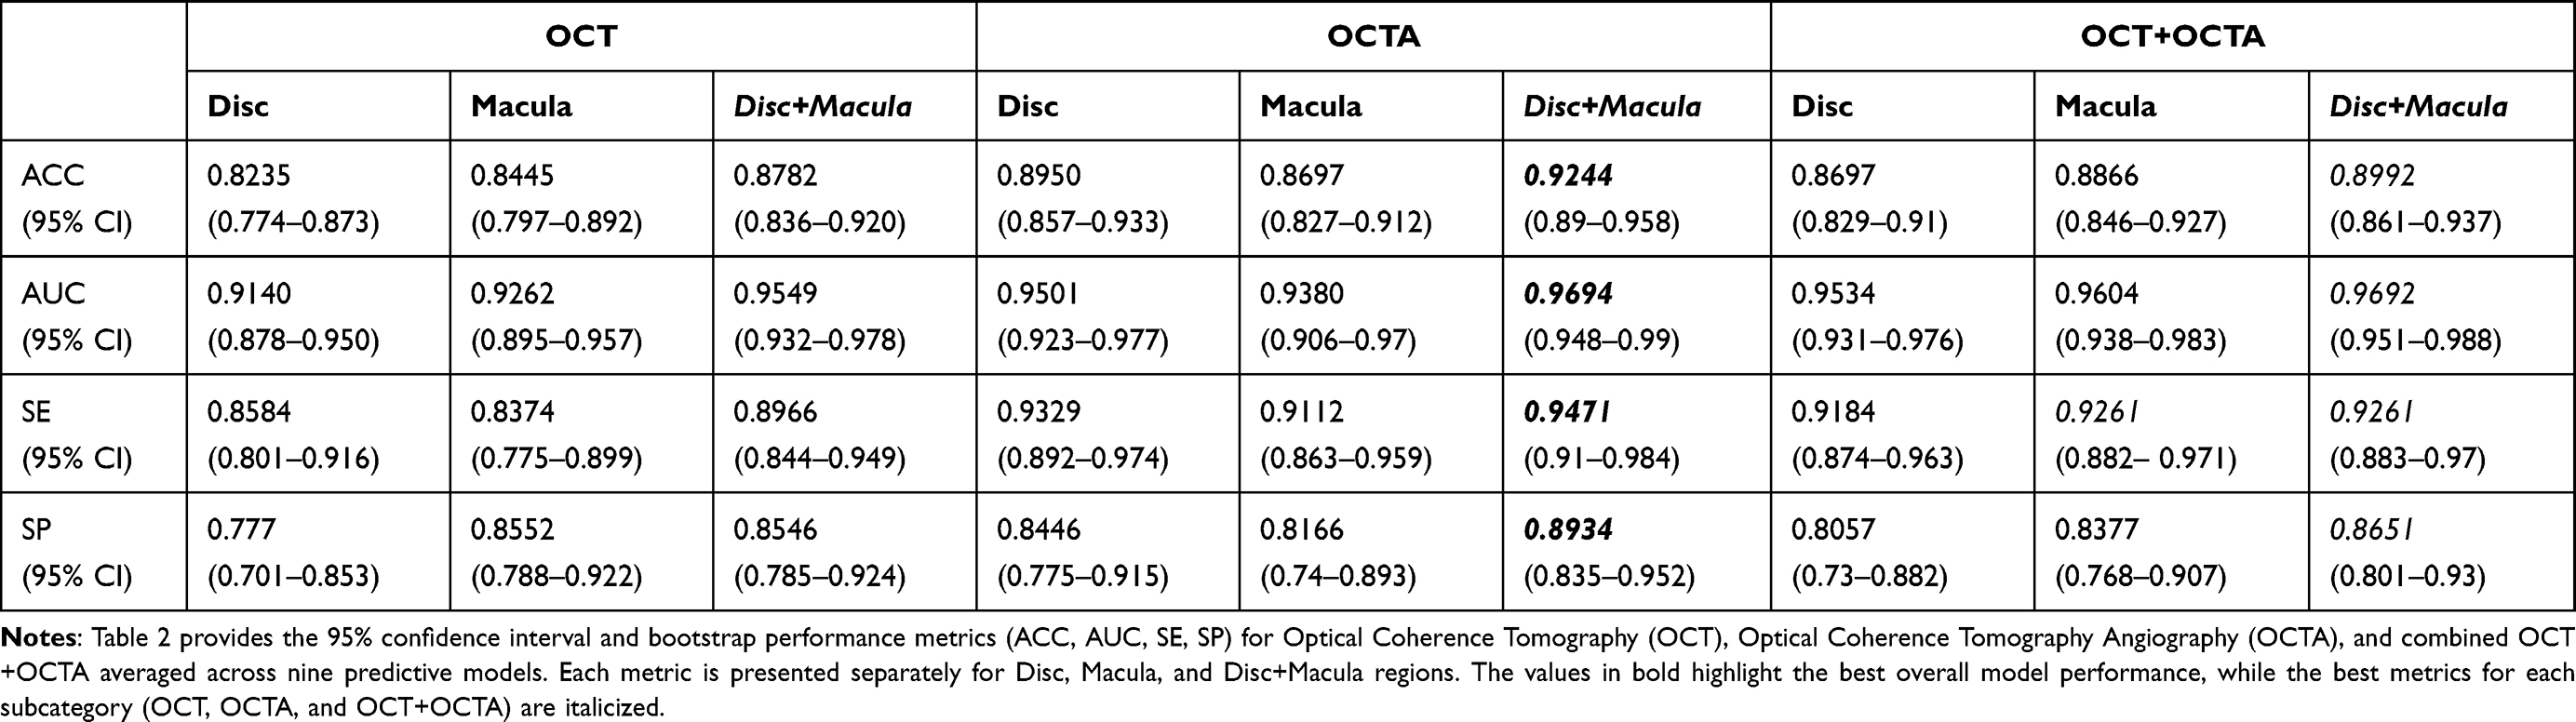 |
Table 2 The 95% Confidence Interval and Bootstrap Metrics Averaged Across Nine Models |
Discussion
We reviewed peer-reviewed articles from 2018 to 2023, analyzing the use of OCT and OCTA in glaucoma diagnosis. Previous studies, like the comprehensive review by Van Melkebeke et al25 in 2018, highlighted that OCTA demonstrates strong reliability in both normal and glaucomatous eyes. Glaucoma eyes typically show lower OCTA parameters compared to healthy eyes, suggesting its potential for diagnostic use. The discriminatory power of OCTA is similar to OCT, and combining the two enhances diagnostic accuracy, especially in early glaucoma. OCTA parameters, particularly in the peripapillary area, show promise for detecting early glaucoma and demonstrate less susceptibility to floor effects compared to OCT, making them valuable for monitoring disease progression.
While OCT excels in structural assessment, various studies emphasize the superiority of OCT for glaucoma diagnosis,26 particularly when using parameters like circumpapillary vessel density (cpVD) and comparing it with RNFL thickness. However, limitations exist for OCTA, such as the smaller 3 mm scan area, which might miss lesions in the 3 to 6 mm range.
In our study, we addressed the integration of OCTA with deep learning for glaucoma diagnosis, noting that OCTA alone outperforms combined OCT+OCTA in sensitivity when assessing the macula and disc areas (OCTA M+D). This finding suggests that vascular information provided by OCTA plays a crucial role in early glaucoma detection, particularly in cases where OCT’s structural data is less indicative of early-stage disease.
We observed that the integration of Optical Coherence Tomography Angiography (OCTA) as a diagnostic tool in glaucoma continues to face challenges due to its ongoing reliance on structural OCT data and in most of the studies the diagnosis of glaucoma is based solely on OCT results.
Additionally, the absence of comprehensive reports combining structural and functional data hinders the appreciation of OCTA’s insights. To date, Solix Optovue stands out as one of the few OCT products offering such combined reports.
We did not base our diagnosis only on OCT results but on the whole clinical knowledge of each patient. We neither exclude any patients with higher refractive errors if the QS and SSI were acceptable We wanted to mimic the “real life” measurements.
We acknowledge the difference in average ages between normal and glaucoma patients as a potential limitation. While age is a risk factor for glaucoma, our primary focus was on the diagnostic capability of OCT and OCTA. Future studies may benefit from age-matching the control and glaucoma groups to minimize this bias. In “real life” most of the glaucoma patients are elderly. However, the significant structural and vascular differences detected by OCT and OCTA in our study support the conclusion that these methods are effective for glaucoma diagnosis, even with age as a variable.
It’s essential to view OCTA as part of the broader OCT analysis, providing supplementary biomarkers to enhance diagnostic precision.
Deep learning analyses indicate that OCTA M+D exhibits heightened sensitivity compared to OCT alone, particularly promising for detecting anatomical and vascular abnormalities in pre-perimetric glaucoma.
The combined assessment of OCTA M+D demonstrates superior sensitivity in identifying early glaucomatous pathology, aligning with established structural damage patterns in glaucoma.
It emphasizes surprisingly that when we combine the values of OCT with OCTA, it may even reduce the sensitivity in distinguishing healthy individuals from those with glaucoma.
When OCT and OCTA are combined, the sensitivity for distinguishing between healthy and glaucoma patients may decrease.
This study marks an initial validation of deep learning techniques for distinguishing between healthy and glaucomatous states, paving the way for more sophisticated investigations into disease detection at earlier, sub-clinical stages.
Our hypothesis regarding the difference between findings in studies that do not employ deep learning (DL) and our results lies in the understanding that OCTA provides a limited and static perspective of “flow”. Deep Learning enables the analysis of additional factors beyond what a single value can capture.
Conclusion
AI-GlauOCTA’s intermediate fusion architecture greatly enhances the comparison of various image types crucial for glaucoma detection such as OCT-D, OCT-M, OCTA-D, and OCTA-M images. In conclusion, this study demonstrates that OCTA alone showed superior sensitivity in detecting glaucomatous changes in disc and macula areas compared to combined OCT+OCTA. The integration of both disc and macula regions is pivotal for accurate glaucoma detection. While OCT+OCTA showed higher accuracy in certain metrics, our results emphasize the value of vascular information captured by OCTA for early glaucoma detection. This finding aligns with the study’s objective to evaluate the diagnostic power of OCT, OCTA, and their combination. The use of deep learning models further enhances diagnostic performance, highlighting the potential for integrating these imaging modalities into clinical practice for more effective glaucoma diagnosis to assist non-glaucoma sub-specialist ophthalmologists as part of their clinical decision support system for patient management.
Funding
A grant has been awarded from Fondation Saint Luc, Cliniques Universitaire Saint Luc, UCL Brusseels for the doctorate thesis of the first author of which this article is one of the publications. Glaucoma Centre Zaventem outpatient financially supported the publication of this article.
Disclosure
No conflicting relationship exists for any author.
References
1. GBD 2019 Blindness and Vision Impairment Collaborators; Vision Loss Expert Group of the Global Burden of Disease Study. Causes of blindness and vision impairment in 2020 and trends over 30 years and prevalence of avoidable blindness in relation to VISION 2020: the right to sight: an analysis for the global burden of disease study. Lancet Glob Health. 2021;9(2). doi:10.1016/S2214-109X(20)30489-7
2. Johansson LH, Kalaboukhova L, Erhag HF, Skoog I, Zetterberg M. The prevalence of glaucoma in a 70-year-old Swedish population in the city area of Gothenburg. Acta Ophthalmol. 2024;102(2):208–215. doi:10.1111/aos.15734
3. Tham Y-C, Li X, Wong TY, Quigley H, Aung T, Cheng C-Y. Global prevalence of glaucoma and projections of glaucoma burden through 2040: a systematic review and meta-analysis. Ophthalmology. 2014;121(6):2081–2090. doi:10.1016/j.ophtha.2014.05.013
4. Prum BE, Rosenberg LF, Gedde SJ, et al. Primary open-angle glaucoma preferred practice pattern® guidelines. Ophthalmology. 2016;123(1). doi:10.1016/j.ophtha.2015.10.053
5. Breusegem C, Fieuws S, Stalmans I, Zeyen T. Agreement and accuracy of non-expert ophthalmologists in assessing glaucomatous changes in serial stereo optic disc photographs. Ophthalmology. 2010;118(3):742–746. doi:10.1016/j.ophtha.2010.08.019
6. Jampel H, Friedman D, Quigley H, et al. Agreement among glaucoma specialists in assessing progressive disc changes from photographs in open-angle glaucoma patients. Am J Ophthalmol. 2008;147(1):39–44.e1. doi:10.1016/j.ajo.2008.07.023
7. Heijl A, Leske MC, Bengtsson B, et al. Reduction of intraocular pressure and glaucoma progression: results from the Early Manifest Glaucoma Trial. Arch Ophthalmol. 2002;120(10):1268–1279. doi:10.1001/archopht.120.10.1268
8. Latif K, Nishida T, Moghimi S, Weinreb RN. Quality of life in glaucoma. Graefes Arch Clin Exp Ophthalmol. 2023;261(10):3023–3030. doi:10.1007/s00417-023-06050-z
9. Nayyar S, Kumar S, Rehman O, Ichhpujani P, Singla E. Impact of moderate and severe primary open-angle glaucoma on quality of life due to activity limitation. Indian J Ophthalmol. 2022;70(2):552–557. doi:10.4103/ijo.IJO_1687_21
10. Pezzullo L, Streatfeild J, Simkiss P, Shickle D. The economic impact of sight loss and blindness in the UK adult population. BMC Health Serv Res. 2018;18(1):63. doi:10.1186/s12913-018-2856-0
11. Gardiner SK, Mansberger SL, Fortune B. Time lag between functional change and loss of retinal nerve fiber layer in glaucoma. Invest Ophthalmol Vis Sci. 2020;61(12):3314. doi:10.1167/iovs.61.13.5
12. Lim AB, Park J-H, Jung JH, Yoo CK, Kim YY. Characteristics of diffuse retinal nerve fiber layer defects in red-free photographs as observed in optical coherence tomography en face images. BMC Ophthalmol. 2020;20(1):1–7. doi:10.1186/s12886-020-01640-7
13. Zeppieri M, Marsili S, Enaholo ES, et al. Optical coherence tomography (OCT): a brief look at the uses and technological evolution in ophthalmology. Medicina. 2023;59(12):2114. doi:10.3390/medicina59122114
14. Spaide RF, Fujimoto JG, Waheed NK, Sadda SR, Staurenghi G. Optical coherence tomography angiography. Prog Retin Eye Res. 2018;64:1–55. doi:10.1016/j.preteyeres.2017.11.003
15. Zhang H, Qie Y. Applying deep learning to medical imaging: a review. Appl Sci. 2023;13(18):10521. doi:10.3390/app131810521
16. Chan H-P, Samala RK, Hadjiiski LM, Zhou C. Deep learning in medical image analysis: challenges and applications. Deep Learn Med Image Anal. 2020;3–21. doi:10.1016/B978-0-12-816554-3.00001-4
17. Ahmed S, Mahadevappa V. Advancing glaucoma detection with convolutional neural networks: a paradigm shift in ophthalmology. Rom J Ophthalmol. 2023;67(3):222. doi:10.22336/rjo.2023.222
18. Hood DC. Imaging glaucoma. Annu Rev Vis Sci. 2015;1:51–72. doi:10.1146/annurev-vision-082114-035347
19. Kwon J, Choi J, Shin JW, Lee J, Kook MS. Glaucoma diagnostic capabilities of Foveal avascular zone parameters using optical coherence tomography angiography according to visual field defect location. J Glaucoma. 2017;26(12):1120–1129. doi:10.1097/IJG.0000000000000800
20. Lee YJ, Sun SY, Kim SH, Jeoung JW, Park KH. Diagnostic ability of macular microvasculature with swept-source OCT angiography for highly myopic glaucoma using deep learning. Sci Rep. 2023;13(1):5209. doi:10.1038/s41598-023-32117-2
21. Schottenhamml J, Würfl T, Mardin SM, et al. Glaucoma classification in 3 x 3 mm en face macular scans using deep learning in different plexus. Biomed Opt Express. 2021;12(12):7434–7444. doi:10.1364/BOE.433054
22. Pradhan ZS, Sreenivasaiah S, Srinivasan T, et al. The importance of signal strength index in optical coherence tomography angiography: a study of eyes with pseudoexfoliation syndrome. Clin Ophthalmol. 2022;16:3481–3489. doi:10.2147/OPTH.S378722
23. Gouverneur F, Pourjavan S, Macq B.
24. Phu J, Kalloniatis M. Ability of 24-2C and 24-2 grids to identify central visual field defects and structure-function concordance in glaucoma and suspects. Am J Ophthalmol. 2020;219:317–331. doi:10.1016/j.ajo.2020.07.014
25. Van Melkebeke L, Barbosa-Breda J, Huygens M, Stalmans I. Optical coherence tomography angiography in glaucoma: a review. Ophthalmic Res. 2018;60(3):139–151. doi:10.1159/000488495
26. Khallouli A, Oueslati Y, Gouider D, et al. Diagnostic accuracy and relationship between optical coherence tomography angiography vessel density and structural/functional parameters in healthy, preperimetric, and manifest glaucoma eyes. J Curr Ophthalmol. 2022;34(2):173–179. doi:10.1016/j.joco.2021.12.006
 © 2024 The Author(s). This work is published and licensed by Dove Medical Press Limited. The
full terms of this license are available at https://www.dovepress.com/terms.php
and incorporate the Creative Commons Attribution
- Non Commercial (unported, 3.0) License.
By accessing the work you hereby accept the Terms. Non-commercial uses of the work are permitted
without any further permission from Dove Medical Press Limited, provided the work is properly
attributed. For permission for commercial use of this work, please see paragraphs 4.2 and 5 of our Terms.
© 2024 The Author(s). This work is published and licensed by Dove Medical Press Limited. The
full terms of this license are available at https://www.dovepress.com/terms.php
and incorporate the Creative Commons Attribution
- Non Commercial (unported, 3.0) License.
By accessing the work you hereby accept the Terms. Non-commercial uses of the work are permitted
without any further permission from Dove Medical Press Limited, provided the work is properly
attributed. For permission for commercial use of this work, please see paragraphs 4.2 and 5 of our Terms.