")
Back to Journals » Journal of Asthma and Allergy » Volume 18
Age, Sex, and Symptom-Dependent Variations in Total IgE and Eosinophils in Atopic Patients: A Five-Year Retrospective Study
Authors Zhao L, Wu Y , Zhu H, Lin Y, Su H, Hu J, Zhang M , Bao W
Received 26 January 2025
Accepted for publication 26 May 2025
Published 3 June 2025 Volume 2025:18 Pages 915—926
DOI https://doi.org/10.2147/JAA.S519591
Checked for plagiarism Yes
Review by Single anonymous peer review
Peer reviewer comments 2
Editor who approved publication: Dr Luis Garcia-Marcos
Lei Zhao,* Yiting Wu,* Hui Zhu,* Yanmei Lin, Hang Su, Jingwei Hu, Min Zhang, Wuping Bao
Department of Respiratory and Critical Care Medicine, Shanghai General Hospital, Shanghai Jiao Tong University School of Medicine, Shanghai, People’s Republic of China
*These authors contributed equally to this work
Correspondence: Wuping Bao, Department of Respiratory and Critical Care Medicine, Shanghai General Hospital, Shanghai Jiao Tong University School of Medicine, NO. 100 haining Road, Hongkou District, Shanghai, 200080, People’s Republic of China, Tel +0086 21 63240090 3091, Email [email protected] Min Zhang, Department of Respiratory and Critical Care Medicine, Shanghai General Hospital, Shanghai Jiao Tong University School of Medicine, NO. 100 haining Road, Hongkou District, Shanghai, 200080, People’s Republic of China, Email [email protected]
Background: Total immunoglobulin E (t-IgE) and eosinophils as central effector molecular and cells are crucial biomarkers for allergic diseases. Age, sex and allergic symptoms may influence these biomarkers and the relationship among t-IgE, eosinophils, and atopic diseases remained unknown.
Methods: A five-year retrospective study enrolled 7654 patients with allergic symptoms underwent allergen testing. We collected age, sex, symptoms, and complete blood counts and explored variations in t-IgE and eosinophil across demographic and clinical parameters.
Results: Among atopic patients, t-IgE levels peaked in children, decreasing with age, with a slight increase in the elderly, mirroring eosinophil trends. Females consistently exhibited lower t-IgE and eosinophil levels than males, regardless of atopic status. High t-IgE and eosinophils were the most common in patients ≥ 12 years with respiratory symptoms. Dust mites often caused respiratory symptoms. Egg allergies typically affected the ear, nose, and throat (ENT). Seafood/peanut allergies were linked to skin symptoms. Interestingly, elevated t-IgE and eosinophil levels did not consistently correlate with positive allergen tests. Among atopic patients, 44.5% exhibited normal t-IgE, and 41.4% had normal eosinophils. In the subgroup (22.8%) with both markers normal, more were females (62.5%). Sensitization to allergens like soy, shrimp, mold combination, Artemisia argyi, common ragweed, and willow/aspen/elm may fail to elevate t-IgE and eosinophils.
Conclusion: Characteristics such as older age, female, skin and ENT symptoms, and allergens may correlate with lower t-IgE and eosinophils in the allergic populations which means we should pay more attention to these population, even if their t-IgE and eosinophils are normal, the allergen test is necessary for treatment strategies.
Clinical Trial Registration: ChiCTR2300067700 (Date of Registration: 2023– 01-18).
Keywords: atopy, IgE, eosinophil, age, sex
Background
The increasing prevalence of allergic diseases, characterized by heightened immune system sensitivity to harmless environmental substances, presents a significant public health challenge. In industrialized nations, these conditions affect over 25% of the population, with their incidence continues to rise in developing regions.1–3 The underlying physiology often involves a type 2 immune response, orchestrated by Th2 cells, eosinophils, mast cells, group 2 innate lymphoid cell (ILC2), and M2 macrophages, resulting in clinical symptoms that significantly impact the well-being of affected individuals.
In clinical practice, total immunoglobulin E (t-IgE) and eosinophil counts serve as vital biomarkers for diagnosing and managing allergic conditions. They are preferred due to their convenience, cost-effectiveness, and practicality. Furthermore, correlations exist between t-IgE levels and other markers of allergic inflammation, such as exhaled nitric oxide and airway hyperresponsiveness (AHR),4 which are crucial in asthma pathophysiology. Eosinophils, as central effector cells in allergic inflammation, also hold evaluating and therapeutic value in allergic diseases.5–7 Elevated t-IgE, increased eosinophils and elevated nitric oxide levels, often indicate poorly controlled asthma as independent risk factors,8 emphasizing the importance of t-IgE and eosinophils in clinical assessment and treatment decisions.9 Nevertheless, it is crucial to acknowledge that t-IgE and eosinophil counts are influenced by various factors, including age, sex, BMI, and smoking history. Therefore, relying solely on a single test result can sometimes lead to inaccurate assessments of the atopic status, contributing to both misdiagnosis and misevaluation.10,11
Despite their utility, interpretating these biomarkers requires an understanding of the complexities of immune responses and the modifying effects of demographic factors such as age, sex, and symptoms. Our previous research has revealed variability in t-IgE and eosinophil counts,12,13 suggesting that these variations may be attributed to a range of elements, including allergic symptoms, allergens, and the presence of concurrent allergic conditions. However, within the realm of allergic diseases, limited research exists on the influence of factors like age and sex on t-IgE and eosinophils levels. The predictive value of both biomarkers for allergic diseases remains insufficiently recognized. Given these complexities, the primary objective of this study is to elucidate the correlations between t-IgE and eosinophil levels with allergen type and severity in patients displaying allergic symptoms. Additionally, we aimed to explore age and sex-related variability in these biomarkers, establish connections between clinical symptoms and biomarker levels, uncover any seasonal patterns, identify allergens causing atopy without significantly elevating t-IgE and characterize atopic patients with normal t-IgE levels, thereby highlighting potential diagnostic challenges. These insights are paramount for improving diagnostic accuracy and advancing the management of allergic diseases.
Methods
Study Design
We conducted a retrospective, single-center study of patients with allergic symptoms, such as cough, wheezing, nasal congestion, runny nose, itchy eyes, itchy skin, and wheals, who underwent serum allergen specific-IgE (s-IgE) testing between January 2013 and December 2017. A total of 7,654 patients were enrolled, with 5,066 having sIgE and peripheral eosinophil counts measured, and 1,863 undergoing sIgE and t-IgE testing. Among them, 1,371 patients had concurrent testing for s-IgE, t-IgE and eosinophil counts. Baseline data, including age, sex, onset date, s-IgE, t-IgE, and complete blood count results, were collected.
Patients were categorized into five age groups (1–17, 18–36, 37–52, 53–69, and 70–100 years) based on our previous study.12
The study protocol was approved by the ethics committee, with a waiver of informed consent (number: 2017KY159). Detailed information about allergen testing and biomarker evaluation was provided in our previous study.12
S-IgE, t-IgE and Complete Blood Count Evaluation
s-IgE levels against 17 allergen extracts and cross-reactive carbohydrate determinants (CCD) were assessed using the EUROLINE Atopy (China7) (IgE) Assay Kit, a semi-quantitative immunoblot method. These 17 allergens were categorized into two groups: 10 aeroallergens (willow/aspen/elm, common ragweed, Artemisia argyi, dust mites, house dust, cat, dog, Blattella germanica, Penicillium notatum/branch spore wood/Aspergillus fumigatus/Alternaria, and Humulus) and seven food allergens (egg albumen, milk, peanuts, soy, cod/lobster/scallops, shrimp, and crab).
The severity of atopy was quantified into seven grades based on s-IgE concentrations, corresponding to sensitive index (SI) values of 0–6 for ranges of 0–0.35, 0.35–0.69, 0.70–3.49, 3.5–17.49, 17.5–49.99, 50–99.99, and ≥100 kU/L. A test was considered positive if s-IgE levels were ≥0.35 kU/L. Atopy was defined as the presence of at least one positive s-IgE result. To minimize bias, individuals with positive anti-CCD s-IgE were excluded from the analysis.
Total IgE (t-IgE) was measured using the UniCAP 1000 system and classified as elevated for values exceeding 60 IU/mL.
Peripheral eosinophil counts were determined using an automated complete blood count with differential, reported as both absolute counts and percentages. An absolute eosinophil count >0.15 × 10⁹ cells/L was considered elevated.
Statistical Analysis and Data Visualization
Descriptive statistics were used to summarize demographic and clinical characteristics. The Shapiro–Wilk test assessed the normality of continuous variables. Data were presented as mean ± standard error of the mean (SEM) for normally distributed variables and as median with interquartile range (IQR) for non-normally distributed variables.
For multiple group comparisons, Dunn’s test was applied following nonparametric ANOVA. The Chi-square test evaluated associations between categorical variables (eg, sex and atopic symptoms), while Spearman correlation coefficient and rank correlation tests assessed monotonic relationships and rank order between continuous variables.
Quadrant scatter plots and heatmaps visualized biomarker relationships and allergen-specific sensitizations. The Boruta algorithm identified the relative importance of allergens in influencing t-IgE levels and eosinophil counts.
A p-value < 0.05 was considered statistically significant. Statistical analyses were performed using SPSS (Version 27), OriginPro 2022, Python (Version 3.11), and GraphPad Prism (Version 9.0).
Results
Variability in t-IgE and Eosinophil Counts by Age and Sex
In our study, 7654 patients performed the allergen test to identify the level of s-IgE, in which, 5066 patients underwent eosinophil count testing, while 1863 patients underwent t-IgE testing. Significant variations in t-IgE and eosinophil levels were observed across different age groups and between sexes.
Children and adolescents (1–17 years) displayed the highest t-IgE (458.50 ± 95.47 IU/mL), progressively decreasing with age. Mean t-IgE for adults (18–36 years), middle-aged adults (37–52 years), older adults (53–69 years), and the elderly (70–100 years) were 267.20 ± 22.59, 205.80 ± 26.91, 207.40 ± 21.31, and 227.60 ± 45.61 IU/mL, respectively (Figure 1a). This highlights a significant age-related decline in t-IgE, with a slight increase noted in the oldest age group. Conversely, eosinophil distribution, influenced by atopic conditions, showed a distinct pattern, with notable increases observed in teenagers and the elderly, particularly in the 70–100 years age group (Figure 1b and c). The 37–52 age group exhibited lower percentages and absolute values of eosinophils compared to other age groups.
 |
Figure 1 Variety about the value of t-IgE (a) and eosinophil (b and c) in atopic patients by the five age categories. Comparative analysis of t-IgE levels (d) and eosinophil counts (e and f) based on sex, between patients who tested positive for allergens and those who tested negative. Data was expressed as Mean ± SEM. EOS, eosinophil. *< 0.05, **< 0.01, ***< 0.001. |
Sex-based analysis revealed significantly higher t-IgE in males (282.20 ± 23.44 IU/mL for atopic and 143.40 ± 23.77 IU/mL for non-atopic patients) compared to females (194.20 ± 19.53 IU/mL for atopic and 73.82 ± 8.09 IU/mL for non-atopic patients), regardless of allergen test results (Supplementary Table 1, Figure 1d–f). Eosinophil counts were also elevated in males, suggesting a potential sex-related influence on these biomarkers.
Differential Responses in t-IgE and Eosinophils to Different Allergens
Our analysis of specific allergen responses revealed significant variability in t-IgE and eosinophil counts (Supplementary Table 2). Patients allergic to cat and Humulus exhibit the highest t-IgE, while those sensitized to Artemisia argyi and peanuts have the lowest t-IgE. Absolute eosinophil values of patients allergic to cat and dog are the highest. Conversely, patients sensitized to mold and soybeans have the lowest eosinophil values. The results of the Boruta algorithm demonstrated that dust mites had the highest importance in increasing total IgE levels across all populations. For eosinophil counts, dust mites showed the highest importance in males, while in females, the cat and dog allergens were identified as the most influential (Figure 2).
 |
Figure 2 The relative importance of different allergens on t-IgE and eosinophil counts analyzed using the Boruta algorithm in males and females. The x-axis represented feature importance, while green indicates confirmed influence on t-IgE or eosinophil, blue represents rejected and Orange represents tentative. EOS, eosinophil. |
On the other hand, correlation analyses further confirmed the significant relationships between t-IgE, eosinophil counts, and the sensitive index (SI) of allergens involved. A significant positive correlation was found between t-IgE and the number of allergens, as well as their SI (Figure 3). Eosinophil levels also correlated positively, albeit to a lesser extent. Aeroallergens had a more substantial impact on t-IgE levels compared to food allergens, as evidenced by higher correlation coefficients (0.37 and 0.26, respectively). Notably, strong positive correlations between t-IgE, eosinophils, and the SI of specific allergens were particularly observed in atopic patients for specific allergens like willow/aspen/elm, common ragweed, Artemisia argyi, Humulus, soy and shrimp (all r >0.60; Figure 3). The extent of allergen exposure, indicated by the number and SI of allergens, was directly associated with higher t-IgE and, to a lesser extent, eosinophil counts.
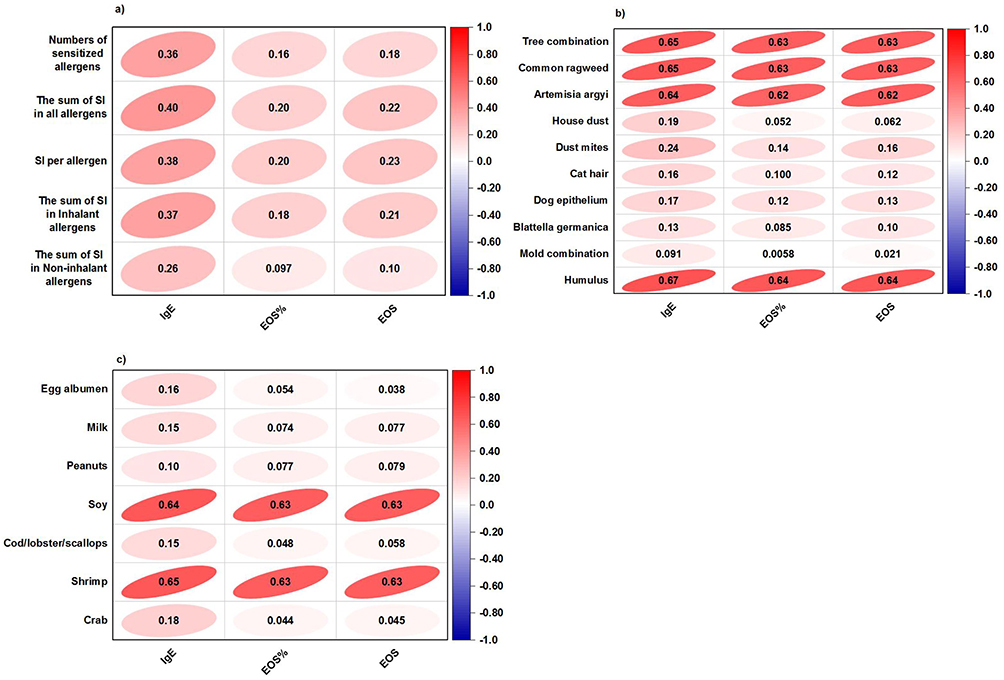 |
Figure 3 Representation of the Spearman correlation coefficient matrix and Spearman’s rank correlation tests applied to various parameters: incidence of sensitization, sensitive index (SI), t-IgE, and peripheral eosinophil (a–c). Positive correlations are highlighted in red, negative correlations in blue, with color intensity indicating the strength of the Spearman r values, which are numerically displayed within the ellipses.EOS, eosinophil. |
Correlation of IgE and Eosinophil Counts with Symptomatology
In our patient cohort, individuals aged 12 years and older primarily reported ear, nose, and throat (ENT) symptoms (1251 patients), respiratory symptoms (1725 patients), and dermatologic symptoms (2815 patients) (Supplementary Table 3). Interestingly, those primarily reporting respiratory symptoms were, on average, older (46.00 ± 16.71 years) compared to those reporting ENT symptoms (43.08 ± 19.50 years) (Supplementary Table 3).
Patients experiencing respiratory symptoms displayed a significantly elevated average SI for aero-allergens when compared to patients with the other two types of symptoms (Supplementary Figure 1a). Notably, 46.6% of patients with respiratory symptoms exhibited sensitization to aeroallergens. Within this subgroup of patients, the average SI for food allergens was also the highest, albeit the discrepancy between these patients and those with skin symptoms or ENT symptoms was relatively minor (Supplementary Figure 1b).
Analyzing the symptomatology in individuals aged 12 and above, we found higher t-IgE levels in those primarily reporting respiratory symptoms (464.20 ± 236.80 IU/mL) compared to dermatologic symptoms (343.00 ± 159.80 IU/mL) or ENT symptoms (332.50 ± 125.00 IU/mL) (Figure 4a). Eosinophil counts exhibited a similar trend, with the highest levels in patients primarily affected by respiratory symptoms (Figure 4b and c).
 |
Figure 4 Characteristics of t-IgE and eosinophils are presented across different symptom categories (a–c). Percentage of positive response to allergens, categorized by the primary symptom are detailed (d). Data was expressed as Mean ± SEM. ENT, ear, nose, and throat. **< 0.01, ***< 0.001. |
Supplementary Figure 1c illustrates the prevalence of elevated t-IgE or increased eosinophil counts within different symptomatic groups. Notably, among patients with respiratory symptoms, a larger proportion exhibited elevated t-IgE compared to those with increased eosinophil counts. Conversely, for those with dermatologic or ENT symptoms, a higher percentage demonstrating increased eosinophil counts.
Significant variations in the prevalence of specific allergens exist among patients with different primary complaints (Figure 4d). For instance, dust mites were commonly linked to respiratory symptoms, with approximately 35% of allergic patients sensitized to dust mites. Patients sensitized to house dust, peanuts, or fish appeared more prone to developing dermatologic symptoms. Among patients with ENT symptoms, 27% showed sensitization to egg.
Assessment of t-IgE and Eosinophil Consistency with Allergen Test Outcomes
Quadrant scatter plot analysis (Figure 5a and b) indicated that over half of patients with positive allergen tests had elevated t-IgE or eosinophil, but only 36.8% exhibited elevations in both biomarkers. In contrast, 22.8% displayed normal levels for both. Among those with negative allergen tests, 40.4% had normal t-IgE and eosinophil, whereas 15.5% showed elevations in both. Importantly, irrespective of allergen test results, higher t-IgE were frequently associated with elevated eosinophils, a statistically significant finding (Supplementary Figure 2). Quadrant scatter plot analysis revealed that elevated t-IgE and eosinophil did not consistently coincide with positive allergen tests, indicating a complex relationship between these biomarkers and atopic sensitivity.
 |
Figure 5 Quadrant scatter plots depicting the distribution of t-IgE and eosinophil levels in patients with positive (a) or negative (b) allergen test results. For various allergens, the incidence of sensitization in four categories grouped by t-IgE and eosinophil counts was indicated in (c). Each analysis is stratified based on t-IgE levels to provide a comprehensive view. EOS, eosinophil. |
In patients with evaluated t-IgE and eosinophil counts, dust mites sensitization had the highest incidence. Most allergen sensitization seemed to induce an increase in t-IgE and eosinophil. However, some aero-allergens like tree combination and mold combination, and food allergens like soy and shrimp, had a weak capacity to induce an increase in t-IgE or eosinophil (Figure 5c).
Further categorization based on t-IgE concentrations into four groups (<60, 60–499, 500–999, and ≥1000 IU/mL) revealed a trend where higher t-IgE was associated with increased eosinophil counts, a greater number of sensitized allergens identified, and a heightened SI (Supplementary Figure 2).
Characteristics of Atopic Patients with Normal t-IgE Levels
Analyzing the characteristics of patients with atopic patients with normal t-IgE levels is crucial for identifying populations at potential risk of overlooked diagnoses of allergic diseases, emphasizing the necessity for additional allergen testing.
Among patients with positive allergen tests, 44.5% had normal t-IgE levels, and 41.4% had normal eosinophil counts. Patients with normal t-IgE levels were, on average, older (48.12 ± 0.95 years) than those with elevated t-IgE (42.46 ± 0.91 years) (Supplementary Table 4). In patients with normal t-IgE levels, eosinophil counts (0.23 ± 0.01×10⁹ cells/L) were lower than in patients with elevated t-IgE (0.46 ± 0.07×10⁹ cells/L) (Supplementary Table 4). Notably, patients with high t-IgE and eosinophil counts were the youngest (41.81 ± 18.29 years) among those undergoing allergen testing, t-IgE, and eosinophil count testing (Table 1).
 |
Table 1 Variability of Age, Sex, t-IgE, and Allergens Sensitized of Patients with Positive Allergen Tests: Grouped by t-IgE and Peripheral Eosinophil Counts |
Patients with elevated t-IgE generally showed higher sensitization rates to most allergens, except for mold, grass and tree pollen, peanuts, and soy, where no significant differences were observed between groups. Without allergen testing, diagnoses may overlook patients allergic to these specific allergens due to normal t-IgE.
Females with elevated eosinophil counts and normal t-IgE levels had a similar proportion to the overall population with elevated t-IgE. Intriguingly, 63.5% of females with allergic symptoms but normal t-IgE and eosinophil levels still had the risk of atopy (Table 1), indicating that normal t-IgE and eosinophil levels do not rule out sensitization, especially in females.
Symptomatically, patients reporting skin and ENT symptoms were comparable between t-IgE normal and elevated groups. Without allergen tests, diagnoses may miss patients with only skin or ENT symptoms due to the absence of elevated t-IgE.
Analyzing the timing of clinic visits and allergen tests in atopic patients revealed that from April to June, most patients exhibited normal t-IgE levels (Supplementary Table 4). Conversely, in other months, those with elevated t-IgE predominated. This highlights the need to consider seasonal factors in allergen tests and diagnoses.
Discussion
Our extensive study on 7,654 patients (1 to 100 years old) illuminates the significant influence of age, sex, and primary symptoms on immunological parameters, utilizing variable t-IgE levels and eosinophil counts as crucial biomarkers for allergic conditions. These findings reveal patterns crucial for guideling clinical practices and interpreting diagnostic tests. Amid the current landscape of allergy research, our investigation meticulously scrutinizes the immunological profiles across diverse age groups, sex, symptoms, and responses to various allergens.
Previous studies have consistently reported elevated t-IgE in children and adolescents, reflecting heightened immunological reactivity in these younger groups.14,15 This aligns with observations of increased allergic reactions or conditions like eczema associated with elevated t-IgE in children.16 Similar traits are found in eosinophils.10 A study from Austria to explore level of the blood eosinophil count in the general population, it was found that age ≤18 years, asthma, current smoking, positive skin prick test and male sex were significantly associated with high blood eosinophil counts. We also observed the same characteristics, which the level of eosinophil counts in 1–17 years was highest in our research. Interestingly, patients in 70–100 years showed a increasing trend on eosinophils although there had no significant difference in our research. Notably, the chemoattractant receptor-homologous molecule expressed on Th2 cells (CRTH2) is a cell surface protein that can reduce tissue eosinophilia and decreases with age,17,18 possibly leading to elevated levels of eosinophils in the elderly. Changes in CD44 and CD54 with age can also affect the eosinophil counts level.17 This notable observation, coupled with insights into changes in specific cell surface molecules associated with eosinophils, suggests potential targets for more tailored allergic diseases treatments across different age groups.
Sex disparities in t-IgE and eosinophil levels are evident, with females consistently exhibited lower levels than males, regardless of atopic status, as found in previous research.10 Even among allergic females, nearly half exhibit normal t-IgE, aligning with findings from our previous study in mild asthma patients, which demonstrated that female patients have lower FeNO than males.19 These observations, supported by literature on sex hormones and immune responses,20–23 emphasize the nuanced understanding needed, as allergic disease incidence and severity in males may not consistently follow patterns. Particularly, in females with allergic symptoms but normal biomarker levels, relying solely on t-IgE and eosinophil counts for diagnosis could lead to underdiagnosis. These findings advocate for heightened clinical vigilance and perhaps a lower threshold for initiating allergen testing in females, even when t-IgE levels appear normal. Various factors, including sex hormones, genetic differences, environmental exposures, and immune system differences, contribute to these disparities. X-chromosomal genotypes like Forkhead Box P3 (FOXP3), may contribute to the development of sensitization against egg and indoor allergens in girls during early childhood.24 It’s the possible reason that although the t-IgE levels in males are higher than in females, the incidence and severity of allergic diseases are not consistently higher in the male population.
Interestingly, elevated t-IgE and eosinophil did not consistently correlate with positive allergen tests. Notably, the SI of allergens such as willow/aspen/elm, common ragweed, Artemisia argyi, Humulus, soy, and shrimp exhibit strong correlations with t-IgE and eosinophil levels in allergy patients.25–29 In contrast, dust mites show no significant correlation, emphasizing the need for a dual-parameter approach in clinical evaluations to avoid diagnostic inaccuracies.
Analysis of symptomatology revealed the highest t-IgE and eosinophil in patients aged 12 years and older with respiratory symptoms. These findings suggest that higher t-IgE and eosinophil counts may indicate more severe respiratory-related atopic conditions.30 In the context of allergic reactivity and the induction of t-IgE and eosinophils, the upper and lower respiratory tracts exhibit distinct functions and responses due to their differing environments and exposures.31–33 When allergens penetrate deeper into the lower respiratory tract, they can induce a more systemic allergic response. This explains why patients with co-morbid allergic rhinitis and asthma have higher t-IgE and eosinophil counts than those with only allergic rhinitis.34,35 Clinically, heightened attention is required for patients visiting the ENT department with high biomarker levels, identifying possible comorbidities of asthma.
In our study, dust mites often cause respiratory symptoms, while egg allergies typically affect the ear, nose, and throat (ENT). Seafood and peanut allergies are usually linked to skin symptoms. This is the first time that different allergens have been linked to different primary symptoms, which is advantageous for clinical practitioners in selecting the appropriate allergen panel for screening based on various clinical presentations.
We have depicted the prevalence of patients displaying elevated t-IgE or eosinophil counts within different symptomatic groups. Notably, among patients experiencing respiratory symptoms, a larger proportion exhibited elevated t-IgE compared to those with increased eosinophil counts. Conversely, for patients with dermatologic or ENT symptoms, the situation was reversed, with a higher percentage demonstrating increased eosinophil counts. Patients with respiratory symptoms should prioritize t-IgE screening. Patients presenting with ENT and dermatological symptoms should not overlook the assessment of peripheral blood eosinophils, which helps to comprehensively identify patients’ allergic traits and contributes to the further exploration of potential beneficiaries of biologic targeted therapies.
Importantly, our quadrant scatter plot analysis indicated that more than a quarter of the patients have both biological markers within the normal range. The sensitization to allergens such as soy, shrimp, mold combination, Artemisia argyi, common ragweed, and willow/aspen/elm was not affected by whether t-IgE and eosinophils are elevated. For this subset of patients, allergen testing is necessary to reflect sensitization, and cannot be replaced by screening with the two biological markers mentioned above. This suggests a need for more comprehensive diagnostic approaches to capture diverse immunological responses.
Finally, our findings underscore the temporal patterns of clinic visits, with peaks in normal t-IgE levels during April to June, suggesting a role for seasonal allergens in symptom elicitation without corresponding biomarker elevations.36–39 This seasonal pattern emphasizes the importance of considering environmental factors when interpreting test results, with implications for the timing of allergen testing and diagnosis.
This study has several limitations that warrant discussion. Firstly, the investigation was conducted as a single-center, retrospective analysis. Future studies should adopt a multi-center, prospective design to validate and extend our results. And it was considered atopy status according to the positive serum allergen test which may be difficult to confirm using other tests. Secondly, the cohort size was limited. For a more comprehensive understanding of the allergy progression and its biomarkers across different age groups, we plan to recruit a larger and more diverse patient population. Lastly, the number of pediatric patients in our study was limited due to the lower outpatient population in the pediatric department.
Conclusion
This study highlights the complex relationship among t-IgE, eosinophils, and atopic diseases and the limitations of traditional biomarkers in capturing the full spectrum of allergic responses. The variations we have observed in t-IgE and eosinophil counts, influenced by age, sex, symptoms, and allergen exposure. In the allergic population, characteristics such as older, female, and having dermatologic or ENT symptoms may be associated with lower t-IgE and eosinophils. It’s crucial to test for allergens based on the specific symptoms presented. Furthermore, our study identifies specific populations at risk of misevaluation. Even if t-IgE and eosinophil levels are normal, for patients exhibiting allergic symptoms with these clinical features, allergen testing is necessary for treatment strategies. And we will perform a prospective research to validate the foundings in the future.
Abbreviations
AHR, airway hyperresponsiveness; CI, confidence intervals; CRTH2, chemoattractant receptor-homologous molecule expressed on Th2 cells; ENT, ear, nose, and throat; FOXP3, Forkhead Box P3; ILC2, group 2 innate lymphoid cell; IQR, interquartile range; NAT, negative allergen test; PAT, positive allergen test; SEM, standard and mean; SI, sensitive index; Th2, T helper 2; t-IgE, total immunoglobulin E.
Data Sharing Statement
All data generated or analysed during this study are included in this published article [and its supplementary information files].
Ethics Approval and Consent to Participate
Given the observational nature of this study, and the minimal risk posed to participants, obtaining informed consent was deemed impracticable. The ethics committee of Shanghai General Hospital, Shanghai Jiao Tong University approved the protocol and a waiver of informed consent was given for our study. And the study complied with the Declaration of Helsinki, which was conducted in strict accordance with the principles of non-invasive data collection, and all patient data were fully anonymized to ensure the protection of privacy throughout the research process.
Our protocol was approved by the ethics committee of Shanghai general hospital and a waiver of informed consent was issued for our study (number: 2017KY159).
Acknowledgments
The authors thank Shanghai Municipal Hospital Respiratory and Critical Care Medicine Specialist Alliance.
Author Contributions
All authors made a significant contribution to the work reported, whether that is in the conception, study design, execution, acquisition of data, analysis and interpretation, or in all these areas; took part in drafting, revising or critically reviewing the article; gave final approval of the version to be published; have agreed on the journal to which the article has been submitted; and agree to be accountable for all aspects of the work.
Funding
This work was supported by the National Natural Science Foundation of China (Grant No. 82270027), Science and Technology Commission of Shanghai municipality (Grant No. 22ZR1449600), Special Talent Project (Grant No. 02.06.01.21.13 and Grant No. 02.06.01.21.56) and Special Research Plan (Grant No. CTCCR-2019B02) of Shanghai General Hospital, Zhongnanshan Medical Foundation of Guangdong Province (Grant No. ZNSXS-20240002).
Disclosure
The authors declare that they have no conflicts of interests.
References
1. Ogulur I, Pat Y, Ardicli O, et al. Advances and highlights in biomarkers of allergic diseases. Allergy. 2021;76(12):3659–3686. doi:10.1111/all.15089
2. Wang J, Zhou Y, Zhang H, et al. Pathogenesis of allergic diseases and implications for therapeutic interventions. Signal Transduct Target Ther. 2023;8(1):138. doi:10.1038/s41392-023-01344-4
3. Bousquet J, Van Cauwenberge P, Khaltaev N, Aria. Workshop Group; World Health Organization. Allergic rhinitis and its impact on asthma. J Allergy Clin Immunol. 2001;108(5 Suppl):S147–334. doi:10.1067/mai.2001.118891
4. Baldacci S, Omenaas E, Oryszczyn MP. Allergy markers in respiratory epidemiology. Eur Respir J. 2001;17(4):773–790. doi:10.1183/09031936.01.17407730
5. Stone KD, Prussin C, Metcalfe DD. IgE, mast cells, basophils, and eosinophils. J Allergy Clin Immunol. 2010;125(2 Suppl 2):S73–80. doi:10.1016/j.jaci.2009.11.017
6. Corren J, Pham TH, Garcia Gil E, et al. Baseline type 2 biomarker levels and response to tezepelumab in severe asthma. Allergy. 2022;77(6):1786–1796. doi:10.1111/all.15197
7. Yancey SW, Keene ON, Albers FC, et al. Biomarkers for severe eosinophilic asthma. J Allergy Clin Immunol. 2017;140(6):1509–1518. doi:10.1016/j.jaci.2017.10.005
8. Woo SD, Park HS, Jang JH, et al. Biomarkers for predicting type 2-high and uncontrolled asthma in real-world practice. Ann Allergy Asthma Immunol. 2023;131(2):209–26.e2. doi:10.1016/j.anai.2023.05.011
9. Zhang M, Jin M, Zhou X, et al. Effectiveness of omalizumab in patients with severe allergic asthma: a retrospective study in China. Respir. Med. 2021;186:106522. doi:10.1016/j.rmed.2021.106522
10. Hartl S, Breyer MK, Burghuber OC, et al. Blood eosinophil count in the general population: typical values and potential confounders. Eur Respir J. 2020;55(5):1901874. doi:10.1183/13993003.01874-2019
11. Çolak Y, Afzal S, Nordestgaard BG, Marott JL, Lange P. Combined value of exhaled nitric oxide and blood eosinophils in chronic airway disease: the Copenhagen general population study. Eur Respir J. 2018;52(2):1800616. doi:10.1183/13993003.00616-2018
12. Zhao L, Fang J, Ji Y, et al. K-means cluster analysis of characteristic patterns of allergen in different ages: real life study. Clin Transl Allergy. 2023;13(7):e12281. doi:10.1002/clt2.12281
13. Xie G, Ding F, Han L, Yin D, Lu H, Zhang M. The role of peripheral blood eosinophil counts in COVID-19 patients. Allergy. 2021;76(2):471–482. doi:10.1111/all.14465
14. Kamdar TA, Peterson S, Lau CH, Saltoun CA, Gupta RS, Bryce PJ. Prevalence and characteristics of adult-onset food allergy. J Allergy Clin Immunol Pract. 2015;3(1):114–5.e1. doi:10.1016/j.jaip.2014.07.007
15. Schulten V, Frazier A, Calatroni A, et al. The association of allergic sensitization patterns in early childhood with disease manifestations and immunological reactivity at 10 years of age. Clin Exp Allergy. 2019;49(8):1087–1094. DOI:10.1111/cea.13406
16. Zhang X, Chen H, Liu S, et al. Allergen sensitization in children in Weifang, china: differences between monosensitization and polysensitization. J Asthma Allergy. 2023;16:397–410. doi:10.2147/JAA.S405549
17. Lingblom C, Käppi T, Bergquist H, et al. Differences in eosinophil molecular profiles between children and adults with eosinophilic esophagitis. Allergy. 2017;72(9):1406–1414. doi:10.1111/all.13140
18. Athari SS. Targeting cell signaling in allergic asthma. Signal Transduct Target Ther. 2019;4:45. doi:10.1038/s41392-019-0079-0
19. Zhang X, Xu Z, Lin J, Xie G, Lv C, Zhang M. Sex differences of small airway function and fractional exhaled nitric oxide in patients with mild asthma. Ann Allergy Asthma Immunol. 2023;130(2):187–98.e3. doi:10.1016/j.anai.2022.11.010
20. González-Gregori R, Dolores Hernández Fernandez De Rojas M, López-Salgueiro R, Díaz-Palacios M, García AN. Allergy alerts in electronic health records for hospitalized patients. Ann Allergy Asthma Immunol. 2012;109(2):137–140. doi:10.1016/j.anai.2012.06.006
21. Park HJ, Kim EJ, Yoon D, et al. Prevalence of self-reported allergic diseases and t-ige levels: a 2010 KNHANES Analysis. Allergy Asthma Immunol Res. 2017;9(4):329–339. doi:10.4168/aair.2017.9.4.329
22. Kim HY, Choi J, Ahn K, et al. Reference values and utility of serum total immunoglobulin e for predicting atopy and allergic diseases in Korean Schoolchildren. J Korean Med Sci. 2017;32(5):803–809. doi:10.3346/jkms.2017.32.5.803
23. Lommatzsch M, Speer T, Herr C, et al. IgE is associated with exacerbations and lung function decline in COPD. Respir Res. 2022;23(1):1. doi:10.1186/s12931-021-01847-0
24. Bottema RW, Kerkhof M, Reijmerink NE, et al. X-chromosome forkhead box p3 polymorphisms associate with atopy in girls in three Dutch birth cohorts. Allergy. 2010;65(7):865–874. doi:10.1111/j.1398-9995.2009.02291.x
25. Han X, Krempski JW, Nadeau K. Advances and novel developments in mechanisms of allergic inflammation. Allergy. 2020;75(12):3100–3111. doi:10.1111/all.14632
26. Xie Y, Shao H, Hu X, Hua X, Meng X, Chen H. Characterization of systemic allergenicity of tropomyosin from shrimp (Macrobrachium nipponense) and anaphylactic reactions in digestive tract. J Sci Food Agric. 2021;101(7):2940–2949. doi:10.1002/jsfa.10926
27. Liu J, Li J, Yin J. Clinical relevance of Alternaria alternata sensitization in patients within type 2-high and type 2-low asthma. Int Immunopharmacol. 2021;101(Pt A):108333. doi:10.1016/j.intimp.2021.108333
28. Jiang T, Ji H, Zhang L, Wang Y, Zhou H. Chitosan oligosaccharide exerts anti-allergic effect against shrimp tropomyosin-induced food allergy by affecting th1 and th2 cytokines. Int Arch Allergy Immunol. 2019;180(1):10–16. doi:10.1159/000500720
29. Ahmed I, Lin H, Li Z, et al. Tyrosinase/caffeic acid cross-linking alleviated shrimp (Metapenaeus ensis) tropomyosin-induced allergic responses by modulating the Th1/Th2 immunobalance. Food Chem. 2021;340:127948. doi:10.1016/j.foodchem.2020.127948
30. Ghosh T, Gangopadhyay S, Das B. Prevalence of respiratory symptoms and disorders among rice mill workers in. India Environ Health Prev Med. 2014;19(3):226–233. doi:10.1007/s12199-014-0384-8
31. Weidinger S, Novak N. Atopic dermatitis. Lancet. 2016;387(10023):1109–1122. doi:10.1016/S0140-6736(15)00149-X
32. Heymann PW, Platts-Mills TAE, Woodfolk JA, et al. Understanding the asthmatic response to an experimental rhinovirus infection: exploring the effects of blocking IgE. J Allergy Clin Immunol. 2020;146(3):545–554. doi:10.1016/j.jaci.2020.01.035
33. Zhu TH, Zhu TR, Tran KA, Sivamani RK, Shi VY. Epithelial barrier dysfunctions in atopic dermatitis: a skin-gut-lung model linking microbiome alteration and immune dysregulation. Br J Dermatol. 2018;179(3):570–581. doi:10.1111/bjd.16734
34. Bousquet J, Melén E, Haahtela T, et al. Rhinitis associated with asthma is distinct from rhinitis alone: the ARIA-MeDALL hypothesis. Allergy 2023;78(5):1169–1203. DOI:10.1111/all.15679
35. Kim JY, Lee S, Suh DI, et al. Distinct endotypes of pediatric rhinitis based on cluster analysis. Allergy Asthma Immunol Res. 2022;14(6):730–741. doi:10.4168/aair.2022.14.6.730
36. Nassikas NJ, Gold DR. Climate change is a health crisis with opportunities for health care action: a focus on health care providers, patients with asthma and allergic immune diseases, and their families and neighbors. J Allergy Clin Immunol. 2023;152(5):1047–1052. doi:10.1016/j.jaci.2023.09.013
37. Burbank AJ, Espaillat AE, Hernandez ML. Community- and neighborhood-level disparities in extreme climate exposure: implications for asthma and atopic disease outcomes. J Allergy Clin Immunol. 2023;152(5):1084–1086. doi:10.1016/j.jaci.2023.09.015
38. Sözener Z Ç, Treffeisen ER, Öztürk B Ö, Schneider LC. Global warming and implications for epithelial barrier disruption and respiratory and dermatologic allergic diseases. J Allergy Clin Immunol. 2023;152(5):1033–1046. doi:10.1016/j.jaci.2023.09.001
39. D’Amato G, Chong-Neto HJ, Monge Ortega OP, et al. The effects of climate change on respiratory allergy and asthma induced by pollen and mold allergens. Allergy. 2020;75(9):2219–2228. doi:10.1111/all.14476
 © 2025 The Author(s). This work is published and licensed by Dove Medical Press Limited. The
full terms of this license are available at https://www.dovepress.com/terms.php
and incorporate the Creative Commons Attribution
- Non Commercial (unported, 4.0) License.
By accessing the work you hereby accept the Terms. Non-commercial uses of the work are permitted
without any further permission from Dove Medical Press Limited, provided the work is properly
attributed. For permission for commercial use of this work, please see paragraphs 4.2 and 5 of our Terms.
© 2025 The Author(s). This work is published and licensed by Dove Medical Press Limited. The
full terms of this license are available at https://www.dovepress.com/terms.php
and incorporate the Creative Commons Attribution
- Non Commercial (unported, 4.0) License.
By accessing the work you hereby accept the Terms. Non-commercial uses of the work are permitted
without any further permission from Dove Medical Press Limited, provided the work is properly
attributed. For permission for commercial use of this work, please see paragraphs 4.2 and 5 of our Terms.