")
Back to Journals » Journal of Inflammation Research » Volume 17
Alterations in Astrocyte Subpopulations in Glioma and Identification of Cuproptosis-Related Genes Using Single-Cell RNA Sequencing
Authors Huang H , Long Z , Deng Y, Huang Z, Lv Z, Sun Q, Liu H, Liang H, Hu F
Received 15 April 2024
Accepted for publication 31 August 2024
Published 11 September 2024 Volume 2024:17 Pages 6329—6344
DOI https://doi.org/10.2147/JIR.S473932
Checked for plagiarism Yes
Review by Single anonymous peer review
Peer reviewer comments 3
Editor who approved publication: Professor Ning Quan
Hao Huang,1 Zhiping Long,2 Ying Deng,3 Zhicong Huang,3 Zhonghua Lv,4 Qian Sun,4 Hui Liu,4 Hongsheng Liang,5 Fulan Hu6
1Department of Preventive Medicine, Zhuhai Campus of Zunyi Medical University, Zhuhai, Guangdong, People’s Republic of China; 2Department of Epidemiology, Public Health School of Harbin Medical University, Harbin, Heilongjiang, People’s Republic of China; 3Department of Epidemiology and Health Statistics, Fujian Provincial Key Laboratory of Environment Factors and Cancer, School of Public Health, Fujian Medical University, Fuzhou, People’s Republic of China; 4Department of Neurosurgery, Third Affiliated Hospital of Harbin Medical University, Harbin, Heilongjiang, People’s Republic of China; 5Department of Neurosurgery, First Affiliated Hospital of Harbin Medical University, Harbin, Heilongjiang, People’s Republic of China; 6Department of Biostatistics and Epidemiology, School of Public Health, Shenzhen University Medical School, Shenzhen, Guangdong, People’s Republic of China
Correspondence: Fulan Hu, Department of Biostatistics and Epidemiology, School of Public Health, Shenzhen University Medical School, Shenzhen, Guangdong, People’s Republic of China, Email [email protected] Hao Huang, Department of Preventive Medicine, Zhuhai Campus of Zunyi Medical University, Zhuhai, Guangdong, People’s Republic of China, Email [email protected]
Purpose: Mitochondrial metabolism is essential for energy production and the survival of brain cells, particularly in astrocytes. Cuproptosis is a newly identified form of programmed cell death that occurs due to the disruption of mitochondrial metabolism caused by excessive copper toxicity. However, the relationship between cuproptosis-related genes (CRGs) in the tumor microenvironment (TME) and the prognosis of gliomas remains unclear.
Patients and Methods: In this study, we utilized 32,293 cells obtained from three in-house single-cell RNA sequencing (scRNA-seq) datasets, along with 6,148 cells acquired from the Chinese Glioma Genome Atlas (CGGA) involving 14 glioma patients, to identify and validate the TME of gliomas.
Results: Based on an analysis of 32,293 single cells, we investigated intra-tumor heterogeneity, intercellular communication, and astrocyte differentiation trajectories in gliomas. Our findings revealed that the TGFβ signaling pathway exhibited a higher relative strength in astrocyte subpopulations. Additionally, we identified a novel three-gene signature (CDKN2A, SOX2, and MPC1) was identified for prognostic prediction. Furthermore, glioma patients with a high-risk score demonstrated poorer overall survival (OS) compared to those with a low-risk score in both training and testing datasets (Ptraining set < 0.001; Ptest set = 0.037).
Conclusion: Our study revealed the prognostic value of the CRGs in astrocytes exhibiting tumor immunosuppressive characteristics in glioma. We established a novel three-gene prognostic model that offers new insights into the prognosis and treatment strategies for gliomas.
Keywords: scRNA-seq, gliomas, astrocyte, cuproptosis, prognosis
Graphical Abstract:

Introduction
Gliomas are the most common and highly aggressive primary cancers of the central nervous system (CNS) cancer.1 They primarily consist of adult astrocytomas, oligodendrogliomas, and glioblastomas (GBM). Astrocytomas and oligodendrogliomas are characterized by high heterogeneity, relatively slow growth, a propensity for recurrence, and the potential to progress into GBM.2,3 Different types of gliomas, such as astrocytomas, originate from astrocytes, making them fundamental and unique in tumor formation.4 GBM, the most malignant form of astrocytoma, represents the most aggressive primary glioma of astrocytic origin, with a dismal median survival of less than 16 months.5 Despite the current standard treatment, which includes surgery, chemotherapy, and radiation, tumor recurrence is ultimately inevitable.3 The glioma microenvironment is highly heterogeneous, influencing tumorigenesis and structural evolution, and exhibits both inter-tumoral and intra-tumoral heterogeneity due to distinct phenotypic variations, tumor cell types, and cellular states.6,7 Therefore, a comprehensive exploration of the heterogeneity of cellular subtypes within the glioma microenvironment is essential for understanding the pathogenesis of gliomas and for the development of new therapeutic strategies.
The tumor microenvironment (TME) of gliomas is composed of heterogeneous subsets of tumor cells, astrocytes, tumor-associated macrophages, and various immune cells that play distinct roles in tumorigenesis, progression, and response to clinical therapies.8,9 Among these, astrocytes, which are the most abundant glial cells, interact with T cells, monocytes, and microglia, and are involved in the regulation of the TME, thereby influencing therapies that modulate T cell responses in gliomas.10–12 These findings suggest that the study of the TME in gliomas should be conducted at the single-cell level. Single-cell RNA sequencing (scRNA-seq) offers significant advantages in elucidating the heterogeneity within gliomas by analyzing the expression data of individual cells.13 Furthermore, while astrocytes have been shown to either inhibit or promote the growth of brain tumors in mice, little is known about the potential roles of astrocyte subpopulations within the TME of gliomas.14,15
Mitochondria are crucial for energy generation and metabolism, and the survival of brain cells, particularly astrocytes. Astrocytes play a key role in maintaining brain redox balance, bioenergetics, and neurotransmission.16,17 Oxidative stress-induced lipid peroxidation, resulting from impaired mitochondrial metabolism, can lead to ferroptosis in astrocytes.18 Cuproptosis, a newly identified form of copper-induced cell death, facilitates the aggregation of mitochondrial proteins and disrupts the function of mitochondrial metabolic enzymes. This process is characterized by copper-dependent intracellular reactive oxygen species (ROS) production and excessive accumulation of lipid peroxides.19 Copper is an essential micronutrient that maintains normal cellular function and contributes to oncogenesis due to its critical biological roles in cell signaling, oxygen transport, and enzyme activity, particularly in promoting ROS production.20,21 Copper chelators can induce immune checkpoint inhibition and reduce the expression of PD-L1,22 thereby enhancing anti-tumor immune responses and improving treatment efficacy.23,24 Copper toxicity may be mediated by the synthesis of lipoylated enzyme genes, including FDX1, CDKN2A, and MPC1, which, in conjunction with lipoylated proteins, play vital roles in cancer progression.19,25 Therefore, the cuproptosis of astrocytes, driven by copper toxicity and mitochondrial metabolic damage, may represent a novel therapeutic approach for gliomas. Additionally, the composition and cellular interactions within the TME are closely related to the prognosis of gliomas.26 However, the potential role of cuproptosis-related genes (CRGs) in the TME and their implications for prognosis prediction in gliomas remain unclear.
In this study, we aimed to comprehensively identify the tumor microenvironment in gliomas and characterize the CRGs within astrocyte subpopulations. We conducted an analysis of single-cell RNA sequencing using samples from three in-house glioma patients, along with data from 14 previously published patients from the Chinese Glioma Genome Atlas (CGGA). Additionally, we validated the characteristics of CRGs using bulk RNA sequencing data from both the CGGA and The Cancer Genome Atlas (TCGA) datasets. Furthermore, we established and validated a CRG-score system in different independent cohorts to quantify the cuproptosis characteristics of individual tumors and predict the prognosis of gliomas.
Materials and Methods
Study Design and Data Acquisition
Published single-cell RNA sequencing unique molecular identifier (UMI) counts from 14 glioma patients, encompassing 6,148 cells, were obtained from the CGGA dataset.27 The scRNA-seq was conducted on an Illumina 4000 platform. Bulk expression data and clinical information were sourced from 656 glioma patients in the CGGA dataset (http://www.cgga.org.cn/) and 628 gliomas patients from TCGA-GBM and TCGA-LGG (low-grade glioma) (https://portal.gdc.cancer.gov/repository). We applied batch correction to the mRNA sequencing data using the ComBat algorithm for both the CGGA and TCGA datasets. The clinical features for the CGGA and TCGA datasets included age, gender, tumor grade, 1p19q codeletion, IDH mutation, MGMT methylation status, follow-up time, and survival status.
Sample Collection and Preparation
Three samples (two GBM and one LGG with tumor-only samples) were collected for single-cell RNA sequencing, along with ten samples containing both tumor and adjacent normal tissues for bulk RNA sequencing. These samples were obtained from glioma patients who had undergone surgical resection at the First Affiliated Hospital of Harbin Medical University. Pathological diagnoses were conducted independently by at least two qualified pathologists. Fresh tissues were immediately dissected into fractions and enzymatically digested to obtain single cells. The study received ethical approval from the Institutional Ethics Committee of Harbin Medical University and was conducted in accordance with the Declaration of Helsinki. Written informed consent was obtained from each patient.
The glioma tissue was dissociated using a tumor dissociation kit (Miltenyi Biotech, Germany) following the manufacturer’s instructions. The dissociated tissue was then stored in Wash Cell MACS Tissue Storage Solution supplemented with RPMI 1640 and 10% fetal bovine serum (FBS).
Subsequently, the samples were sieved through a 40 µm cell strainer and centrifuged at 300 x g for 7 min. The supernatant was completely removed, and the pelleted cells were suspended in red blood cell lysis buffer (Solarbio) to lyse the red blood cells. The cells were resuspended in RPMI1640 + 10% FBS and re-filtered through a 35-mm cell strainer. Finally, resuspend cells as required were used for scRNA-sequencing.
ScRNA-Sequencing Library Construction and Processing
Each cell suspension was generated to 3′ single-cell RNA sequencing libraries using the Chromium Next GEM Chip G Single Cell Kit, Single Cell 3′ Library, and Gel Bead Kit V3.1 (10x Genomics). The 10x Genomics Chromium platform was utilized to construct a 10x barcoded cDNA library. The 10x libraries were sequenced on an Illumina Novaseq 6000 sequencing platform (Illumina, San Diego, CA) and subsequently mapped to the GRCh38 human reference genome using the Cell Ranger toolkit (version 4.0.0). The gene-barcode matrix was then generated following the Seurat (version 4.1.3) pipeline in R software (version 4.1.1). Low-quality cells, defined as those with a detected gene count of fewer than 200 or more than 6,000, or those exhibiting a high mitochondrial transcript ratio (>20%), were excluded from the analysis. The total number of transcripts in each cell was normalized to 10,000 using log transformation.
Identification of Glioma Cells and Subtypes
After normalization and scaling, we utilized Seurat to eliminate batch effects among patients using the mutual nearest neighbor algorithm. Additionally, we regressed out mitochondrial contamination and cell cycle effects. Principal component analysis (PCA) was performed to identify the top 2,000 highly variable genes. A subset of significant principal components (PCs) was selected for cluster analysis using the PC ElbowPlot function in Seurat. Cell clustering, sub-clustering, and visualization via t-distributed stochastic neighbor embedding (tSNE) were conducted separately using the FindClusters and RunTSNE functions in the Seurat package, with appropriate resolutions. Cell identity annotations for each cluster were defined using the SingleR package and subsequently verified manually. The known marker genes for cell types included epithelial cells, stromal cells, myeloid cells, T cells, B cells, plasma cells, and undefined astrocytes.28–30
Cell-Cell Communication Analysis
The key signals and latent intercellular communication networks from the annotation of cell identify on different cell clusters were identified by the R package “CellChat” (version 1.0.0), which contained ligand-receptor interaction databases using a non-negative matrix factorization (NMF) method that has been successfully applied in pattern recognition.31 The number of ligand-receptor and strength of cell-cell communication were estimated from the target cell cluster to other cell clusters using the function of aggregateNet in CellChat. Major signaling pathways for target cell groups and intercellular communication patterns were depicted. Additionally, we identified both outgoing and incoming signals of different cell subtypes across all NMF clusters. By utilizing the computeNetSimilarity function, we classified signaling groups based on the similarity of their functions and structures.
Developmental Pseudo-Time Analysis
Trajectory analysis of astrocyte types in glioma was conducted using the Monocle R package to investigate potential lineage differentiation among astrocyte subpopulations.32 First, significant marker genes in each cluster were identified using the “differentialGeneTest” function within the Monocle package. The cell differentiation trajectory was then analyzed with two-dimensional reduction parameters via the DDRTree method, and astrocytes were ordered using the “orderCells” function. Subsequently, pseudo-time-dependent genes were identified through the “differentialGeneTest” function. Finally, differentially expressed genes between branches were visualized to identify co-expressed gene modules using the BEAM function.
Construction and Validation of the Cuproptosis-Related Genes Model
According to a false discovery rate (FDR) threshold of <0.05, we identified 27 cuproptosis-related genes from the study by Peter Tsvetkov et al.19 The intersection of cuproptosis-related genes and pseudotime-dependent genes was determined using the Venn function in the R package. To assess the overall prognostic impact of these CRGs in glioma patients, we constructed prognostic risk models using the training dataset from the CGGA glioma expression data (N=656). In the CGGA training dataset, the model for cuproptosis-related genes was developed based on the mRNA expression levels of the intersecting genes and their corresponding coefficients, as determined by multivariate Cox regression analysis.

where Expri expressed these cuproptosis-related intersection genes, the multivariate model calculated the Coefi coefficient, and the CRG-score represents a multimode weighted sum of the prognostic value for each sample. Using the median as the cut-off value, CGGA glioma patients were categorized into low- and high-risk groups. The Kaplan-Meier survival curves were used to assess the prognostic performance of the model. Additionally, TCGA glioma dataset was utilized to validate the performance of the risk-score model as an independent testing set (N=628). The relative abundance of 22 immune-infiltrating cells between the low- and high-risk groups was quantified using the CIBERSORT algorithm. The Human Protein Atlas (https://www.proteinatlas.org/) database was used to verify the protein expression levels of the cuproptosis-related genes in glioma and normal tissues.
Targeted mRNA Sequencing and Data Processing
Total RNA from glioma tissues for mRNA sequencing was extracted using TRIzol (Invitrogen) reagent, followed by the removal of genomic DNA contamination using DNase. The mRNA was isolated for RNA sequencing library preparation for Illumina (HaploX Genomics Center, Jiangxi, China). RNA sequencing was performed on the Illumina NovaSeq 6000 instrument using the paired-end 2×150 sequencing mode. Raw reads were assessed for quality, and FastQC was utilized to ensure high read quality. The clean reads were aligned to the human reference genome (hg19) using HISAT2 software, and the read counts for each gene were calculated with featureCounts (v1.6.3).
Statistical Analysis
All statistical analyses of scRNA-seq data were conducted using R software (version 4.1.1). A P-value of less than 0.05 was considered statistically significant. The analyses utilized several packages, including Seurat, CellChat, SingleR, and Monocle. Differences between the two groups were assessed using the t-test, while correlations were determined using either Pearson’s or Spearman correlation tests.
Results
Landscape of the Glioma Ecosystem Revealed by scRNA-Seq
The study design used in this study is depicted in Figure S1. To systematically interrogate the intra-tumoral heterogeneity of the glioma ecosystem, we generated scRNA-seq profiles from three glioma patients. A total of 32,982 cells were acquired from these samples, and 32,293 cells were retained after quality control following standard procedures. Firstly, we used the harmony function to normalize the glioma samples and then reduced the dimensionality of the scRNA-seq data by PCA. Then, we observed 24 different cell clusters by tSNE approaches (Figure S2 and Table S1). According to the annotation of the uniquely established expressed marker gene and checked manually, we classified 24 cell clusters into five cell types, including those from myeloid cells, stromal cells, T cells, NK cells, and astrocytes (Figure S3A and Table S2). To further validate the heterogeneity of our scRNA-seq of the glioma ecosystem, we similarly analyzed the scRNA-seq of 14 glioma patients in the CGGA dataset based on tSNE, and found 17 clusters of cells annotated as myeloid cells, T cells, B cells, and astrocytes based on preferentially expressed marker genes (Figure S3B and Figure S4A and B). Astrocytes are considered as the most abundant glioma cell type in the central nervous system. In our in-house and CGGA datasets, we further divided into five subclusters and six subclusters of astrocyte, respectively (Figure S5). Finally, we identified nine similar cell types using tSNE in our in-house and CGGA samples (Figure 1A and B), including myeloid cells, T cells, and astrocytes.
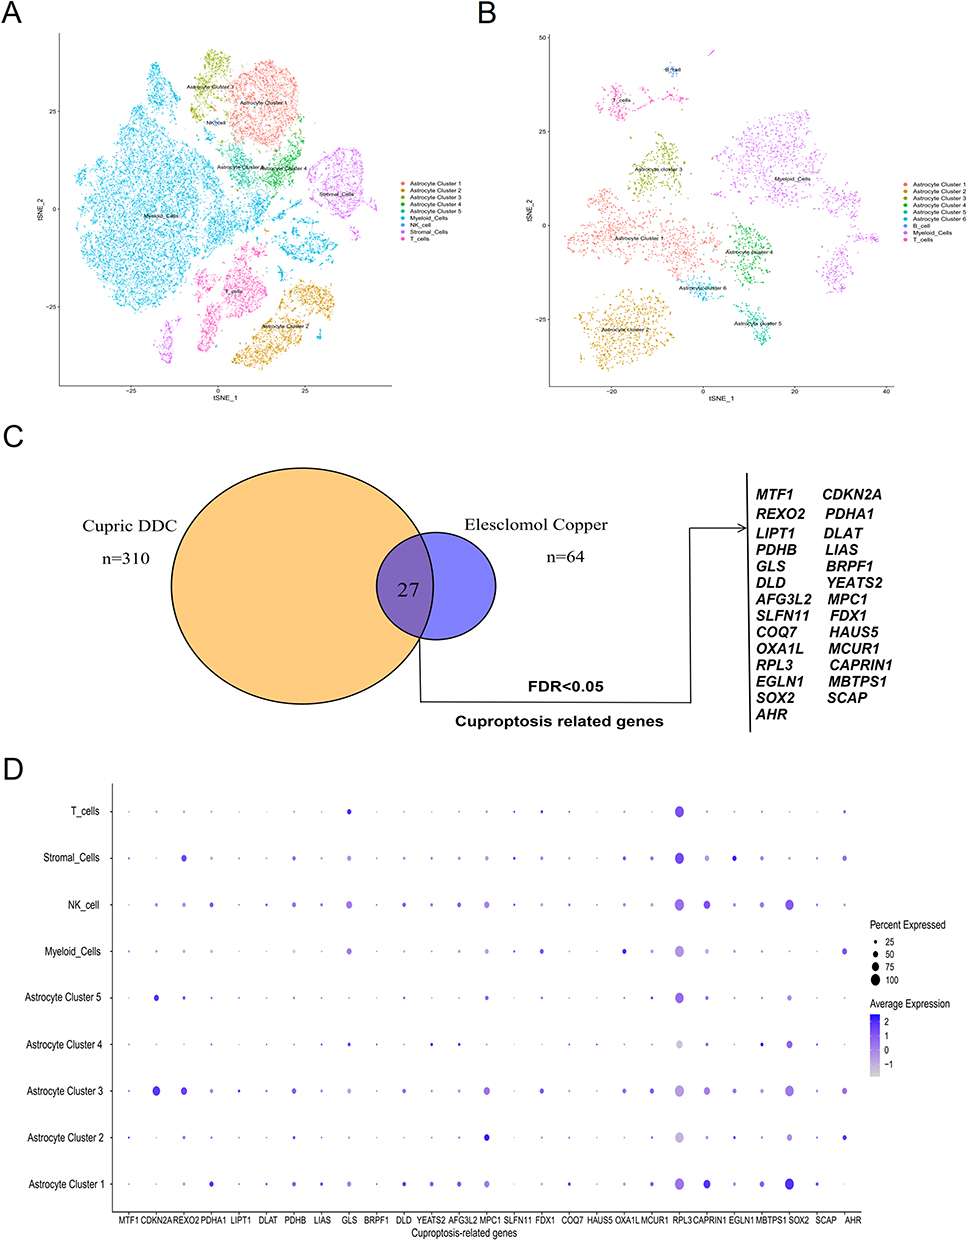 |
Figure 1 Analysis of cuproptosis-related genes across various cell types in glioma. (A) tSNE visualization of our glioma single-cell transcriptional profiles. (B) tSNE visualization of CGGA glioma single-cell transcriptional profiles. Each dot represents an individual cell, with different colors indicating distinct cell types. (C) Whole-genome CRISPR-Cas9 positive selection screen utilizing two copper ionophores (Cu-DDC and elesclomol-copper) in cells. Overlapping hits with an FDR value of less than 0.05 were analyzed. (D) Bubble plot illustrating cuproptosis-related genes for each cell type in glioma. Abbreviations: tSNE, t-Distributed Stochastic Neighbor Embedding; FDR, false discovery rate. |
Cuproptosis played an important role in tumor growth, angiogenesis, and immune response in gliomas.20 A total of 27 cuproptosis genes were used in this study (Figure 1C). To further elucidate the role of these cuproptosis genes in various cell types within the tumor microenvironment, we calculated the proportion of different cell types for cuproptosis-related genes in each cell subset. The expression levels of cuproptosis genes on different cell types were depicted in Figure 1D, including CDKN2A, MPC1, RPL3, etc. Additionally, we evaluated the expression levels of cuproptosis-related genes in astrocyte subpopulations and found that seven genes of CDKN2A, REXO2, MPC1, RPL3, CAPRIN1, SOX2, and AHR have higher expression levels in the tSNE and violin plots (Figure S6 and S7).
Intercellular Communication Patterns Predict Potential Signaling Pathways
To further elucidate the plasticity of various cell subtypes within the tumor microenvironment, we used CellChat to quantitatively analyze intercellular communication networks among ligands, receptors, and their connections derived from our in-house glioma scRNA-seq data. In Figure 2A, we observed the aggregated cellular communication network, revealing significant changes in interaction strength between myeloid cells and astrocyte subpopulations. We further identified potential signaling pathways within these cell types and categorized these pathways based on their functional and structural similarities (Figure 2B). Four groups of pathways were determined based on functional similarity grouping. Group 1 consists of EGF, FGF, and PTN pathways, which represent promiscuous signaling. Group 2 includes IGF, CD80, and OSM, primarily representing signaling from astrocyte subpopulations. Group 3 includes PDGF, APP, and JAM, and largely represents signaling between stromal cells and T cells. Group 4 is dominated by inflammatory pathways (eg, IL, IFN, TGFβ, CCL). Meanwhile, structural similarity grouping also identified four groups of signaling pathways. CellChat analysis can simply predict putative function by grouping well-known signaling pathways. To further identify the detailed communication patterns for the key individuals in different cell types, we analyzed communication patterns that coordinate cell groups with signaling pathways, which determined five outgoing signaling patterns and three incoming signaling patterns (Figure 2C). The outgoing communication pattern indicated that all outgoing signaling from astrocytes is characterized by patterns 1 and 5, which represent pathways involving TGFβ, CXCL, IL, IFN, and HGF. Conversely, the incoming signaling to astrocytes is predominantly represented by pattern 1, which includes multiple pathways such as TGFβ, IFN, and CXCL.
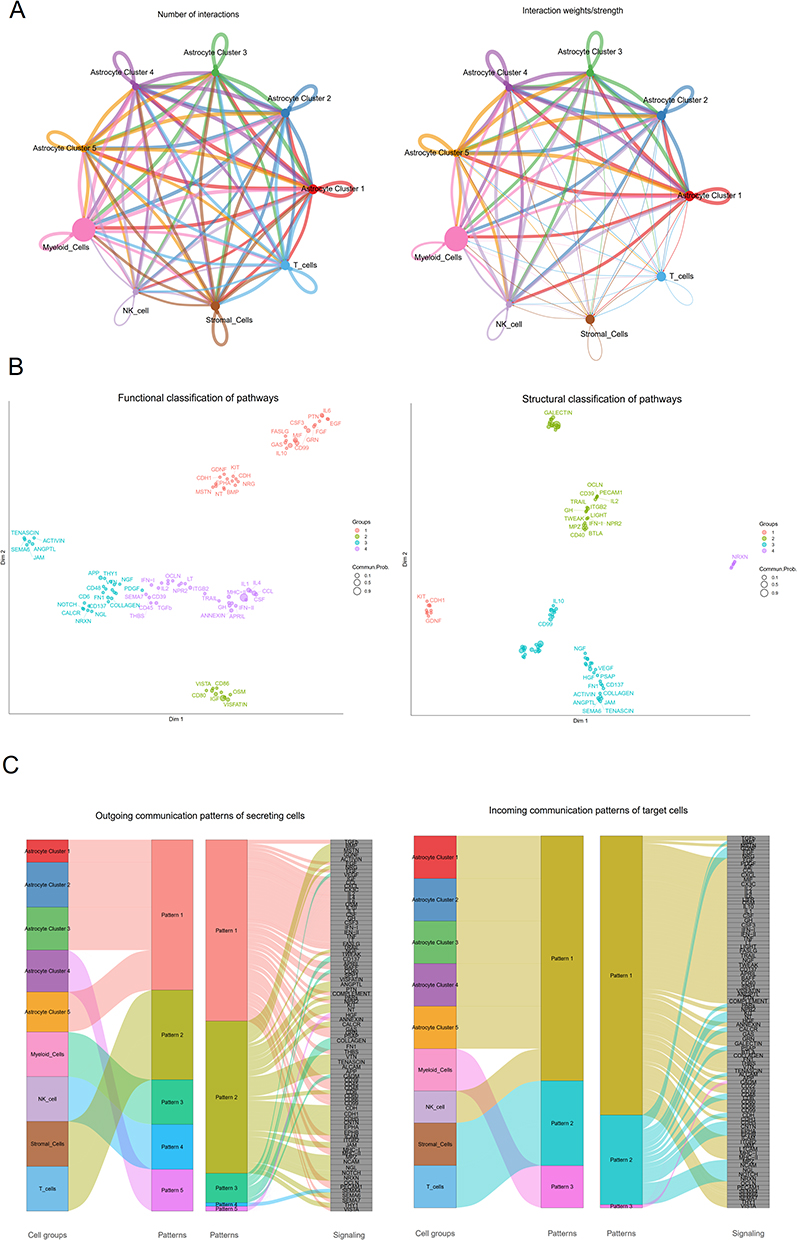 |
Figure 2 Interactions in Cell-Cell Communication in Glioma. (A) A landscape of cell-cell network communications. The thickness of the edges represents the number (Left) or the weight (Right) of interactions among cell types. (B) Categorization of signaling pathways based on cell functionality (Left) and structure (Right). Each dot represents a distinct signaling pathway. (C) Outgoing (Left) signaling patterns of target cells and incoming (Right) signaling patterns of secreting cells. |
To further elucidate the complex interactions within intracellular networks among astrocyte subpopulations and other immune cells, CellChat identified 95 signaling pathways across nine cell types, including TGFβ, BMP, TNF, CXCL, CCL, and MIF pathways, as demonstrated by heatmap analysis (Figure S8A). Our findings indicated that the TGFβ signaling pathway exhibited a higher relative strength in astrocyte subpopulations. The TGFβ signaling network revealed that myeloid cells were the predominant sources of TGFβ ligands, which operated in an autocrine way among myeloid cells and in a paracrine way from immune cells to diverse astrocyte subpopulations, particularly in astrocyte cluster 1 (Figure S8B). In addition, we observed that myeloid cells, as a primary source of ligands, functioned in both autocrine and paracrine manners from immune cells to astrocyte clusters 3 and 4 in the CGGA dataset (Figure S8C). Within the TGFβ signaling pathways, we systematically explored the predicted signals from astrocytes to immune cells and identified five ligand-receptor pairs that were active between different astrocyte subpopulations and myeloid cells during the process of astrocyte specification, predominantly involving the TGFB3 ligand and its multimeric ACVR1B/TGFBR2 receptor (Figure S8D).
Pseudotime-Dependent Trajectory Analysis Revealed Alterations in Astrocyte Subpopulations and Cuproptosis-Related Genes in Glioma
To further analyze the developmental progress of all astrocyte subpopulations in glioma, we constructed potential developmental trajectories for five astrocyte clusters using the Monocle method (Figure 3A). We observed that three distinct branches could assign pseudotime-dependent progression states to the astrocytes (Figure 3B and C). Astrocyte cluster 1 and a portion of astrocyte cluster 4 were primarily located at the beginning of the developmental trajectory. In contrast, astrocyte cluster 2 and astrocyte cluster 3 were situated at opposite ends of the trajectory. Additionally, we identified a major pathway with distinct branches to validate the potential developmental trajectories of six astrocyte subpopulations in the CGGA dataset (Figure S9A). Astrocyte cluster 2 was predominantly positioned at the start of the timeline trajectory, whereas astrocyte cluster 3 and astrocyte cluster 5 were located at the end of the timeline trajectory (Figures S9B and C).
 |
Figure 3 Pseudotime analysis of different astrocyte subpopulations. (A–C) Distribution of astrocyte cells along the pseudotime trajectory based on astrocyte cell subpopulations: (A) astrocyte cell subpopulations, (B) state, and (C) pseudotime. (D) Heatmap analysis of the expression of cuproptosis-related genes along the pseudotime, categorized by cell cluster. (E and F) Variability in the expression levels of seven genes along the pseudotime (E) and within each astrocyte cell subpopulation (F), based on cell states in our scRNA-seq data. (G and H) Variability in the expression levels of seven genes along the pseudotime (G) and within each astrocyte cell subpopulation (H), based on cell states in the CGGA scRNA-seq dataset. Abbreviation: CGGA, Chinese Glioma Genome Atlas. |
In addition, we further analyzed the expression patterns of cuproptosis-related genes along the trajectory of glioma development. The pseudotime heatmap of CRGs derived five distinct clusters of pseudotime patterns (Figure 3D). The expression of cuproptosis genes gradually increased with pseudotime in astrocyte cluster 1, while it gradually decreased with pseudotime in astrocyte clusters 2 and 3. These results illustrate the pseudotime-dependent trajectory of astrocyte subpopulations and the time-dependent changes in cuproptosis-related genes in glioma.
To investigate the overlapping genes between cuproptosis and pseudotime-related genes, we identified seven genes common to both categories: AHR, CARPIN1, CDKN2A, MPC1, REXO2, RPL3, and SOX2 (Figure 3E, F, and Table S3). Furthermore, we validated similar findings in the CGGA single-cell RNA sequencing data, which included CDKN2A, MPC1, and SOX2 (Figure 3G, H, and Table S4). We also observed dynamic changes in the expression patterns of overlapping genes along the trajectory of glioma development and pseudotime in both our in-house and CGGA datasets.
Development and Validation of Cuproptosis-Related Prognosis Signature in Glioma
According to the results of cuproptosis and pseudotime-related genes in our in-house and CGGA datasets, we further constructed a cuproptosis-related signature using three prognosis-related cuproptosis genes. The risk score for CRGs is calculated as follows: CRGs risk score = (−0.09 × expression level of CDKN2A) + (−0.08 × expression level of MPC1) + (0.134 × expression level of SOX2). In the CGGA training dataset, 656 glioma patients with high-risk scores exhibited poorer overall survival (OS) compared to those with low-risk scores (Log rank test, P < 0.001) (Figure 4A, C, and 4D). By incorporating the risk score and other clinical characteristics into univariate and multivariate Cox regression analyses, we identified the risk score as an independent prognostic factor for glioma (Table S5). To verify the applicability and generalizability of the risk score, we further applied it to independent external cohorts from TCGA (n = 628) and obtained similar results (Log rank test, P = 0.037) (Figure 4B, Figure S10A and B). Additionally, we constructed a nomogram that included risk scores and key clinical features. The calibration analysis indicated that the prognostic nomogram is an effective model for predicting the 1-, 3-, and 5-year OS of the 656 glioma patients (Figure 4E and F).
 |
Figure 4 Construction, validation, and evaluation of a risk score model based on cuproptosis-related genes. (A and B) Kaplan–Meier curve analysis for OS of glioma patients, comparing high-risk and low-risk groups in the training (A) and testing (B) sets. (C) Overview of survival in the high-risk and low-risk groups in the training set. (D) Distribution of risk scores among the high-risk and low-risk subgroups in the training set. (E) Nomogram for predicting the 1-, 3-, and 5-year OS of all glioma patients. (F) Calibration curves of the nomogram for predicting the 1-, 3-, and 5-year OS of all glioma patients. (G) Abundance of 22 infiltrating immune cell types in high-risk and low-risk groups. (H) Ranked dot and scatter plots illustrating the correlation between risk score and 22 infiltrating immune cell types in the training dataset. (I and J) Gene sets enriched in the high-risk (I) and low-risk (J) subgroups in the training dataset. *, P < 0.05; **, P < 0.01; ***, P < 0.001. Abbreviations: OS, overall survival. |
According to the CIBERSORT algorithm, we further observed significant differences in immune infiltrating cells between high- and low-risk scores, particularly in B cells memory (P < 0.05), T cells follicular helper (P < 0.05), monocytes (P < 0.001), and macrophages M0 (P < 0.05) in the training dataset of 656 glioma patients (Figure 4G and Table S6). Furthermore, we found that B cells memory (P<0.05) and monocytes (P < 0.01) were correlated with risk scores (Figure 4H). Meanwhile, immune infiltrating monocytes that significantly correlated with risk scores were also identified in TCGA testing dataset (P < 0.001) (Figure S10C and S10D). To further elucidate the biological functions associated with the high- and low-risk groups, we conducted a Gene Set Enrichment Analysis (GSEA) and found that the gene sets of the high-risk group were enriched in tumor signaling pathways (Figure 4I), while the gene sets of the low-risk group were enriched in metabolic and immune networks (Figure 4J). Similar results also were validated in the TCGA validation dataset (Figure S10E-S10F). The detailed results of the GSEA are summarized in Table S7.
Experiment Validation for Expression Levels of the Three Cuproptosis-Related Genes
We further evaluated the differential expression levels of the CDKN2A, MPC1, and SOX2 genes through targeted mRNA sequencing in glioma and adjacent normal tissues. Our analysis revealed that CDKN2A (P < 0.05) and SOX2 (P < 0.05) were highly expressed, while MPC1 (P < 0.01) exhibited decreased expression in glioma tissue (Figure 5A). To further investigate the clinical and functional role of these genes, we examined the protein expression levels of tumor and normal tissues based on the Human Protein Atlas database. The expression levels of these three genes (CDKN2A, MPC1, and SOX2) were consistent with our in-house results (Figure 5B).
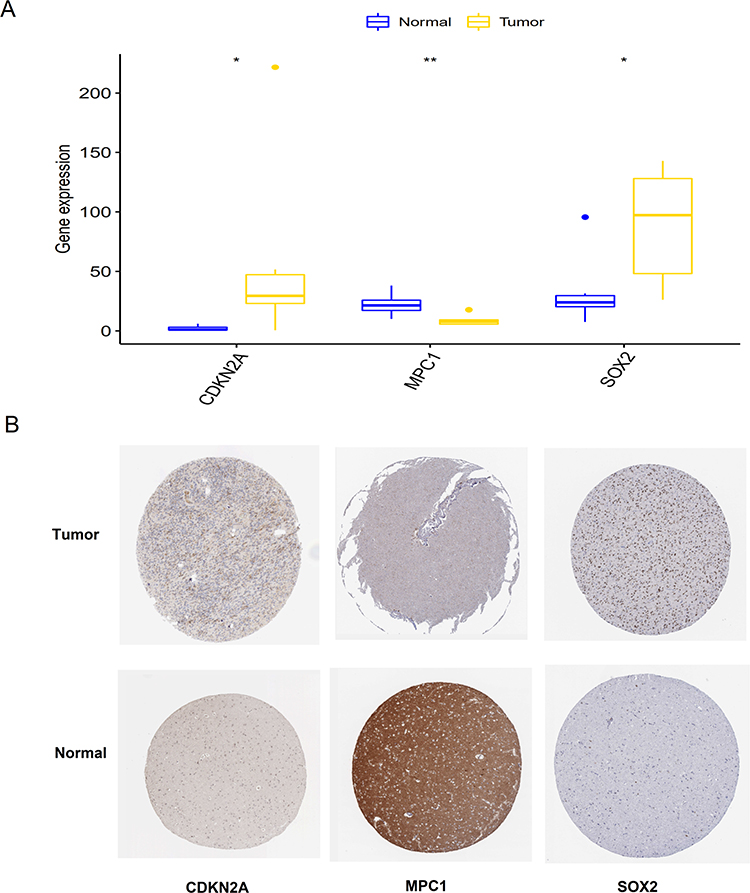 |
Figure 5 Experimental validation of three cuproptosis-related genes. (A) mRNA expression levels of the three genes in glioma tissues compared to adjacent normal tissues. (B) Immunohistochemical analysis of the three genes in normal and glioma tissues sourced from the Human Protein Atlas database. *, P < 0.05; **, P < 0.01. |
Discussion
Glioma is the most common primary brain tumor and exhibits the highest mortality rate in grade IV glioma – glioblastoma.3 Over the past decades, the prognosis for glioma patients has remained unsatisfactory. Unlike other malignancies, the TME of glioma is highly immunosuppressive, influenced by the characteristics of glial, neuronal, and immune cell populations in the brain.33,34 Therefore, a deeper understanding of the cellular components within the glioma TME is essential for identifying potential therapeutic targets for glioma patients. Cuproptosis is a recently identified copper induced cell death characterized by copper-dependent intracellular ROS production and excessive accumulation of lipid peroxides.19 Despite recent increase in the exploration of cuproptosis, a better understanding of cuproptosis in cellular heterogeneity within the TME is still needed. In this study, we comprehensively characterized the role of cuproptosis-related genes in the immune microenvironment of gliomas using single-cell transcriptome profiling and established a cuproptosis-related prognostic model for glioma.
Gliomas exhibit significant cellular and molecular heterogeneity within the TME.35 Illustrating tumor heterogeneity is crucial for the diagnosis and treatment of gliomas.36 Previously established prognostic models related to gliomas have typically relied on bulk RNA sequencing data,37,38 which reflects the average gene expression levels across entire cell populations. This approach dilutes the contributions of rare cell populations to the overall gene expression patterns39 and fails to precisely illustrate tumor heterogeneity and ignores tumor changes itself in the process of tumor development. Instead, scRNA-seq has proven to enhance our understanding of glioma heterogeneity and can more effectively depict alterations in cell expression patterns and cell-cell interactions.40,41 Here, we for the first time developed a cuproptosis-related prognostic model by integrating scRNA-seq and bulk mRNA sequencing data to clearly understand the heterogeneity of gliomas, which is critical for uncovering therapeutic targets for glioma patients.
In our in-house and CGGA scRNA-seq datasets, we identified nine distinct cell types that included astrocyte subpopulations. Astrocytes are the most abundant glial cells in the CNS and secrete a variety of immunomodulatory molecules, such as cytokines, chemokines, and metabolites, which play significant roles in inflammation and immune regulation.42,43 Heiland et al utilized single-cell sequencing data analysis to uncover heterogeneity in the functional responses of astrocyte subpopulations. Their findings suggest that astrocyte subpopulations that facilitate CNS repair and mitigate inflammation may also promote tumor growth and contribute to the generation of an immunosuppressive TME in GBM.12 Recent studies have explored the roles of astrocyte subpopulations in CNS malignancies and their potential as therapeutic targets.11,12,44 Similar to macrophages, these reports describe various subpopulations of astrocytes but do not delineate their specific functional roles. Consequently, we systematically identified cuproptosis-related genes in astrocyte-related subpopulations and analyzed their developmental trajectories and intercellular communications.
To further investigate the potential cell cross-talk that may contribute to the development and progression of gliomas, we conducted the analysis of intercellular communications using scRNA-seq. The complex correlations between astrocytes and immune cells shape the TME in gliomas. In the scRNA sequencing data analysis, astrocytes were the most abundant cell types in gliomas with higher relative strength in the TGFβ signaling pathway. The role of TGFβ in glioma biology is multi-dimensional. TGFβ can coordinate the interplay of glioma cell proliferation and migration, immunosuppression, and angiogenesis.45 TGFβ plays a crucial role in glioma evasion of host immune responses and can exert immunosuppressive effects on almost all infiltrating immune cells.46 Recent studies have shown that TGFβ is closely related to the oncogenic function of gliomas, TGFβ has high activity in GBM, which predicts poorer prognosis of patients.47,48 Gong et al also revealed that Cu chelator obviously suppresses the activation of TGFβ,49 indicating that cuproptosis may be correlated with the development of glioma by regulating the TGFβ signaling pathway.
Current evidence increasingly suggests that cuproptosis may serve as a novel therapeutic target for tumors. Recent studies have demonstrated that investigating cuproptosis in glioma could provide new insights into clinical treatment strategies.50,51 Bao et al identified and developed a model based on cuproptosis-related differentially expressed genes in low-grade glioma,38 which may represent a promising target for enhancing the efficacy of immunotherapy and cuproptosis treatment in gliomas. However, further research is necessary to determine whether cuproptosis-related genes along the trajectory of astrocyte progression are associated with the prognosis of gliomas. Therefore, we established a cuproptosis-related three-gene signature, comprising CDKN2A, SOX2, and MPC1, which demonstrates a better survival advantage in gliomas with low-risk scores compared to those with high-risk scores. Similar results were also observed in the TCGA testing set. Additionally, GSEA analysis revealed that high-risk gliomas were enriched in tumor signaling pathways, while low-risk gliomas were enriched in metabolic and immune networks. These findings indicate that cuproptosis is closely related to the progression of astrocytes in glioma and the efficacy of treatments. Our CRG-score signature may serve as a reliable indicator for accurately predicting the prognosis of glioma patients and could contribute to guiding personalized immunotherapy for gliomas.
Cyclin-dependent kinase inhibitor 2A (CDKN2A), recognized as a tumor suppressor, inhibits tumor cell proliferation and promotes apoptosis.52 Recent studies have demonstrated that CDKN2A is correlated with both ferroptosis53 and cuproptosis,19 which are characterized by regulated cell death resulting from the deterioration of antioxidant function and the accumulation of lipid ROS. A recent study reported that decreased CDKN2A expression significantly induces tumor recurrence and progression following immune checkpoint blockade therapy in patients with non-small cell lung cancer patients.54 Mitochondrial pyruvate carrier 1 (MPC1) is involved in the tumor metabolite and the process of biological synthesis.55 Previous study revealed that GBM patients with decreased MPC1 copy numbers segments were associated with poor prognosis and temozolomide resistance.56 In addition, Peter et al found that MPC1 gene is a critical mediator of elesclomol-copper ionophore-induced cell death,19 suggesting the potential role of MPC1 in the induction of cuproptosis in glioma. SOX2 is a known stem cell transcription factor and its upregulated expression is closely correlated with the development and progression of various cancers.57 The expression of SOX2 was mediated by the TGFβ signaling pathway, thereby inducing tumor cell self-renewal to prevent the differentiation of glioma-initiating cells.58 Moreover, a recent study indicates that SOX2 may be a potential biomarker to predict the sensitivity of cancer cells to ferroptosis, and its high expression can resistant to ferroptosis, which may largely attenuate the potential therapeutic efficacy by inducing ferroptosis.59 Similar to ferroptosis, oxidation of SOX2 in cuproptosis could be also a potential therapeutic target for cancer treatment. Previous studies have demonstrated these three genes play an important role in cuproptosis, which provides theoretical support for the reliability of our prognostic model and clinical treatments.
To the best of our knowledge, the present study is the first to systematically integrate single-cell RNA sequencing and bulk RNA sequencing to investigate the prognostic value of cuproptosis-related genes in astrocyte subpopulations within gliomas. Additionally, we comprehensively identify cell subsets and interactions among cells in the glioma TME in our in-house scRNA-seq data and the CGGA scRNA-seq dataset. Based on the similarity of pseudo-time-dependent trajectories of astrocyte subsets in gliomas and the time-dependent changes of cuproptosis-related genes, we developed and validated a novel cuproptosis-related prognostic risk model, which demonstrates significant predictive value. However, we acknowledge some potential limitations. Firstly, our prognostic model was constructed based on the CGGA dataset, which may introduce selection bias; nonetheless, we validated this model using TCGA dataset, confirming its reliability to a certain extent. Furthermore, our targeted mRNA sequencing also corroborates the involvement of these three genes. Secondly, our study is primarily descriptive, and experimental validation in vitro and in vivo of these genes is necessary to enhance our understanding of cuproptosis in gliomas in the future. Nevertheless, our study contributes to the understanding of cellular heterogeneity, intercellular communication, astrocyte subpopulations, and cuproptosis in gliomas.
Conclusion
In summary, we investigated the tumor microenvironment in gliomas and the characteristics of cuproptosis in astrocyte subsets using scRNA-seq data from three in-house glioma patients and 14 glioma patients from the CGGA dataset. We developed and validated a novel cuproptosis-related prognostic signature consisting of three genes (CDKN2A, SOX2, and MPC1) in a total of 1284 glioma patients from the CGGA and TCGA datasets. These results highlight that cuproptosis-related prognostic signature in unique astrocyte subpopulations for glioma patients, which may provide valuable insights for clinical decision-making and guide the development of appropriate therapeutic strategies.
Data Sharing Statement
The public datasets used to support the results of this study are available from TCGA database (https://portal.gdc.cancer.gov/repository) and the CGGA dataset (http://www.cgga.org.cn/). Raw sequencing data in this study are available in the Genome Sequence Archive (GSA) (https://ngdc.cncb.ac.cn/gsa-human/) of number PRJCA012424. The data generated during the current study is available from the corresponding author (Fulan Hu) on reasonable request.
Ethics Approval Statement
The study was ethically approved by the Institutional Ethics Committee of Harbin Medical University and was performed in accordance with the Declaration of Helsinki. Written informed consent was obtained from each patient.
Acknowledgments
We are indebted to all the patients who participated in present study.
Author Contributions
All authors read and approved the final manuscript. All authors made a significant contribution to the work reported, whether that is in the conception, study design, execution, acquisition of data, analysis and interpretation, or in all these areas; took part in drafting, revising or critically reviewing the article; gave final approval of the version to be published; have agreed on the journal to which the article has been submitted; and agree to be accountable for all aspects of the work.
Funding
This study was supported by the National Natural Science Foundation of China (Grant Number: 81773531); the Natural Science Foundation of Guangdong Province (Grant Number: 2021A1515012505); The Doctoral Research Initiation Fund Project of Zunyi Medical University(F-ZH-024); The Science and Technology Fund Project of Guizhou Provincial Health Commission (2025GZWJKJXM0321).
Disclosure
All the authors declared that there was no potential conflict of interest.
References
1. Ostrom QT, Price M, Neff C, et al. CBTRUS statistical report: primary brain and other central nervous system tumors diagnosed in the United States in 2016-2020. Neuro-Oncology. 2023;25:iv1–iv99. doi:10.1093/neuonc/noad149
2. Louis DN, Perry A, Wesseling P, et al. The 2021 WHO classification of tumors of the central nervous system: a summary. Neuro-Oncology. 2021;23(8):1231–1251. doi:10.1093/neuonc/noab106
3. Jiang T, Nam DH, Ram Z, et al. Clinical practice guidelines for the management of adult diffuse gliomas. Cancer Lett. 2021;499:60–72. doi:10.1016/j.canlet.2020.10.050
4. Mesfin FB, Al-Dhahir M. Gliomas. Treasure Island (FL): StatPearls Publishing LLC; 2024.
5. Hirtz A, Rech F, Dubois-Pot-Schneider H, et al. Astrocytoma: a hormone-sensitive tumor? Int J Mol Sci. 2020;22(1):21. doi:10.3390/ijms21239114
6. Klemm F, Maas RR, Bowman RL, et al. Interrogation of the microenvironmental landscape in brain tumors reveals disease-specific alterations of immune cells. Cell. 2020;181:1643–60.e17. doi:10.1016/j.cell.2020.05.007
7. Quail DF, Joyce JA. The microenvironmental landscape of brain tumors. Cancer Cell. 2017;31(3):326–341. doi:10.1016/j.ccell.2017.02.009
8. Maire CL, Mohme M, Bockmayr M, et al. Glioma escape signature and clonal development under immune pressure. J Clin Invest. 2020;130(10):5257–5271. doi:10.1172/jci138760
9. Paik PK, Shen R, Won H, et al. Next-generation sequencing of stage IV squamous cell lung cancers reveals an association of PI3K aberrations and evidence of clonal heterogeneity in patients with brain metastases. Cancer Discov. 2015;5(6):610–621. doi:10.1158/2159-8290.Cd-14-1129
10. Abbott NJ, Rönnbäck L, Hansson E. Astrocyte-endothelial interactions at the blood-brain barrier. Nat Rev Neurosci. 2006;7(1):41–53. doi:10.1038/nrn1824
11. Priego N, Zhu L, Monteiro C, et al. STAT3 labels a subpopulation of reactive astrocytes required for brain metastasis. Nat Med. 2018;24(7):1024–1035. doi:10.1038/s41591-018-0044-4
12. Henrik Heiland D, Ravi VM, Behringer SP, et al. Tumor-associated reactive astrocytes aid the evolution of immunosuppressive environment in glioblastoma. Nat Commun. 2019;10(1):2541. doi:10.1038/s41467-019-10493-6
13. Lopes MB, Vinga S. Tracking intratumoral heterogeneity in glioblastoma via regularized classification of single-cell RNA-Seq data. BMC Bioinf. 2020;21(1):59. doi:10.1186/s12859-020-3390-4
14. Valiente M, Obenauf AC, Jin X, et al. Serpins promote cancer cell survival and vascular co-option in brain metastasis. Cell. 2014;156(5):1002–1016. doi:10.1016/j.cell.2014.01.040
15. Mega A, Hartmark Nilsen M, Leiss LW, et al. Astrocytes enhance glioblastoma growth. Glia. 2020;68(2):316–327. doi:10.1002/glia.23718
16. Rose J, Brian C, Pappa A, et al. Mitochondrial metabolism in astrocytes regulates brain bioenergetics, neurotransmission and redox balance. Front Neurosci. 2020;14:536682. doi:10.3389/fnins.2020.536682
17. Nolfi-Donegan D, Braganza A, Shiva S. Mitochondrial electron transport chain: oxidative phosphorylation, oxidant production, and methods of measurement. Redox Biol. 2020;37:101674. doi:10.1016/j.redox.2020.101674
18. Park MW, Cha HW, Kim J, et al. NOX4 promotes ferroptosis of astrocytes by oxidative stress-induced lipid peroxidation via the impairment of mitochondrial metabolism in Alzheimer’s diseases. Redox Biol. 2021;41:101947. doi:10.1016/j.redox.2021.101947
19. Tsvetkov P, Coy S, Petrova B, et al. Copper induces cell death by targeting lipoylated TCA cycle proteins. Science. 2022;375(6586):1254–1261. doi:10.1126/science.abf0529
20. Denoyer D, Masaldan S, La Fontaine S, et al. Targeting copper in cancer therapy: ‘copper that cancer’. Metallomics. 2015;7(11):1459–1476. doi:10.1039/c5mt00149h
21. Chen X, Dou QP, Liu J, et al. Targeting ubiquitin-proteasome system with copper complexes for cancer therapy. Front Mol Biosci. 2021;8:649151. doi:10.3389/fmolb.2021.649151
22. Li Y. Copper homeostasis: emerging target for cancer treatment. IUBMB Life. 2020;72(9):1900–1908. doi:10.1002/iub.2341
23. Voli F, Valli E, Lerra L, et al. Intratumoral copper modulates pd-l1 expression and influences tumor immune evasion. Cancer Res. 2020;80(19):4129–4144. doi:10.1158/0008-5472.Can-20-0471
24. Zhou B, Guo L, Zhang B, et al. Disulfiram combined with copper induces immunosuppression via PD-L1 stabilization in hepatocellular carcinoma. Am J Cancer Res. 2019;9(11):2442–2455.
25. Kahlson MA, Dixon SJ. Copper-induced cell death. Science. 2022;375(6586):1231–1232. doi:10.1126/science.abo3959
26. Gieryng A, Pszczolkowska D, Walentynowicz KA, et al. Immune microenvironment of gliomas. Lab Invest. 2017;97(5):498–518. doi:10.1038/labinvest.2017.19
27. Zhao Z, Zhang KN, Wang Q, et al. Chinese Glioma Genome Atlas (CGGA): a comprehensive resource with functional genomic data from Chinese glioma patients. Genom Proteom Bioinform. 2021;19(1):1–12. doi:10.1016/j.gpb.2020.10.005
28. Dong B, Miao J, Wang Y, et al. Single-cell analysis supports a luminal-neuroendocrine transdifferentiation in human prostate cancer. Commun Biol. 2020;3(1):778. doi:10.1038/s42003-020-01476-1
29. He MX, Cuoco MS, Crowdis J, et al. Transcriptional mediators of treatment resistance in lethal prostate cancer. Nat Med. 2021;27(3):426–433. doi:10.1038/s41591-021-01244-6
30. Karthaus WR, Hofree M, Choi D, et al. Regenerative potential of prostate luminal cells revealed by single-cell analysis. Science. 2020;368(6490):497–505. doi:10.1126/science.aay0267
31. Jin S, Guerrero-Juarez CF, Zhang L, et al. Inference and analysis of cell-cell communication using CellChat. Nat Commun. 2021;12(1):1088. doi:10.1038/s41467-021-21246-9
32. Qiu X, Mao Q, Tang Y, et al. Reversed graph embedding resolves complex single-cell trajectories. Nat Methods. 2017;14(10):979–982. doi:10.1038/nmeth.4402
33. Andersen BM, Faust Akl C, Wheeler MA, et al. Glial and myeloid heterogeneity in the brain tumour microenvironment. Nat Rev Cancer. 2021;21(12):786–802. doi:10.1038/s41568-021-00397-3
34. Du Y, Li R, Fu D, et al. Multi-omics technologies and molecular biomarkers in brain tumor-related epilepsy. CNS Neurosci Ther. 2024;30:e14717. doi:10.1111/cns.14717
35. Kim EL, Sorokin M, Kantelhardt SR, et al. Intratumoral heterogeneity and longitudinal changes in gene expression predict differential drug sensitivity in newly diagnosed and recurrent glioblastoma. Cancers. 2020;13(1):12. doi:10.3390/cancers12020520
36. McGranahan N, Swanton C. Biological and therapeutic impact of intratumor heterogeneity in cancer evolution. Cancer Cell. 2015;27(1):15–26. doi:10.1016/j.ccell.2014.12.001
37. Ba Y, Su J, Gao S, et al. The identification of necroptosis-related subtypes, the construction of a prognostic model, and the characterization of the tumor microenvironment in gliomas. Front Oncol. 2022;12:899443. doi:10.3389/fonc.2022.899443
38. Bao JH, Lu WC, Duan H, et al. Identification of a novel cuproptosis-related gene signature and integrative analyses in patients with lower-grade gliomas. Front Immunol. 2022;13:933973. doi:10.3389/fimmu.2022.933973
39. Nguyen A, Khoo WH, Moran I, et al. Single cell RNA sequencing of rare immune cell populations. Front Immunol. 2018;9:1553. doi:10.3389/fimmu.2018.01553
40. Zhao J, Chen AX, Gartrell RD, et al. Immune and genomic correlates of response to anti-PD-1 immunotherapy in glioblastoma. Nat Med. 2019;25(3):462–469. doi:10.1038/s41591-019-0349-y
41. Lee JK, Wang J, Sa JK, et al. Spatiotemporal genomic architecture informs precision oncology in glioblastoma. Nat Genet. 2017;49:594–599. doi:10.1038/ng.3806
42. Mayo L, Trauger SA, Blain M, et al. Regulation of astrocyte activation by glycolipids drives chronic CNS inflammation. Nat Med. 2014;20(10):1147–1156. doi:10.1038/nm.3681
43. Rothhammer V, Borucki DM, Tjon EC, et al. Microglial control of astrocytes in response to microbial metabolites. Nature. 2018;557(7707):724–728. doi:10.1038/s41586-018-0119-x
44. Gril B, Paranjape AN, Woditschka S, et al. Reactive astrocytic S1P3 signaling modulates the blood-tumor barrier in brain metastases. Nat Commun. 2018;9(1):2705. doi:10.1038/s41467-018-05030-w
45. Yang L, Zhang S, Wang G. Keratin 17 in disease pathogenesis: from cancer to dermatoses. J Pathol. 2019;247(2):158–165. doi:10.1002/path.5178
46. Cui X, Morales RT, Qian W, et al. Hacking macrophage-associated immunosuppression for regulating glioblastoma angiogenesis. Biomaterials. 2018;161:164–178. doi:10.1016/j.biomaterials.2018.01.053
47. Joseph JV, Balasubramaniyan V, Walenkamp A, et al. TGF-β as a therapeutic target in high grade gliomas - promises and challenges. Biochem Pharmacol. 2013;85(4):478–485. doi:10.1016/j.bcp.2012.11.005
48. Wang J, Cazzato E, Ladewig E, et al. Clonal evolution of glioblastoma under therapy. Nature Genet. 2016;48(7):768–776. doi:10.1038/ng.3590
49. Gong D, Lu J, Chen X, et al. A copper(II)-selective chelator ameliorates diabetes-evoked renal fibrosis and albuminuria, and suppresses pathogenic TGF-beta activation in the kidneys of rats used as a model of diabetes. Diabetologia. 2008;51(9):1741–1751. doi:10.1007/s00125-008-1088-7
50. Zhang Z, Zeng X, Wu Y, et al. Cuproptosis-related risk score predicts prognosis and characterizes the tumor microenvironment in hepatocellular carcinoma. Front Immunol. 2022;13:925618. doi:10.3389/fimmu.2022.925618
51. Jiang R, Huan Y, Li Y, et al. Transcriptional and genetic alterations of cuproptosis-related genes correlated to malignancy and immune-infiltrate of esophageal carcinoma. Cell Death Discov. 2022;8(1):370. doi:10.1038/s41420-022-01164-5
52. Luan Y, Zhang W, Xie J, et al. CDKN2A inhibits cell proliferation and invasion in cervical cancer through LDHA-mediated AKT/mTOR pathway. Clin Transl Oncol. 2021;23(2):222–228. doi:10.1007/s12094-020-02409-4
53. Shi J, Wu P, Sheng L, et al. Ferroptosis-related gene signature predicts the prognosis of papillary thyroid carcinoma. Cancer Cell Int. 2021;21(1):669. doi:10.1186/s12935-021-02389-7
54. Gutiontov SI, Turchan WT, Spurr LF, et al. CDKN2A loss-of-function predicts immunotherapy resistance in non-small cell lung cancer. Sci Rep. 2021;11(1):20059. doi:10.1038/s41598-021-99524-1
55. Karsy M, Guan J, Huang LE. Prognostic role of mitochondrial pyruvate carrier in isocitrate dehydrogenase-mutant glioma. J Neurosurg. 2018;130:56–66. doi:10.3171/2017.9.Jns172036
56. Chai Y, Wang C, Liu W, et al. MPC1 deletion is associated with poor prognosis and temozolomide resistance in glioblastoma. J Neurooncol. 2019;144(2):293–301. doi:10.1007/s11060-019-03226-8
57. Zhang S, Xiong X, Sun Y. Functional characterization of SOX2 as an anticancer target. Signal Transduct Target Ther. 2020;5(1):135. doi:10.1038/s41392-020-00242-3
58. Ikushima H, Todo T, Ino Y, et al. Autocrine TGF-beta signaling maintains tumorigenicity of glioma-initiating cells through Sry-related HMG-box factors. Cell Stem Cell. 2009;5(5):504–514. doi:10.1016/j.stem.2009.08.018
59. Wang X, Chen Y, Wang X, et al. Stem cell factor SOX2 confers ferroptosis resistance in lung cancer via upregulation of SLC7A11. Cancer Res. 2021;81(20):5217–5229. doi:10.1158/0008-5472.Can-21-0567
 © 2024 The Author(s). This work is published and licensed by Dove Medical Press Limited. The
full terms of this license are available at https://www.dovepress.com/terms.php
and incorporate the Creative Commons Attribution
- Non Commercial (unported, 3.0) License.
By accessing the work you hereby accept the Terms. Non-commercial uses of the work are permitted
without any further permission from Dove Medical Press Limited, provided the work is properly
attributed. For permission for commercial use of this work, please see paragraphs 4.2 and 5 of our Terms.
© 2024 The Author(s). This work is published and licensed by Dove Medical Press Limited. The
full terms of this license are available at https://www.dovepress.com/terms.php
and incorporate the Creative Commons Attribution
- Non Commercial (unported, 3.0) License.
By accessing the work you hereby accept the Terms. Non-commercial uses of the work are permitted
without any further permission from Dove Medical Press Limited, provided the work is properly
attributed. For permission for commercial use of this work, please see paragraphs 4.2 and 5 of our Terms.