")
Back to Journals » Clinical Ophthalmology » Volume 18
Association Between Particulate Matter Pollutants and Ophthalmology Visits for Ocular Surface Irritation and Allergy
Authors Patnaik JL , Dye-Robinson A, James KA, Kahook MY
Received 10 August 2024
Accepted for publication 31 October 2024
Published 13 November 2024 Volume 2024:18 Pages 3263—3270
DOI https://doi.org/10.2147/OPTH.S485199
Checked for plagiarism Yes
Review by Single anonymous peer review
Peer reviewer comments 2
Editor who approved publication: Dr Scott Fraser
Jennifer L Patnaik,1 Amy Dye-Robinson,2,3 Katherine A James,2 Malik Y Kahook1
1Department of Ophthalmology, University of Colorado School of Medicine, Aurora, CO, USA; 2Department of Environmental and Occupational Health, Colorado School of Public Health, Aurora, CO, USA; 3Department of Biostatistics and Informatics, Colorado School of Public Health, Aurora, CO, USA
Correspondence: Jennifer L Patnaik, Department of Ophthalmology, University of Colorado School of Medicine, Mail Stop F731, 1675 Aurora Court, Aurora, CO, 80045, USA, Tel +1 303 396 3284, Fax +1 720 848 5014, Email [email protected]
Background: The World Health Organization has declared climate change to be “the single biggest health threat facing humanity”, yet there are limited studies on the impact of climate change-related air pollution on ocular health.
Objective: To explore associations between ocular surface irritation and allergy-related daily outpatient office visits with daily ambient particulate matter (PM) levels in the Denver Metropolitan Area.
Methods: Daily visit counts of ophthalmology outpatient offices were obtained from an academic health center (October 1st, 2015 to January 27th, 2023). Daily ambient average concentrations of PM ≤ 10 μm in diameter (PM10) and 2.5 micrometers or less in diameter (PM2.5) were obtained. Data were analyzed using distributed lag nonlinear models while accounting for the cumulative lagged effects of PM10 and PM2.5 for visits. Modifications due to temperature were assessed using stratified models.
Results: There were 144,313 ocular surface irritation and allergy visits to ophthalmic clinics during the study period. Daily visit counts increased with increasing daily ambient PM10 and PM2.5 concentrations. Five-day cumulative ambient PM10 concentrations at 80, 90, 100, and 110 μg/m3 showed higher rate ratios at each level from 1.77 (95% CI: 1.71, 1.84) at concentration of 80 to 2.20 (95% CI: 2.09, 2.30) for concentration of 110 μg/m3. Similarly, the visit rate ratios increased as the daily PM2.5 concentration increased, but this gradient effect was not significantly higher as the concentration increased. The effect of PM10 was higher on days when the temperature was below the average. Temperature did not affect the association between daily visit counts and PM2.5.
Conclusion: This study found that ambient PM increased the rate of ophthalmology visits due to ocular surface irritation and allergies. Most importantly, this association increased in magnitude with higher ambient PM concentrations. Additional studies are required to fully understand the effects of climate change-related stressors on ocular health.
Plain Language Summary: This study explored the associations between ocular surface irritation and allergy-related daily outpatient office visits with daily ambient particulate matter (PM) levels in the Denver Metropolitan Area. Daily visit counts for ophthalmology outpatient offices were obtained from an academic health center. Daily ambient average concentrations of PM ≤ 10 μm in diameter (PM10) and 2.5 micrometers or less in diameter (PM2.5) were obtained. There were 144,313 ocular surface irritation and allergy visits to ophthalmic clinics during the study period. Daily visit counts increased significantly with increasing daily ambient PM10 and PM2.5 concentrations, and this association increased in magnitude with higher ambient PM concentrations. Additional studies are required to fully understand the effects of climate change-related stressors on ocular health.
Keywords: particulate matter, ocular surface irritation and allergy
Introduction
Climate change and air pollution have been shown to affect human health and disease through a variety of mechanisms. Importantly, the World Health Organization has declared climate change as “the single biggest health threat to humanity”. 1 The health risks from climate change span a broad range of outcomes, including communicable and non-communicable diseases, extreme weather event-related morbidity and mortality, impact on water and food sources, mental and psychosocial health, and widening of health disparities.2–6 The effects of climate and air pollution on chronic diseases such as cardiovascular and renal diseases, lung health, and asthma have been well established.7,8 Less studied chronic diseases such as dementia have also been shown to be associated with temperature and air pollutants.9–11 Research on the topic of ocular conditions and climate is still in its early stages; therefore, more studies are needed to better understand how climate and air pollutants impact eye health.12
Eyes are unique organs that are directly exposed to the environment and are thereby affected by changes in indoor and outdoor elements. The climate can affect the eyes in various ways. In a large survey in the United States, higher temperatures have been associated with higher rates of severe visual impairment.13 Ultraviolet exposure caused by ozone depletion can impact eye health. The National Eye Institute estimates that approximately 20% of cataracts are caused by ultraviolet radiation overexposure.14 Air pollutants such as nitric oxide, sulfur dioxide, and particulate matter (PM) can cause itching, redness, swelling and blurred vision.15 In addition, temperature, humidity, wind, and dust can contribute to eye irritation.16,17 These environmental elements can also disrupt the tear film and lead to chronic ocular surface diseases such as dry eyes.18,19
Three recent reviews of the literature on air pollution and climate for several different types of eye diseases identified scant publications.20–22 Another systematic review determined that the eye is the least studied organ with regard to its association with air pollution.23 Most of the published studies on this topic have determined that climate change adversely affects various ophthalmic conditions, with ocular surface disease (eg, conjunctivitis and dry eye disease (DED)) being both the most studied and the most affected.20,22 Ocular surface irritation and conjunctivitis occur when the eyes react to an allergen or similar irritants that cause the eyelids and conjunctiva to become red, swollen, itchy, or dry, and can cause tearing or burning. DED is a common condition that occurs when tears are unable to provide adequate lubrication, leading to inflammation and damage to the eye surface. These ocular conditions often lead to discomfort and potential visual impairment in affected individuals.
The primary purpose of the present study was to assess the associations between the frequency of ocular surface and eye irritation/allergy visits to an academic ophthalmology clinic in the presence of PM in the surrounding community. Specifically, the primary exposures of interest were PM 10 micrometers or less diameter (PM10) and PM 2.5 micrometers or less diameter (PM2.5) pollutants with temperature as a potential effect modifier of this association.
Methods
Study Population and Pollutant Data
This study was deemed exempt by the Colorado Multiple Institutional Review Board and consent from study participants was not required (COMIRB# 23–0143) since data regarding patient visits to ophthalmology did not contain identifying information. The guidelines in the Declaration of Helsinki were followed. In order to explore the relationship between PM and eye health, we examined the frequency of visits to an ophthalmology clinic at the University of Colorado Sue-Anschutz Eye Center. For the analysis involving PM10 we looked at visits by adults over the age of 18 years between October 1st, 2015, and January 27th, 2023. For the analysis involving PM2.5, we looked at adult visits between October 1st,2015 and December 31st 2020, due to missing PM2.5 data. The ophthalmology encounter data were obtained from the billing department of the University of Colorado. Ocular surface irritation and allergy visits were defined as outpatient visits, and the specific International Classification of Disease, 10th revision (ICD-10) codes are listed in Table 1. To correct for individual overutilization of the clinic, any records that represented over three visits per year per individual were removed from the study.
 |
Table 1 International Classification of Disease (ICD) Codes, Descriptions and Number of Visits During the Study Period |
Daily ambient average concentration of PM was obtained from the Environmental Protection Agency (EPA) and included measures for PM10 and PM2.5.24 The EPA aggregates air monitoring data for PM from state, tribal, and other local government agencies. The Colorado Department of Public Health and Environment leads air monitoring in Colorado. Details about monitoring sites, data logging, data quality assurance, and data accessibility can be found in their technical report.25 Daily maximum temperature and daily average humidity were obtained from Open-Meteo and examined as potential effect modifiers of the primary association.26
Statistical Analysis
Particulate matter and ophthalmology visit data were merged by date. Data were analyzed with distributed lag non-linear models to model the relationship between PM and daily visit counts, while accounting for the cumulative lagged effects of PM10 and PM2.5. Fitting a distributed lag nonlinear model involves the creation of a crossbasis, which is a base that combines initial exposure and lagged exposure. The cross basis can then be used as a predictor in a normal regression model. The cross-basis included a linear structure on the exposure and a polynomial structure on the lags and included a maximum of five lags. The crossbasis was then used in a Poisson generalized linear model. Rate ratios and confidence intervals from the generalized linear model are presented by concentration of PM. PM10 concentrations were 80, 90, 100, and 110 µg/m3 and the PM2.5 concentrations were 15, 20, and 25 µg/m3. To explore the potential effect modification of temperature, the data were stratified by being equal to or above the average temperature and below the average temperature.
Results
There were a total of 144,313 ocular surface irritation and allergy visits to the academic ophthalmology clinic during the study period, with an average of 54 visits per day (range, 0–203). The most common ICD code was dry eye syndrome (67,510 visits) followed by conjunctivitis (47,093 visits). All included ICD codes and the number of visits are presented in Table 1. Median daily ambient PM10 and PM2.5 concentrations were 24.69 µg/m3 (inter-quartile range (IQR): 16.00, 35.96) and 6.44 µg/m3 (IQR: 4.85, 8.88), respectively.
Daily visit counts increased with increasing daily ambient PM10 and PM2.5 concentrations. Five-day cumulative ambient PM10 concentrations at 80, 90, 100, and 110 µg/m3 showed higher rate ratios at each level from 1.77 (95% CI: 1.71, 1.84) at concentration of 80 to 2.20 (95% CI: 2.09, 2.30) for concentration of 110 µg/m3 (Figure 1 and Table 2). Therefore, ophthalmology visits for ocular surface and allergy were 2.2 times higher than the average number of visits when PM10 concentrations were 110 µg/m3, accounting for a five-day lag period. Similarly, the visit rate ratio increased as daily PM2.5 concentration increased at each level with 1.10 (95% CI: 1.07, 1.13) at concentration of 15 µg/m3 to 1.17 (95% CI: 1.12, 1.23) at concentration of 25 µg/m3 (Figure 2 and Table 3). Although the rate ratios for each concentration significantly increased for PM2.5, the gradient effect was not significantly higher as the concentration increased for PM2.5 as was observed for PM10. The effect of PM10 was greater on days when the temperature was below average than on days when the temperature was above average (Table 2). Temperature did not significantly affect the association between PM2.5 and the number of visits (Table 3).
 |
Table 2 Rate Ratios of Daily Visits at Lag Day 5 for Daily Average PM10 Concentrations for All Days, Days Below Average Temperature and Days Above Average Temperature |
 |
Table 3 Rate Ratios of Daily Visits at Lag Day 5 for Daily Average PM2.5 Concentrations for All Days, Days Below Average Temperature and Days Above Average Temperature |
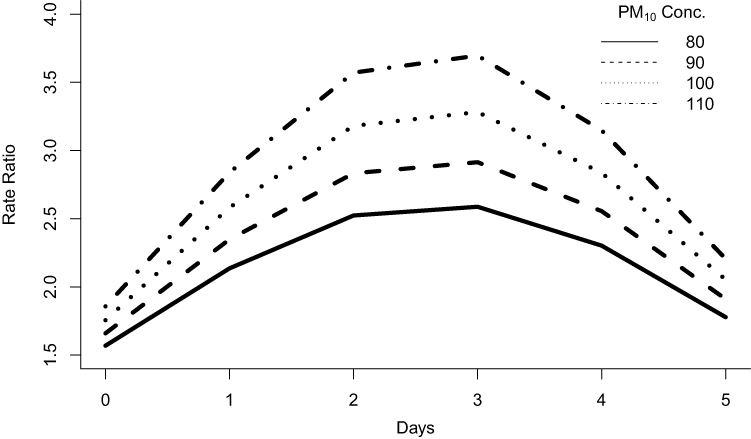 |
Figure 1 Cumulative effect of PM10 on irritation and allergy ophthalmology visits. The x-axis represents the lag time from particulate matter exposure. The y-axis is the rate ratio of ophthalmology visits. Each line represents various concentrations of PM10 as indicated in the legend. |
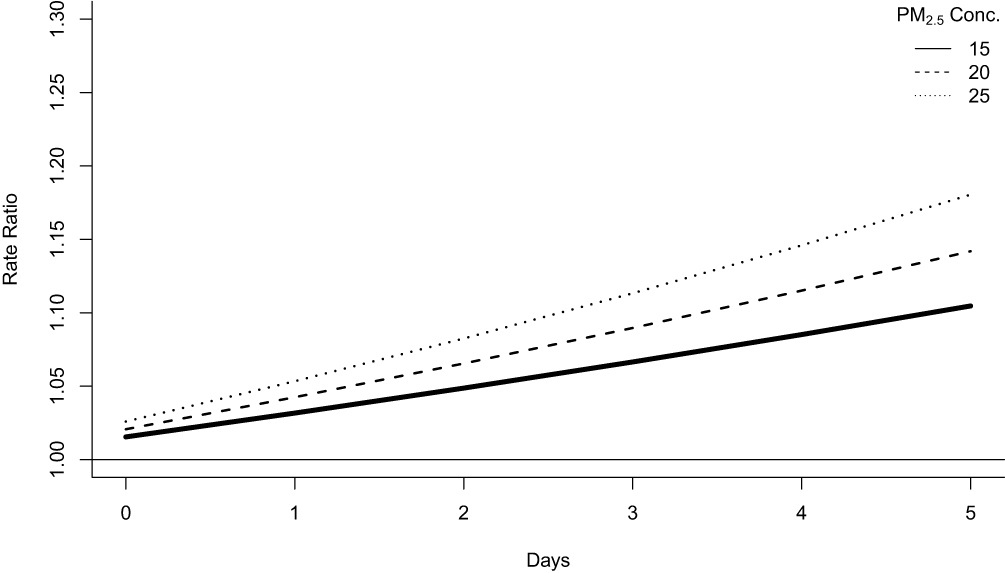 |
Figure 2 Cumulative effect of PM2.5 on irritation and allergy ophthalmology visits. The x-axis represents the lag time from particulate matter exposure. The y-axis is the rate ratio of ophthalmology visits. Each line represents various concentrations of PM2.5 as indicated in the legend. |
Discussion
In this study, we demonstrated that ambient PM concentrations increased the rate of visits to an ophthalmology clinic for ocular surface irritation and allergy in a major metropolitan area in the United States. The magnitude of this association increased significantly as the pollutant concentration for PM10 increased, and the magnitude of the association with PM2.5 increased as the concentration increased, but this gradient increase was not significant across concentration levels. When stratified by above- and below-average temperatures, the rate ratios of the number of clinic visits were higher when the temperature was below average for PM10, but not for PM2.5. In addition, these data indicate that health consequences of ocular disease can occur below the Environmental Protection Agency’s established maximum containment levels of 150 µg/m3 for PM10 and 35 µg/m3 for PM2.5.27
Dry eye disease (DED) is one of the most prevalent ophthalmic diseases in the United States and the most common diagnostic code among clinic visits during the study period, accounting for 47% of all visits. DED is a growing public health concern that interferes with quality of life and vision.28 A recently published meta-analysis estimated the prevalence of DED in the United States to be 8.1% (95% CI: 4.9–13.1%), with an incidence among adults of 3.5%.29 Variation by region and sex has been reported,30,31 and prevalence rates may be higher in Colorado due to the dry climate. Similar to our study, two prior studies in China demonstrated associations between adult and pediatric outpatients visits for DED and pollutants PM10 and PM2.5,32,33 In contrast, a study in South Korea found no association between PM10 and DED when looking at self-reported DED and annual average of pollutants by region.34 A small study (n=43) of patients with DED found ambient PM10, PM2.5 and ozone were correlated with worsening DED clinical measures in South Korea,35 however another study in the United States did not find associations between clinical measures of DED and PM2.5.31 A study of self-reported DED among women in Taiwan found higher prevalence rates of DED were associate with PM2.5, and also that DED prevalence rates were associated with higher temperatures and lower humidity, however, after adjustment for individual risk factors of hormone supplements, arthritis and allergy, DED remained associated with higher temperature, but not PM2.5.36
Conjunctivitis was the second most common eye disease among the clinic visits in our study, representing exactly one-third of all the visits. Prevalence rates of ocular allergic conjunctivitis have increased worldwide and vary across regions.37 Socioeconomic and environmental factors such as temperature, humidity, and air pollution have been proposed as contributors to these regional variations.37,38 Several previously published studies in Taiwan, Singapore, and China have found that PM10 and PM2.5 (but not PM2.5 in the Taiwan study) were associated with outpatient visits for nonspecific and acute conjunctivitis.39–43 Nucci et al conducted a small study of 132 pediatric visits for conjunctivitis of unknown origin in Milan, Italy, and found that they were associated with PM10 concentrations, but not PM2.5.44 Another case-crossover study in Taiwan found that both PM2.5 and PM10 were associated with allergic conjunctivitis in univariate, but not multivariable analysis, and a significant association was found between temperature and allergic conjunctivitis in the multivariable model.45
Our time-series study has several limitations, including its study design and the inherent weakness of unmeasured confounders, potentially impacting our findings. Clinical visits from only one institution were included in the analyses, and diagnoses for ocular surface irritation and allergy were combined, which are somewhat heterogeneous in their etiologies. One of the strengths of this study is that the time period was over seven years for PM10 analyses and over five years for PM2.5, which allows many days to be included in the model. However, both pollutant analyses included 2020 data, during which clinics operated at low patient volume levels due to the COVID pandemic. This was a short period compared to the entirety of the study and likely had minimal to no impact on the observed associations. Other pollutants such as O3, NO2, SO2, and CO were not available at the same level of granularity and, therefore, not included in the current paper, but are of interest for future research.
The major strength of this study is that we had sufficient variability in PM concentrations to evaluate whether there was a gradient effect of pollutants on patient visits, specifically for PM10. This type of association is important in epidemiological studies and provides evidence supporting an association between PM and ocular diseases. Other strengths of the study include the complex statistical methods incorporating a lag effect of five days, which allows time for patients to seek care for their ocular condition. In addition, stratification by temperature demonstrated the importance of climate factors in the association between air pollution and ophthalmology visits for ocular surface and allergy visits.
Conclusion
Visual health is a significant determinant of quality of life. The effects of climate and air pollution on most ocular diseases have been understudied; however, the importance of visual health is critical to the overall well-being of individuals. The results of this study from one academic clinic demonstrated an association between the air pollutants PM10 and PM2.5 on visits specifically for ocular surface irritation and allergy in the Denver Metropolitan Area. This association increased in magnitude with higher ambient PM concentrations. When stratified by above- and below-average temperatures, the rate ratios of the number of clinic visits were higher when the temperature was below average for PM10, but not for PM2.5. Additional research in this field is needed, with the incorporation of more pollutant types, larger population sizes, and broader geographic areas.
Institution Where the Study Was Performed
University of Colorado Sue Anschutz-Rodgers Eye Center at the University of Colorado, School of Medicine.
Funding
Support from a grant to the Department of Ophthalmology at University of Colorado from the Research to Prevent Blindness.
Disclosure
The findings of this paper were presented at the 2024 Association for Research and Vision and Ophthalmology (ARVO) conference in Seattle, Washington as a podium presentation in April 2024. The presentation’s abstract was published in the ARVO Annual Meeting Abstracts: Are particulate matter pollutants associated with ophthalmology visits for ocular surface irritation and allergy? | IOVS | ARVO Journals.
None of the authors has any proprietary interests or conflicts of interest related to this submission.
References
1. WHO. Climate change and noncommunicable diseases: connections. [
2. Rose JB, Epstein PR, Lipp EK, Sherman BH, Bernard SM, Patz JA. Climate variability and change in the United States: potential impacts on water- and foodborne diseases caused by microbiologic agents. Environ Health Perspect. 2001;109(Suppl 2):211–221. doi:10.1289/ehp.01109s2211
3. Mills NL, Donaldson K, Hadoke PW, et al. Adverse cardiovascular effects of air pollution. Nat Clin Pract Cardiovasc Med. 2009;6(1):36–44. doi:10.1038/ncpcardio1399
4. Cianconi P, Betro S, Janiri L. The impact of climate change on mental health: a systematic descriptive review. Front Psychiatry. 2020;11:74. doi:10.3389/fpsyt.2020.00074
5. Hunter PR. Climate change and waterborne and vector-borne disease. J Appl Microbiol. 2003;94:37S–46S. doi:10.1046/j.1365-2672.94.s1.5.x
6. Lake IR, Gillespie IA, Bentham G, et al. A re-evaluation of the impact of temperature and climate change on foodborne illness. Epidemiol Infect. 2009;137(11):1538–1547. doi:10.1017/S0950268809002477
7. James KA, Strand M, Hamer MK, Cicutto L. Health services utilization in asthma exacerbations and PM(10) levels in rural Colorado. Ann Am Thorac Soc. 2018;15(8):947–954. doi:10.1513/AnnalsATS.201804-273OC
8. Baraghoshi D, Niswander C, Strand M, et al. Exacerbation of renal, cardiovascular, and respiratory outcomes associated with changes in climate. Yale J Biol Med. 2023;96(2):159–169. doi:10.59249/KYDF6093
9. Zhang B, Weuve J, Langa KM, et al. Comparison of particulate air pollution from different emission sources and incident dementia in the US. JAMA Intern Med. 2023;183(10):1080–1089. doi:10.1001/jamainternmed.2023.3300
10. Peters R, Mudway I, Booth A, Peters J, Anstey KJ. Putting fine particulate matter and dementia in the wider context of noncommunicable disease: where are we now and what should we do next: a systematic review. Neuroepidemiology. 2021;55(4):253–265. doi:10.1159/000515394
11. Cheng S, Jin Y, Dou Y, et al. Long-term particulate matter 2.5 exposure and dementia: a systematic review and meta-analysis. Public Health. 2022;212:33–41. doi:10.1016/j.puhe.2022.08.006
12. Roth M, Herrmann ME, Geerling G, Guthoff R. Aktuelle und zukunftige Auswirkungen des Klimawandels auf die Augenheilkunde [Current and future effects of climate change on ophthalmology]. Ophthalmologie. 2022;119(6):552–560. doi:10.1007/s00347-022-01594-7
13. Fuller-Thomson E, Deng Z, Fuller-Thomson EG. Association between area temperature and severe vision impairment in a nationally representative sample of older Americans. Ophthalmic Epidemiol. 2023;1–8. doi:10.1080/09286586.2023.2221727
14. National Eye Institute. Available from: https://spectrumlocalnews.com/healthy-living/2017/06/20/the-national-eye-institute-says-20--of-cases-involving-cataracts-are-from-extended-uv-exposure.
15. Gupta SK, Gupta SC, Agarwal R, Sushma S, Agrawal SS, Saxena R. A multicentric case-control study on the impact of air pollution on eyes in a metropolitan city of India. Indian J Occup Environ Med. 2007;11(1):37–40. doi:10.4103/0019-5278.32463
16. Das AV, Basu S. Environmental and air pollution factors affecting allergic eye disease in children and adolescents in India. Int J Environ Res Public Health. 2021;18(11):5611. doi:10.3390/ijerph18115611
17. Alves M, Asbell P, Dogru M, et al. TFOS lifestyle report: impact of environmental conditions on the ocular surface. Ocul Surf. 2023;29:1–52. doi:10.1016/j.jtos.2023.04.007
18. Patel S, Mittal R, Kumar N, Galor A. The environment and dry eye-manifestations, mechanisms, and more. Front Toxicol. 2023;5:1173683. doi:10.3389/ftox.2023.1173683
19. Mandell JT, Idarraga M, Kumar N, Galor A. Impact of air pollution and weather on dry eye. J Clin Med. 2020;9(11):3740. doi:10.3390/jcm9113740
20. Alryalat SA, Toubasi AA, Patnaik JL, Kahook MY. The impact of air pollution and climate change on eye health: a global review. Rev Environ Health. 2022. doi:10.1515/reveh-2022-0209
21. Lin CC, Chiu CC, Lee PY, et al. The adverse effects of air pollution on the eye: a review. Int J Environ Res Public Health. 2022;19(3). doi:10.3390/ijerph19031186
22. Wong YL, Wong SW, Ting DSJ, et al. Impacts of climate change on ocular health: a scoping review. J Climate Change Health. 2024;15.
23. Muruganandam N, Mahalingam S, Narayanan R, Rajadurai E. Meandered and muddled: a systematic review on the impact of air pollution on ocular health. Environ Sci Pollut Res Int. 2023;30(24):64872–64890. doi:10.1007/s11356-023-27079-x
24. Environmental Protection Agency. Air data: air quality data collected at outdoor monitors across the US. Available from: https://www.epa.gov/outdoor-air-quality-data.
25. Technical reports and journal articles on air sensor technology. Available from: https://nam02.safelinks.protection.outlook.com/?url=https%3A%2F%2Fwww.colorado.gov%2Fairquality%2Ftech_doc_repository.aspx%23particulate_matter_tsd_denver&data=05%7C02%7CJENNIFER.PATNAIK%40CUANSCHUTZ.EDU%7C9b5c06000bb44402b21508dcf1e4facb%7C563337caa517421aaae01aa5b414fd7f%7C0%7C0%7C638651212965407071%7CUnknown%7CTWFpbGZsb3d8eyJWIjoiMC4wLjAwMDAiLCJQIjoiV2luMzIiLCJBTiI6Ik1haWwiLCJXVCI6Mn0%3D%7C0%7C%7C%7C&sdata=LAZM0IVBASE13q2hlJchl3QNSLBMX2zQPZVxncrgRU8%3D&reserved=0.
26. Open-Meteo. Historical weather API. Available from: https://open-meteo.com/en/docs/historical-weather-api#latitude=39.87&longitude=−104.97&hourly=relativehumidity_2m&daily=temperature_2m_max,temperature_2m_min,temperature_2m_mean,precipitation_sum,windspeed_10m_max,windgusts_10m_max,winddirection_10m_domi.
27. Environmental Protection Agency. National ambient air quality standards table. Environmental Protection Agency. [
28. Uchino M, Schaumberg DA. Dry eye disease: impact on quality of life and vision. Curr Ophthalmol Rep. 2013;1(2):51–57. doi:10.1007/s40135-013-0009-1
29. McCann P, Abraham AG, Mukhopadhyay A, et al. Prevalence and incidence of dry eye and meibomian gland dysfunction in the United States: a systematic review and meta-analysis. JAMA Ophthalmol. 2022;140(12):1181–1192. doi:10.1001/jamaophthalmol.2022.4394
30. Vehof J, Snieder H, Jansonius N, Hammond CJ. Prevalence and risk factors of dry eye in 79,866 participants of the population-based lifelines cohort study in the Netherlands. Ocul Surf. 2021;19:83–93. doi:10.1016/j.jtos.2020.04.005
31. Berg EJ, Ying GS, Maguire MG, et al. Climatic and environmental correlates of dry eye disease severity: a report from the dry eye assessment and management (DREAM) study. Transl Vis Sci Technol. 2020;9(5):25. doi:10.1167/tvst.9.5.25
32. Mo Z, Fu Q, Lyu D, et al. Impacts of air pollution on dry eye disease among residents in Hangzhou, China: a case-crossover study. Environ Pollut. 2019;246:183–189. doi:10.1016/j.envpol.2018.11.109
33. Mu J, Zeng D, Fan J, et al. Associations between air pollution exposure and daily pediatric outpatient visits for dry eye disease: a Time-series study in Shenzhen, China. Int J Public Health. 2021;66:1604235. doi:10.3389/ijph.2021.1604235
34. Hwang SH, Choi YH, Paik HJ, Wee WR, Kim MK, Kim DH. Potential importance of ozone in the association between outdoor air pollution and dry eye disease in South Korea. JAMA Ophthalmol. 2016;134(5):503–510. doi:10.1001/jamaophthalmol.2016.0139
35. Kim Y, Choi YH, Kim MK, Paik HJ, Kim DH. Different adverse effects of air pollutants on dry eye disease: ozone, PM(2.5), and PM(10). Environ Pollut. 2020;265(Pt B):115039. doi:10.1016/j.envpol.2020.115039
36. Chung CJ, Hsia NY, Wu CD, Lai TJ, Chen JW, Hsu HT. Exposure to ambient NO(2) increases the risk of dry eye syndrome in females: an 11-year population-based study. Int J Environ Res Public Health. 2021;18(13):6860. doi:10.3390/ijerph18136860
37. Miyazaki D, Fukagawa K, Okamoto S, et al. Epidemiological aspects of allergic conjunctivitis. Allergol Int. 2020;69(4):487–495. doi:10.1016/j.alit.2020.06.004
38. Patel S, Kaplan C, Galor A, Kumar N. The role of temperature change, ambient temperature, and relative humidity in allergic conjunctivitis in a US veteran population. Am J Ophthalmol. 2021;230:243–255. doi:10.1016/j.ajo.2021.04.035
39. Chang CJ, Yang HH, Chang CA, Tsai HY. Relationship between air pollution and outpatient visits for nonspecific conjunctivitis. Invest Ophthalmol Vis Sci. 2012;53(1):429–433. doi:10.1167/iovs.11-8253
40. Aik J, Chua R, Jamali N, Chee E. The burden of acute conjunctivitis attributable to ambient particulate matter pollution in Singapore and its exacerbation during South-East Asian haze episodes. Sci Total Environ. 2020;740:140129. doi:10.1016/j.scitotenv.2020.140129
41. Lu P, Zhang Y, Xia G, Zhang W, Li S, Guo Y. Short-term exposure to air pollution and conjunctivitis outpatient visits: a multi-city study in China. Environ Pollut. 2019;254(Pt A):113030. doi:10.1016/j.envpol.2019.113030
42. Fu Q, Mo Z, Lyu D, et al. Air pollution and outpatient visits for conjunctivitis: a case-crossover study in Hangzhou, China. Environ Pollut. 2017;231(Pt 2):1344–1350. doi:10.1016/j.envpol.2017.08.109
43. Wang W, Zhang W, Ge H, et al. Association between air pollution and emergency room visits for eye diseases and effect modification by temperature in Beijing, China. Environ Sci Pollut Res Int. 2022;29(15):22613–22622. doi:10.1007/s11356-021-17304-w
44. Nucci P, Sacchi M, Pichi F, et al. Pediatric conjunctivitis and air pollution exposure: a prospective observational study. Semin Ophthalmol. 2017;32(4):407–411. doi:10.3109/08820538.2015.1115088
45. Zhong JY, Lee YC, Hsieh CJ, Tseng CC, Yiin LM. Association between the first occurrence of allergic conjunctivitis, air pollution and weather changes in Taiwan. Atmos Environ. 2019;212:90–95. doi:10.1016/j.atmosenv.2019.05.045
 © 2024 The Author(s). This work is published and licensed by Dove Medical Press Limited. The
full terms of this license are available at https://www.dovepress.com/terms.php
and incorporate the Creative Commons Attribution
- Non Commercial (unported, 3.0) License.
By accessing the work you hereby accept the Terms. Non-commercial uses of the work are permitted
without any further permission from Dove Medical Press Limited, provided the work is properly
attributed. For permission for commercial use of this work, please see paragraphs 4.2 and 5 of our Terms.
© 2024 The Author(s). This work is published and licensed by Dove Medical Press Limited. The
full terms of this license are available at https://www.dovepress.com/terms.php
and incorporate the Creative Commons Attribution
- Non Commercial (unported, 3.0) License.
By accessing the work you hereby accept the Terms. Non-commercial uses of the work are permitted
without any further permission from Dove Medical Press Limited, provided the work is properly
attributed. For permission for commercial use of this work, please see paragraphs 4.2 and 5 of our Terms.