")
Back to Journals » Journal of Asthma and Allergy » Volume 18
Characteristics of Pollen Concentration Changes in Xi’an and Their Correlation with Allergy-Related Diseases
Authors Zhan Q, Lyu H, He Z, Zhang X, Wang C , Gao Y , Guo Q, Zhang N, Liu C, Shi Y, Lei Y, Xu B, Mi Y, Gao T, Zhu K, Ren X, Ouyang Y, Chen J
Received 2 March 2025
Accepted for publication 19 May 2025
Published 30 May 2025 Volume 2025:18 Pages 847—859
DOI https://doi.org/10.2147/JAA.S525694
Checked for plagiarism Yes
Review by Single anonymous peer review
Peer reviewer comments 2
Editor who approved publication: Dr Luis Garcia-Marcos
Qirui Zhan,1,* Hui Lyu,1,* Zhen He,2,* Xueyan Zhang,1 Chenchen Wang,1 Yuanqi Gao,1 Qingyuan Guo,3 Nan Zhang,3 Cong Liu,3 Yu Shi,3 Yu Lei,3 Bingjie Xu,4 Yanni Mi,5 Tianxi Gao,1 Kang Zhu,1 Xiaoyong Ren,1 Yuhui Ouyang,6 Jingguo Chen1
1Department of Otolaryngology Head and Neck Surgery & Shaanxi Provincial Key Laboratory for Precision Diagnosis and Treatment of Otorhinolaryngology, The Second Affiliated Hospital of Xi’an Jiaotong University, Xi’an, People’s Republic of China; 2Department of Otolaryngology Head and Neck Surgery, The Second People’s Hospital of Shaanxi Province, Xi’an, People’s Republic of China; 3Xi’an Meteorological Bureau, Xi’an, People’s Republic of China; 4School of Architectural Science and Technology, Xi’an University of Architecture and Technology, Xi’an, People’s Republic of China; 5College of Pharmacy, Shaanxi University of Chinese Medicine, Xian Yang, People’s Republic of China; 6Department of Allergy, Beijing Tongren Hospital, Capital Medical University, Beijing, People’s Republic of China
*These authors contributed equally to this work
Correspondence: Jingguo Chen; Email [email protected] Yuhui Ouyang, Email [email protected]
Objective: Airborne pollen is a major contributor to allergic diseases. This study investigates the correlation between airborne pollen dynamics and allergic rhinitis (AR) incidence in Xi’an (2020– 2023) and compared with 1984 data for informing evidence-based prevention strategies.
Methods: The species and concentration of daily pollen in Xi’an were monitored for 4 consecutive years (2020– 2023). Daily pollen concentrations were analyzed alongside clinical AR records from the Second Affiliated Hospital of Xi’an Jiaotong University and public health awareness metrics (Baidu search indices for “allergic rhinitis”, “pollen allergy”, and “loratadine”).
Results: The pollen season in Xi’an occurred from March to May and from August to October, with higher concentrations in spring. Compared to the 1984 data, pollen counts increased significantly (+121.9%, P> 0.05). Correlation analysis revealed a positive relationship between pollen concentration and the number of AR patients during the autumn pollen season from 2020 to 2022 (r=0.307~0.636, P< 0.05). “Pollen allergy” search index correlated positively lwith pollen concentration over the four-year autumn period (r=0.512~0.750, P< 0.001), while trends for “allergic rhinitis” and “loratadine” search indices were less consistent, showing positive correlation only in the autumn pollen season. The public perception of sensitized pollen species in Xi’an did not match the actual AR-related pollen species.
Conclusion: Pollen counts increased significantly in Xi’an, whereas pollen species diversity decreased in the last 40 years. Our results showed the 40-year characteristics comparison of pollen concentration in Xi’an can serve as a basis for developing effective preventive and management measures for patients with pollen-related allergies, including environmental control, timely pollen monitoring, desensitization therapy, and patient health education, to guide the scientific control and prevention of pollen-induced allergic diseases. This study underscores the need for integrated environmental and public health strategies to mitigate pollen-induced AR in rapidly urbanizing regions.
Keywords: airborne pollen, allergic rhinitis, pollen species, pollen content, Baidu index
Graphical Abstract:

Introduction
Airborne sensitized pollen is an important outdoor inhalation allergen and the main cause of allergic diseases such as allergic rhinitis, allergic asthma, and allergic dermatitis.1–4 According to the World Allergy Organization (WAO), the proportion of people with pollen allergies is approximately 10–40%.5 In recent decades, the incidence of pollen allergy has increased significantly.6 The concentration of airborne pollen has clear temporal and spatial distribution characteristics,7 and the allergenicity of different types of pollen also differs significantly.8 Xi’an is located south of the Guanzhong Plain in the Shaanxi Province and north of the Qinling Mountains. It belongs to the warm temperate semi-humid monsoon climate zone and is a representative city in Northwest China. In the past 40 years, the Xi’an urban area has developed rapidly, the species and quantity of airborne sensitized pollen have changed, and the occurrence and development trends of related allergic diseases remain unclear. Studying the spread of airborne sensitized pollen and changes in airborne pollen species in Xi’an is of great significance for the prevention and treatment of allergic diseases. The Peking Union Medical College Hospital launched a survey of airborne sensitized pollen in China in 1984 and recorded the pollen data of three pollen collection points in Xi’an and surrounding areas in detail at that time.9 In this study, we collected data on airborne sensitized pollen in the Xi’an urban area between 2020 and 2023. By analyzing the spatiotemporal distribution of airborne sensitized pollen from 2020 to 2023 and comparing it with the data of airborne sensitized pollen from 1984, the changes in airborne sensitized pollen in the Xi’an area before and after 40 years were explored. To some extent, Internet big data reflect the objective needs of the search population.10 By analyzing the spatio-temporal distribution characteristics of the search volume of allergic rhinitis and related keywords on the Baidu Index platform and comparing them with the real data, it is expected to objectively reflect the sensitization of airborne pollen, explore the correlation between airborne pollen and the incidence of allergic rhinitis, and combine the spatio-temporal distribution characteristics of airborne sensitized pollen in Xi’an to provide direction for the subsequent prevention and treatment of pollen allergy.
Materials and Methods
Pollen Collection and Counting Method
The classic gravity sedimentation method was used to collect pollen,11 with a Durham sampler placed on the rooftop of a sixth-floor building in the urban central area, ensuring that there were no high-rise buildings around it to interfere with pollen collection. Slides coated with a pollen adherent agent were positioned inside the sampling device and replaced daily at fixed times for staining and slide preparation. Microscopic counting involved observing the stained samples under a low-power microscope to record the total number of pollen grains on each slide, which was then converted into the number of pollen grains per 1,000 mm². For pollen type identification, we referred to “Research on Pollen in Northern China – Pollen Morphology and Pollen Allergy Difficult Cases”12 using high-power microscopy to identify the types of pollen observed, with daily results recorded.
To define the annual pollen season and peak pollen period dates, the following criteria were applied: the start of the pollen season was defined as the first day of the first three consecutive days where the pollen count exceeded 20 grains/1,000 mm²; the end of the pollen season was defined as the first day of the last three consecutive days where the pollen count fell below 20 grains/1,000 mm²; the peak pollen period was defined as the date between the first day when the pollen count exceeded 300 grains/1,000 mm² and the first day of the last three consecutive days when the count dropped below 300 grains/1,000 mm².
Baidu Index
The Baidu Index, China’s dominant search engine, serves as a validated proxy for real-time public health interest. Studies demonstrate strong correlations between search volumes for allergy-related terms and clinical case trends, as individuals often seek symptom management advice during peak allergen exposure. This digital tool complements traditional healthcare data, offering granular, timely insights into disease burden patterns. Search index data for the keywords such as “allergic rhinitis”, “allergic conjunctivitis”, “contact dermatitis”, “pollen allergy”, “loratadine”, “cetirizine” and symptoms associated with allergic rhinitis (“itchy nose”, “itchy eyes”, and “sneezing and runny nose”) from Baidu Index platform were collected for the Xi’an region of Shan Xi Province from 2020 to 2023. The variation patterns of the search indices were analyzed. Specifically, the average daily search volumes for “allergic rhinitis”, “pollen allergy”, and “loratadine” during two pollen seasons (spring and autumn) each year from 2020 to 2023 were recorded and analyzed for correlation with the daily pollen concentration.
Allergic Rhinitis Outpatient Data
Given that China lacks a comprehensive monitoring system for Allergic Rhinitis (AR), AR patient data were obtained from daily outpatient numbers at the Second Affiliated Hospital of Xi’an Jiaotong University between 2020 and 2023. These data allowed us to analyze the temporal distribution characteristics of AR patient visits each year and investigate the correlation between daily pollen concentrations and the number of outpatient visits during the pollen season.
Statistical Analysis
Data were input into Excel for initial processing, and GraphPad Prism 9.5.1 was used to create graphs. Statistical analyses were conducted using the SPSS 18.0 software. Spearman correlation analysis was applied to explore correlations between datasets depending on the normality and homogeneity of variance of the data. Statistical significance was set at P-value < 0.05.
Results
Pollen Concentration Trends in Xi’an from 2020 to 2023
Between February 29 and October 15, 2020, a total of 16,868 pollen grains were collected, which could be classified into 19 families and 23 genera; from March 1 to October 15, 2021, 10,254 pollen grains were collected, belonging to 17 families and 21 genera; from March 7 to October 15, 2022, 26,234 pollen grains were collected, classified into 18 families and 22 genera; and from February 28 to October 15, 2023, 19,860 pollen grains were collected, also falling into 18 families and 22 genera (Table 1). Over the four years, the six most common pollen types belonged to the Salicaceae, Asteraceae, Moraceae, Pinaceae, Cupressaceae, and Oleaceae families (Figure 1A). Salicaceae pollen was the most abundant airborne sensitizing pollen during spring, accounting for 21.59%, 28.57%, 31.19%, and 35.20% of all collected pollen over the four years, respectively; Asteraceae pollen was the most abundant during autumn, with percentages of 23.99%, 20.38%, 11.44%, and 8.93% over the four years, while the proportions of other types of pollen are detailed in Table 1.
 |
Table 1 Total Amount and Main Species of Airborne Allergenic Pollen From 2020 to 2023, Xi ‘An |
 |
Figure 1 (A) Pollen species counts from 2020 to 2023; (B) Daily pollen concentration variation patterns from March to October between 2020 and 2023; (C) Pollen season and peak pollen concentration occurrence dates from 2020 to 2023; (D) Variation patterns of six common types of pollen from 2020 to 2023. |
From 2020 to 2023, there are two distinct pollen seasons each year: spring and autumn. The spring pollen season begins in early March and ends in late May, whereas the autumn pollen season starts at the end of August and ends in mid-late October. Spring pollen seasons are characterized by higher daily pollen concentrations and longer durations than autumn. During summer (late May to mid-August), pollen concentrations remained consistently low (Figure 1B).
The duration of the spring pollen season over the four years was as follows: 76 days in 2020, 38 days in 2021, more than 79 days in 2022, and more than 87 days in 2023 (with pollen monitoring starting after the onset of the spring pollen season in 2022 and 2023); the peak pollen concentration periods during spring lasted nine days in 2020, four days in 2021, 24 days in 2022, and five days in 2023, with the start of the peak period in 2022 occurring approximately 15 days earlier than in the other three years, while the end times were roughly the same. The autumn pollen seasons appeared relatively consistent across the years, lasting 46, 37 days in 2021, 38 days in 2022, and 35 days in 2020, 2021, 2022, and 2023, respectively. Peak pollen concentration periods during autumn occurred only in 2020 and 2022, each lasting 4 days (Figure 1C).
Analysis of the temporal distribution of the six most common types of pollen over the four years revealed that during spring, the typical sequence of peak concentrations for different pollen types was as follows: Cupressaceae (before the start of monitoring to approximately March 15), Salicaceae (March 15 to March 31), Pinaceae (April 1 to May 15), and Oleaceae (April 20 to May 10). In autumn, the most common pollen types were Asteraceae and Moraceae, with peak concentrations appearing between September 1 and October 10 (Figure 1D).
Comparative Analysis of Pollen Characteristics 1984 and 2020 to 2023
Two pollen collection sites located in Xi ‘an in 1984. A total of 8390 pollen grains were collected from the southwest area of the city, which could be divided into 23 families, 27 genera, and 32 species. A total of 8104 pollen grains were collected from the southern suburbs, which could be divided into 31 families, 32 genera, and 44 species (Table 2). The species and proportions of common pollen are listed in Table 2. Compared with 1984, the total amount of pollen increased significantly, and the types of pollen decreased significantly from 2020 to 2023, from 23 families in the southwest area of the city and 31 families in the southern suburb of the city in 1984 to 19 families in 2020. Trachycarpus, Humulus, Cyperaceae, Ephedra, Gentian, Albizzia, Sunflower, Ragweed, Ailanthus, Ricinus, Livistona, and Bletilla, which appeared in the 1984 survey, did not appear in the survey from 2020 to 2023.
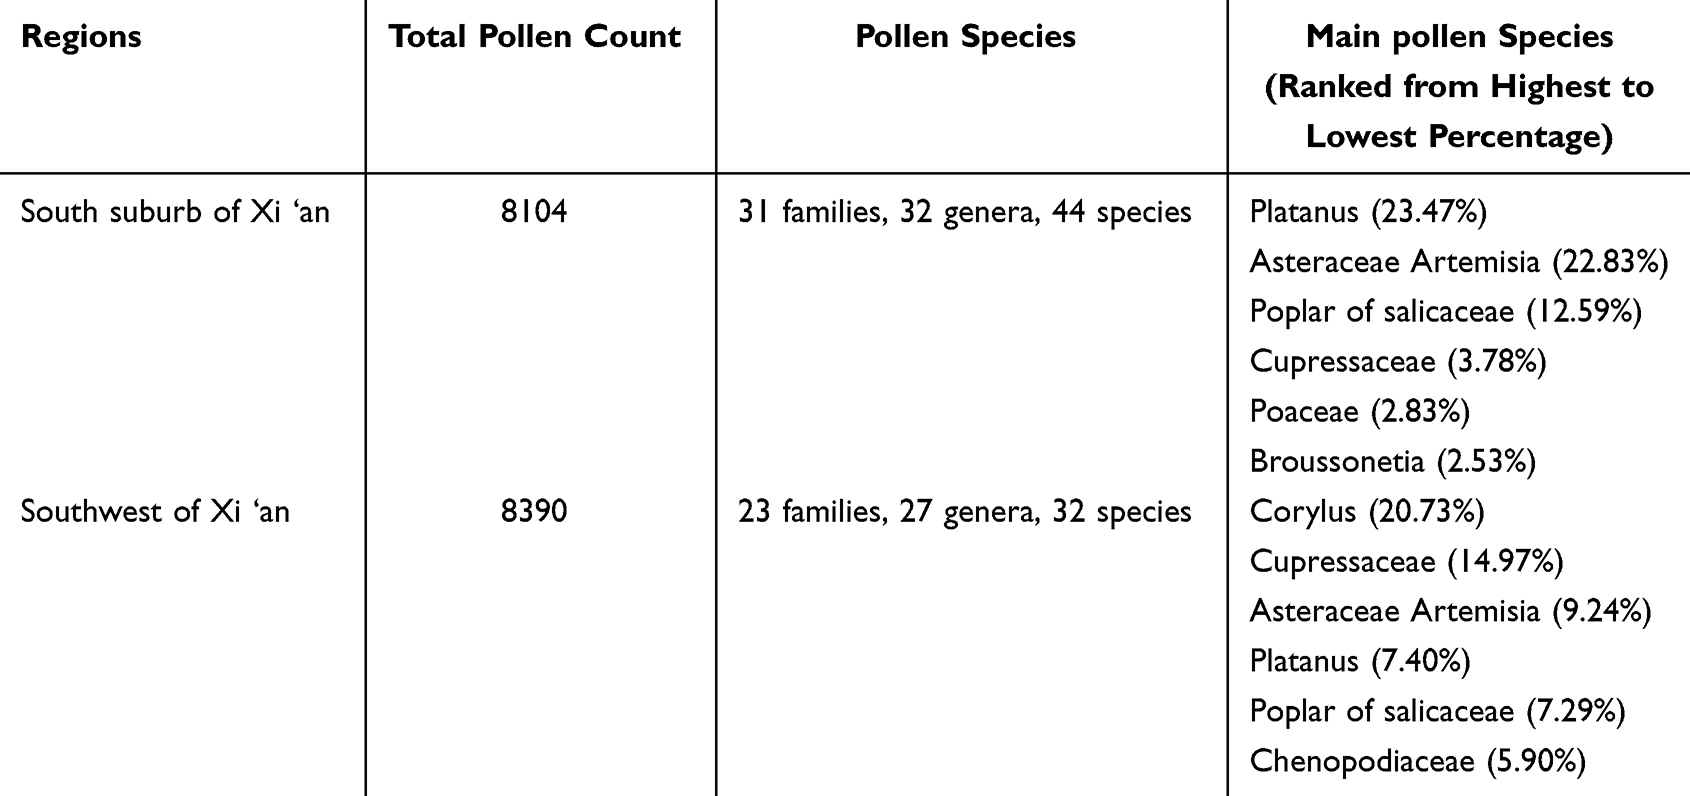 |
Table 2 The Total Amount and Main Types of Airborne Sensitized Pollen in 1984, Xi ‘An |
The number of six common pollen species, Pinaceae, Cupressaceae, Salicaceae, Luteolin, Moraceae, and Asteraceae, increased from 2020 to 2023 compared with 1984. Except for Moraceae pollen, there was little difference in the concentration peak times of the other five types of pollen. The peak time for each pollen concentration was as follows: Pinaceae from March to June, Cupressaceae from March, Salicaceae from March, Luteolin from April to June, Asteraceae from September. There are two peak periods of Moraceae pollen from 2020 to 2023, namely, a small peak from March to May and a large peak from August to September, whereas there was only one peak from March to April in 1984 (Figure 2). According to the survey, the main species and genera of Moraceae plants in 1984 and from 2020 to 2023 changed; in 1984, the common Moraceae plants were Broussonetia, and their pollen season was in spring. From 2020 to 2023, except for Broussonetia, the Humulus of Moraceae plants increased significantly, and the pollen season of Humulus was in autumn. Therefore, from 2020 to 2023, the pollen concentration of Moraceae peaked in autumn, and the pollen concentration in autumn was higher than that in spring.
 |
Figure 2 Time variation trend of 6 common pollens (Pinaceae, Cupressaceae, Salicaceae, Oleaceae, Moraceae, Asteraceae) from 1984 and 2020 to 2023, Xi ‘an. |
Comparative Analysis of Pollen Data, AR Clinic Visits and Big Data from 2020 to 2023
Pollen Data Combined with Outpatient Data of AR Patients
During the pollen monitoring period from 2020 to 2023, the daily outpatient number of patients with AR in our hospital showed an obvious seasonal variation, with a peak in September each year, a slight increase from March to April, and no significant difference in the other time periods. The peak time of the number of patients was roughly the same as that of the pollen season, except that the peak number of patients in spring 2022 was delayed by 20 days compared to the pollen season (Figure 3A). Upon investigation, it was found that during the spring pollen season of 2022, there was a serious epidemic in Xi ‘an, and most residents were isolated at home for about 20 days, resulting in the above phenomenon. After excluding abnormal data caused by factors such as weather and home isolation, the correlation between pollen concentration during the pollen season and the corresponding peak number of patients with AR was analyzed. In the autumn pollen season from 2020 to 2023, the daily pollen concentration was positively correlated with the daily number of patients with AR. In the spring pollen season from 2020 to 2023, there was no correlation between daily pollen concentration and the corresponding number of patients with AR (Table 3).
 |
Table 3 The Pollen Season and the Number of AR Patients on the Same Day |
 |
Figure 3 (A) Changes of pollen concentration and number of patients with allergic rhinitis over time; (B) Changes of AR and related search terms over time (1) the temporal variation of “allergic rhinitis”, “allergic conjunctivitis”, “contact dermatitis” and “pollen allergy”; (2) the temporal variation of “loratadine”, “cetirizine”, “itchy eyes”, “itchy nose” and “sneezing runny nose”. |
Pollen Data Combined with Baidu Index Analysis
The Baidu index from 2020 to 2023 showed that the search volume of “allergic rhinitis” in Xi’an had an obvious seasonal variation, with the first peak from March to May and the second peak from September to October each year. The second peak had a shorter duration and a higher search volume than the first peak. The search volume of “allergic conjunctivitis” was similar to that of “allergic rhinitis”, while the search volume of “contact dermatitis” showed no obvious seasonal change. “Pollen allergy” searches showed the same temporal pattern as “allergic rhinitis”, but “pollen allergy” searches were higher from March to May than from September to October, contrary to the fact that “allergic rhinitis” searches were higher from September to October. The search volume of “loratadine” and “cetirizine” changed synchronously with that of “allergic rhinitis”. For the symptoms of allergic rhinitis, the time variation of the search volume of “sneezing runny nose” and “itchy eyes” was consistent with the search volume of “allergic rhinitis”, whereas the search volume of “itchy nose” had no obvious seasonal variation (Figure 3B).
The search volume of “allergic rhinitis”, “pollen allergy” and “loratadine” showed the same trend with the annual pollen concentration in Xi ‘an, and the search index peaks of the above keywords all appeared in the corresponding pollen period. We analyzed the correlation between search volume of “allergic rhinitis”, “pollen allergy” and “loratadine” and pollen concentration in each pollen period. During the eight pollen seasons from 2020 to 2023, searches for “pollen allergies positively correlated with pollen concentrations. There was a positive correlation between pollen concentration and search volume of “allergic rhinitis” and “loratadine” in the spring pollen seasons of 2020 and 2023, and in the autumn pollen seasons of the four years. No correlation was found between searches for “allergic rhinitis” and “loratadine” or pollen concentrations during the spring pollen seasons in 2021 and 2022 (Table 4).
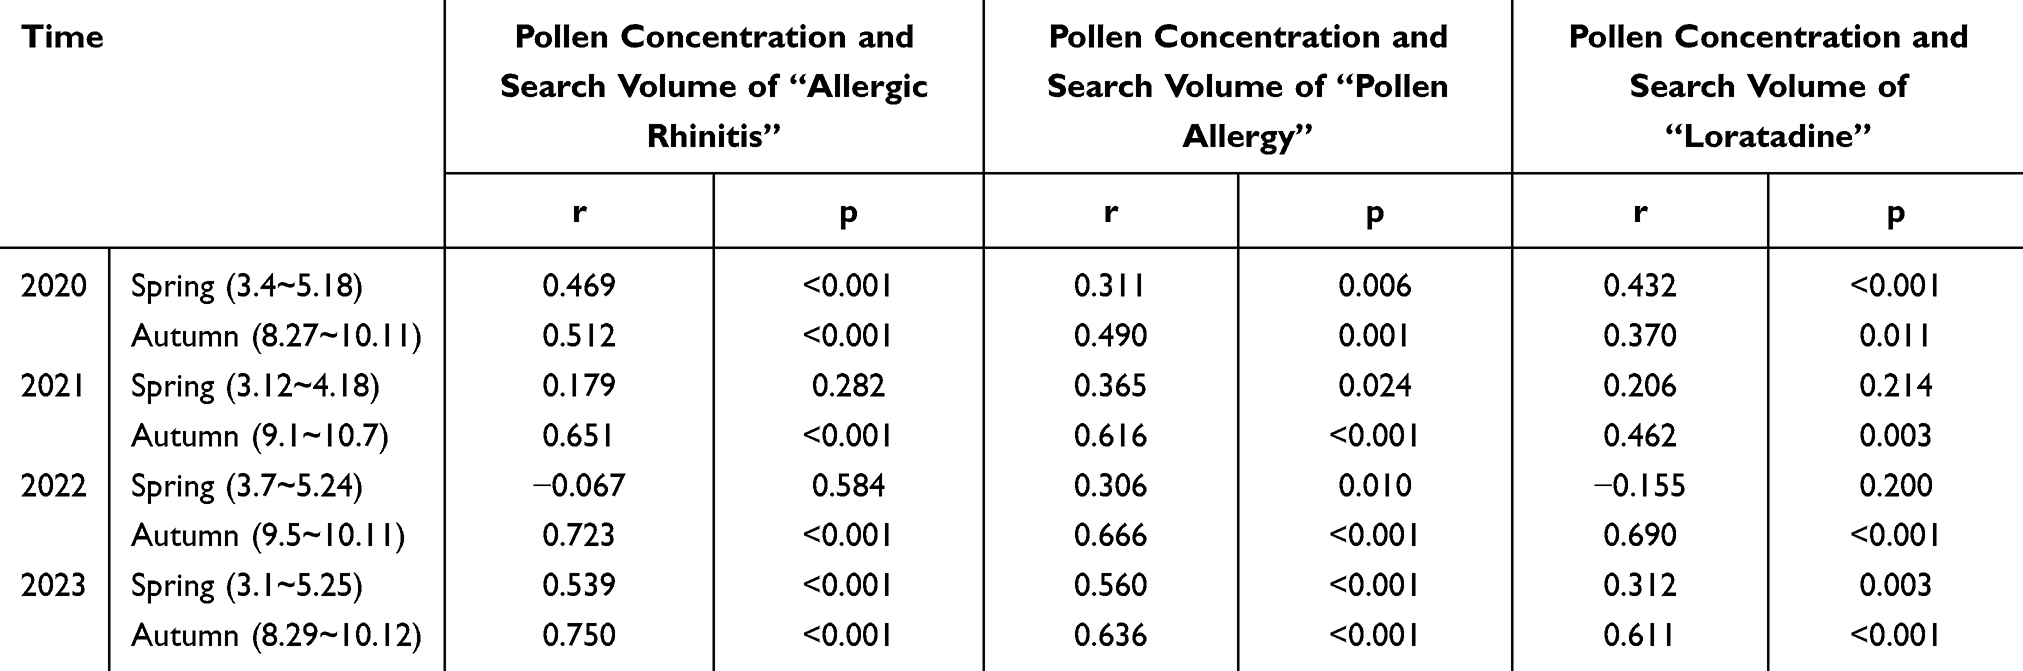 |
Table 4 Correlation Analysis Between Pollen Concentration and the Number of Searches for Allergic Rhinitis and Related Terms |
Discussion
Xi’an City, located in northwest China, experiences a warm temperate semi-humid continental monsoon climate in the middle reaches of the Yellow River in the Guanzhong Plain. As the core city of the Guanzhong Plain urban agglomeration and an important central city in western China, studying the distribution and sensitization of pollen in Xi’an has significant implications for predicting pollen distribution in the northwestern region of China and guiding local residents in preventing pollen allergy diseases.
This study analyzed the changes in airborne pollen concentrations in Xi’an from 2020 to 2023. The distribution of pollen concentration changes in the Xi’an region exhibited a bimodal pattern, with pollen seasons occurring from March to May and August to October each year. Spring pollen levels were higher than those in autumn, and within these four years, the frequency and duration of autumn pollen concentration peaks were lower than those in spring, which is consistent with previous studies.13 Spring pollen mainly consists of Salicaceae, Cupressaceae, Pinaceae, and Oleaceae, whereas autumn pollen is predominantly derived from Asteraceae (Artemisia spp) and Moraceae. It should be noted that variations in air pollen concentrations are not only related to the flowering times of plants, pollen characteristics, and local vegetation composition but are also significantly influenced by meteorological conditions such as temperature, precipitation, wind speed, and humidity.14 This has resulted in differences in the start and end times of pollen seasons and peak concentrations each year from 2020 to 2023 as well as variations in the duration of the two pollen seasons each year. Notably, autumn pollen (predominantly Asteraceae, contributing most of total autumn pollen) exhibited the strongest correlation (P<0.05) with AR clinical cases, surpassing spring Salicaceae () and summer Poaceae (P>0.05). This aligns with hospital data showing AR consultations peaking in September–October, coinciding with Artemisia’s pollen dispersal period.
According to relevant studies,13 the climate in northwestern China is dry and windy, which leads to prolonged pollen transmission periods and large transmission volumes. Dry conditions cause pollen sacs to easily rupture, thereby releasing a significant amount of pollen. Moreover, the vast territory of the northwestern region contributes to high weed pollen production, early spring pollen season, and longer autumn pollen season. The annual average pollen concentration is higher in this region, increasing exposure to pollen allergens and potentially causing more severe allergy symptoms. These data indicate that the common allergenic pollen types and their spatiotemporal distribution characteristics in Xi’an throughout the year were similar with those in Lanzhou and Hohhot.13 Therefore, a detailed analysis of the trends in pollen concentration changes in the Xi’an area can provide guidance for predicting the patterns of pollen concentration changes in other areas of the northwestern region such as Lanzhou and Hohhot.
Comparing the pollen data from the urban area of Xi’an over a span of 40 years, we observed that the total annual pollen quantity in Xi’an from 2022 to 2023 increased compared to that in 1984, while the diversity of pollen types decreased. A study conducted in 2007 comparing pollen data from 1986 to 2006 in Xi’an15 also concluded that over the past four decades, the number of pollen grains has increased in Xi’an, but the diversity of pollen types has diminished. Our research showed that there has been a significant increase in Rosaceae and Oleaceae pollen in recent years, with rapid growth in Urtica (stinging nettle) and Poaceae (grass) pollen. Meanwhile, the diversity and quantity of the Platanaceae (plane tree) pollen decreased. The increase in pollen numbers suggests an overall improvement in urban greening levels, whereas changes in pollen diversity are related to shifts in the selection of plants used for urban landscaping. The introduction of non-native species and reduction in native plant populations may lead to a decrease in pollen type diversity. The timing of the most common pollen concentration peaks has remained largely consistent over the past 40 years. However, owing to the lack of data from February, it is not possible to accurately determine the peak period of Cupressaceae (cypress family) pollen from 2020 to 2023. This suggests that future monitoring should begin earlier to better predict and prepare for the pollen season. Additionally, our findings indicate that the Moraceae (mulberry family) pollen peak, which was confined to a single spring peak in 1984, evolved into two separate peaks in spring and autumn from 2020 to 2023. This change was attributed to the shift in the predominant Moraceae species from Broussonetia papyrifera (paper mulberry) in 1984 to both Broussonetia papyrifera and Urtica in recent years. The former pollen season occurs in spring, whereas the latter occurs in autumn, leading to the aforementioned pattern. Comparing pollen data from 1984 to 2020–2023, the observed increase in total pollen quantity and reduction in species diversity likely reflect significant urbanization and climate shifts in Xi’an. Over the past four decades, rapid urban expansion has prioritized greening with allergenic tree species such as Salicaceae (willow/poplar) and Cupressaceae (cypress) for their fast growth and aesthetic value, creating monocultures that reduce biodiversity while amplifying pollen production. Concurrently, regional climate warming has extended pollen seasons, particularly in spring, by advancing flowering phenology. Increased frequency of dry, windy conditions—a hallmark of aridification in Northwest China—further enhances pollen dispersal. These anthropogenic and climatic drivers synergistically explain the dominance of select pollen types and heightened allergenic exposure.
Combining the 4-year pollen data with the number of AR visits during the pollen monitoring period from 2020 to 2023, the peak of AR visits occurred in September every year, and the number of visits increased slightly from March to April, contrary to the change in pollen concentration (higher in spring than in autumn). The etiology of allergic rhinitis is not only related to genetic and environmental factors (such as temperature and humidity), but also to inhaled allergens and their close.16,17 The sensitization strength of different pollen species varies, resulting in a higher number of AR visits in autumn than in spring. In the spring pollen season, the pollen species are mainly willow, Cupressaceae, Pinaceae and Trichoaceae, pollen sensitization is weak, and the number of patients only slightly increased; in the autumn pollen season, the pollen species are dominated by Atemia and Moraceae, and the pollen sensitization is strong,18 so the number of patients in the autumn pollen season is significantly increased with the increase of pollen concentration.
Combining the Baidu Index data with pollen concentration analysis, this study found a discrepancy between the public’s perception of pollen allergies and the actual allergens causing Allergic Rhinitis (AR) in Xi’an. The peak of AR medical consultations occurs annually in autumn (September), during which pollen concentration correlates positively with the number of consultations, whereas there is no such correlation between spring pollen concentration and consultation number. On the other hand, the correlation between pollen concentration and the search volume for terms like “allergic rhinitis” and “loratadine” is weaker than that between pollen concentration and searches for “pollen allergy.” It is generally accepted that search indices reflect a local population’s level of concern regarding certain issues. This means that residents of Xi’an tend to believe that pollen allergies are more prevalent during spring when pollen concentrations are higher, which contradicts the fact that autumn pollen has stronger allergenicity and is associated with a high incidence of AR. Based on these findings, we believe that there is a need for enhanced public education on AR and related allergic diseases in Xi’an, with an emphasis on highlighting that Asteraceae (Artemisia) pollen in autumn is the primary allergen for AR. Patients and susceptible populations should be advised to take additional protective measures during the autumn. Our proposed urban planning strategies align with Xi’an’s foundational policy framework established in the 2017 Urban Greening Plant Configuration Design Guidelines. Specifically, the guidelines mandate strict avoidance of allergenic and hazardous vegetation in public spaces, with actionable implementation measures, such as explicitly prohibit planting toxic, thorny, or allergenic species (eg, Artemisia, Platanus, Rosa spp.) near schools, hospitals, and residential areas.
This study has several limitations. First, the pollen data for the past four years lacked data from February, which may have affected the accurate determination of the peak pollen concentration periods for Cupressaceae, Pinaceae, and Salicaceae. The start time for annual pollen monitoring should be advanced by 15–30 d. Second, this study only considered the number of patients with Allergic Rhinitis (AR) visited the Second Affiliated Hospital of Xi’an Jiaotong University, which may result in insufficient generalizability of the data and limit the comprehensive evaluation of the impact of pollen allergies. Finally, the majority of online users are young and middle-aged adults, with fewer elderly people and children participating, leading to an age bias.
In summary, this study not only elucidated the spatiotemporal distribution patterns of airborne pollen in Xi’an over the past four years, but also illustrated the relationship between fluctuations in pollen concentration and the onset of Allergic Rhinitis (AR). This further points out that the public perception of pollen allergies remains biased, indicating a need for enhanced prevention efforts concerning various allergic diseases triggered by autumn allergenic pollen. The results can serve as a basis for developing effective preventive and management measures for patients with pollen-related allergies, thereby guiding the scientific control and prevention of pollen-induced allergic diseases. In the future, it is important to establish and refine pollen monitoring and early warning systems to better assist the public and healthcare providers in managing pollen allergy seasons. The treatment of allergic diseases requires an integrated approach that combines prevention and treatment across four key areas.19 First, environmental control to avoid or reduce exposure to allergens; second, desensitization therapy using allergen-specific vaccines; third, the use of targeted drugs to block allergic reactions or anti-allergic medications to control symptoms; fourth, patient health education. The first approach is prioritized because of its preventive and causal therapeutic benefits, whereas the second approach is considered next because it also targets the cause. Desensitization therapy should no longer be contingent upon the failure of antiallergic drug treatments but should be regarded as a frontline method. The third approach focuses on symptomatic treatment and the fourth aims to change public perceptions of allergic diseases and enhance patient compliance, which is essential for long-term disease management. All four approaches should be employed concurrently rather than relying solely on antiallergic medication. Furthermore, public education should be strengthened to increase awareness of pollen allergens and the allergy season, to mitigate the impact of pollen allergies on public health. In addition, the municipal government’s greening departments should decrease the cultivation and planting of allergenic pollen-producing plants to create a more suitable urban environment for residents.
Abbreviations
AR, Allergic Rhinitis; WAO, World Allergy Organization; p, p-value; r, correlation coefficient.
Data Sharing Statement
The data of this study are available from the corresponding author (Jingguo Chen, Email: [email protected]) upon reasonable request.
Ethics Approval and Consent to Participate
This study was conducted in accordance with the principles of the Declaration of Helsinki. This study was approved by the Research Ethics Committee of the Second Affiliated Hospital of the Xi’an Jiaotong University. All participants provided informed consent prior to participating in the survey.
Acknowledgments
The authors wish to acknowledge all participants and investigators in the study.
Author Contributions
All authors made a significant contribution to the work reported, QZ and JC: Data analysis, All figures, Writing-manuscript, Writing-review & editing. All authors collected and provided the pollen data for 2020–2023 and involved in the conception, study design, execution and interpretation. XZ, CW, and YG: Part of the data analysis, Writing-original manuscript. QZ, JC and YO took part in drafting, revising and critically reviewing the article. All authors gave final approval of the version and have agreed on the journal to which the article has been submitted; all authors agree to be accountable for all aspects of the work.
Funding
This project was supported by the Key Research and Development Program of Shaanxi Province (2024SF‑YBXM‑345), Basic Research Fund for the Central Universities (xzy012020046), Natural Science Foundation of Shaanxi Province Youth Project (2021JQ‑418). The funding agencies had no role in the study design, data collection and management, data analysis, or interpretation of the data.
Disclosure
The authors declare no competing interests in this work.
References
1. Beggs PJ. Impact of climate change on aeroallergens: past and future. Clin Exp Allergy. 2004;34(10):1507–1513. doi:10.1111/j.1365-2222.2004.02061.x
2. Xie L, Zhu L, Zhang F. Relationship between full flowering stages of anemophilous and ligneous plants and consultation rate of allergic rhinitis. Lin Chuang Er Bi Yan Hou Tou Jing Wai Ke Za Zhi. 2016;30(15):1206–1209. doi:10.13201/j.issn.1001-1781.2016.15.007
3. Hwang Y, Motomura C, Fukuda H, Kishikawa R, Watanabe N, Yoshihara S. Relationship among airborne pollen, sensitization, and pollen food allergy syndrome in Asian allergic children. PeerJ. 2022;10:e14243. doi:10.7717/peerj.14243
4. Torres-Borrego J, Sánchez-Solís M. Dissecting airborne allergens. J Clin Med. 2023;12(18):5856. doi:10.3390/jcm12185856
5. Pawankar R, W CG, T HS, et al. WAO White Book Onallergy[M]. Milwaukee, WI: World Allergy Organization; 2011.
6. Suanno C, Aloisi I, Fernández-González D, Del Duca S. Monitoring techniques for pollen allergy risk assessment. Environ Res. 2021;197:111109. doi:10.1016/j.envres.2021.111109
7. Zhang J, Yan Y, Jiang F, Chen J, Ouyang Y, Zhang L. Main airborne pollen species and characteristics of allergic rhinitis patients with pollen-related allergies in 13 northern Chinese cities. J Asthma Allergy. 2024;17:757–768. doi:10.2147/JAA.S471540
8. Wang XY, Ning HY, Chu SM, et al. An analysis of spectrum of allergen sensitization among patients with tree pollen allergy in Beijing. Lin Chuang Er Bi Yan Hou Tou Jing Wai Ke Za Zhi. 2017;31(23):1819–1823. doi:10.13201/j.issn.1001-1781.2017.23.010
9. Ye S. A National Survey of Airborne and Allergenic Pollen in China. Beijing: Beijing Publishing House Group. 1991.
10. Aiello AE, Renson A, Zivich PN. Social media- and internet-based disease surveillance for public health. Annu Rev Public Health. 2020;41:101–118. doi:10.1146/annurev-publhealth-040119-094402
11. Durham OC. The volumetric incidence of atmospheric allergens; a proposed standard method of gravity sampling, counting, and volumetric interpolation of results. J Allergy. 1949;17:79–86. doi:10.1016/0021-8707(46)90025-1
12. Wang X, Zhang L. Research on plant pollen and difficult cases of pollen morphology and pollen allergy in northern China. Beijing Sci Technol Press. 2018
13. Sauliene I, Valiulis A, Keriene I, et al. Airborne pollen and fungi indoors: evidence from primary schools in Lithuania. Heliyon. 2023;9(1):e12668. doi:10.1016/j.heliyon.2022.e12668
14. Zhong J, Xiao R, Wang P, et al. Identifying influence factors and thresholds of the next day’s pollen concentration in different seasons using interpretable machine learning. Sci Total Environ. 2024;935:173430. doi:10.1016/j.scitotenv.2024.173430
15. Zhang G, Zhang A, Li X, et al. Comparison of Genera and Content of the Airborne Pollens in 1986 and 2006 in Xi’an City. Chin J Allergy & Clin Immunol. 2007;1(02):167–171 doi:10.3969/j.issn.1673-8705.2007.02.009.
16. Meng Y, Wang C, Zhang L. Recent developments and highlights in allergic rhinitis. Allergy. 2019;74(12):2320–2328. doi:10.1111/all.14067
17. Zhang L, Akdis CA. The past, present, and future of allergic diseases in China. Allergy. 2022;77(2):354–356. doi:10.1111/all.15213
18. Rahman A, Khan MHR, Luo C, Yang Z, Ke J, Jiang W. Variations in airborne pollen and spores in urban Guangzhou and their relationships with meteorological variables. Heliyon. 2021;7(11):e08379. doi:10.1016/j.heliyon.2021.e08379
19. Allergy Branch of Beijing Medical Association. Expert consensus on diagnosis, treatment and prevention of allergic diseases (Part II). Zhonghua Yu Fang Yi Xue Za Zhi. 2022;56(11):1527–1539. doi:10.3760/cma.j.cn112150-20220209-00117.
 © 2025 The Author(s). This work is published and licensed by Dove Medical Press Limited. The
full terms of this license are available at https://www.dovepress.com/terms.php
and incorporate the Creative Commons Attribution
- Non Commercial (unported, 4.0) License.
By accessing the work you hereby accept the Terms. Non-commercial uses of the work are permitted
without any further permission from Dove Medical Press Limited, provided the work is properly
attributed. For permission for commercial use of this work, please see paragraphs 4.2 and 5 of our Terms.
© 2025 The Author(s). This work is published and licensed by Dove Medical Press Limited. The
full terms of this license are available at https://www.dovepress.com/terms.php
and incorporate the Creative Commons Attribution
- Non Commercial (unported, 4.0) License.
By accessing the work you hereby accept the Terms. Non-commercial uses of the work are permitted
without any further permission from Dove Medical Press Limited, provided the work is properly
attributed. For permission for commercial use of this work, please see paragraphs 4.2 and 5 of our Terms.