")
Back to Journals » Journal of Inflammation Research » Volume 17
CITED2 Mediates Metabolic Reprogramming in Renal Tubular Epithelial Cells via the AKT Signaling Pathway to Induce Sepsis-Associated Acute Kidney Injury
Authors Deng R, Yang H, Zhong W, Zhou J, Huang G, Zeng K
Received 11 July 2024
Accepted for publication 6 November 2024
Published 22 November 2024 Volume 2024:17 Pages 9485—9505
DOI https://doi.org/10.2147/JIR.S486596
Checked for plagiarism Yes
Review by Single anonymous peer review
Peer reviewer comments 2
Editor who approved publication: Professor Ning Quan
Ruiming Deng,1,2,* Hang Yang,1,* Weibo Zhong,2 Juan Zhou,3 Guiming Huang,2 Kai Zeng1
1Department of Anesthesiology, The First Affiliated Hospital of Fujian Medical University, Fuzhou City, Fujian Province, 350004, People’s Republic of China; 2Department of Anesthesiology, Ganzhou People’s Hospital, Ganzhou City, Jiangxi Province, 341000, People’s Republic of China; 3Department of Thyroid and Breast Surgery, Ganzhou People’s Hospital, Ganzhou City, Jiangxi Province, 341000, People’s Republic of China
*These authors contributed equally to this work
Correspondence: Kai Zeng, Department of Anesthesiology, The First Affiliated Hospital of Fujian Medical University, Fuzhou City, Fujian Province, 350004, People’s Republic of China, Email [email protected] Guiming Huang, Department of Anesthesiology, Ganzhou People’s Hospital, Ganzhou City, Jiangxi Province, 341000, People’s Republic of China, Email [email protected]
Background: Sepsis-associated acute kidney injury (S-AKI) is a prevalent and severe clinical complication in intensive care units (ICUs) and is associated with high mortality and poor prognosis. The dysfunction of renal tubular epithelial cells (TECs), particularly through their metabolic reprogramming, plays a critical role in the onset and progression of S-AKI. CITED2 is shown to regulate a variety of cellular processes, but its specific impact on TECs metabolism and S-AKI pathogenesis remains unclear. The aim of this study was to investigate the role of CITED2 in the metabolic reprogramming of TECs and its effects on inflammation and kidney injury in S-AKI.
Material and Methods: The C57BL/6 mouse model of S-AKI was established using cecal ligation and puncture (CLP). We assessed the inflammatory responses, glucose metabolism and CITED2 expression in the kidneys of septic mice. Additionally, the effect of CITED2 on TECs metabolism and inflammation was evaluated using in vivo and in vitro models. CITED2 silencing and overexpression were employed to elucidate its regulatory role, focusing on the AKT signaling pathway.
Results: S-AKI causes structural and functional kidney damage, aggravated inflammatory responses, and dysregulated glucose metabolism, accompanied by increased expression of CITED2. CITED2 silencing attenuated TECs metabolic dysfunction and reduced inflammation, thereby protecting the kidney from injury. Conversely, CITED2 overexpression exacerbated TECs metabolic dysfunction, promoted inflammatory responses, and worsened kidney injury. Mechanistically, CITED2 regulates TEC metabolism through the AKT signaling pathway, promoting S-AKI-related inflammation and contributing to kidney injury.
Conclusion: CITED2 drives the metabolic reprogramming of TECs through the AKT signaling pathway, thereby aggravating the inflammatory response and leading to kidney injury, highlighting its critical role in S-AKI. Targeting CITED2 inhibition may represent a novel therapeutic approach for managing S-AKI.
Keywords: CITED2, Sepsis, Acute kidney injury, Metabolic reprogramming, TECs
Introduction
Sepsis is a life-threatening organ dysfunction caused by a dysregulated response to infection. In severe cases, sepsis can lead to multiple organ damage, characterized by high morbidity and mortality, with the kidneys being among the most commonly affected organs.1–3 Approximately 58.7% of sepsis patients experience kidney injury, and the prevalence of sepsis-associated acute kidney injury (S-AKI) is notably high. Severe acute kidney injury may progress to renal failure, with a correspondingly high mortality rate.4 Despite this, targeted treatments for S-AKI are lacking, and patient outcomes and prognoses remain poor. Thus, understanding the pathogenesis of S-AKI is critical for its early diagnosis and treatment.
The kidneys play a vital role in waste excretion and maintaining internal homeostasis, characterized by a high metabolic rate. Renal tubular epithelial cells (TECs), the most abundant cell type in the kidneys, are essential for the reabsorption of glomerular filtrate. They also play key roles in secretion and excretion function, regulating water, electrolytes and acid-base balance.5,6 Damage to TECs, closely associated with S-AKI, is crucial in kidney injury and repair. Studies have shown that inflammation, oxidative stress, hemodynamics changes, and microvascular dysfunction can induce TEC damage in S-AKI.7–10 However, an increasing number of studies indicate that metabolic reprogramming of TECs plays a central role in S-AKI pathogenesis.11 Since renal reabsorption requires a large amount of energy, TECs predominantly rely on fatty acid oxidation to meet their high energy demands.12,13 However, during sepsis, TECs undergo a shift towards glycolysis, while the low energy production of glycolysis cannot meet the energy demand of TECs, leading to the failure of cellular processes, including ion transport, cell repair, and the maintenance of structural integrity, which aggravates TECs damage.11,14 Furthermore, metabolic reprogramming impacts additional pathways such as mitochondrial function and lipid metabolism, leading to increased oxidative stress and mitochondrial dysfunction.15,16 These metabolic disturbances in TECs intensify inflammation, exacerbating renal injury in sepsis. However, the precise mechanisms linking TECs metabolic reprogramming to S-AKI remain unclear. A comprehensive understanding of TECs metabolism in S-AKI is essential to reduce kidney injury and improve the prognosis of patients with sepsis.
CBP/p300 interacting transactivators with a Glu/Asp rich carboxy-terminal domain 2 (CITED2) is a binding protein that functions as a transcription cofactor. CITED2 influences energy metabolism through its role in regulating inflammation and insulin sensitivity,17,18 and is implicated in the development of various tumors, liver, heart diseases and metabolic diseases.19–21 The role of CITED2 in the development and progression of S-AKI remains unclear. Reports suggest that CITED2 can regulate cellular metabolic reprogramming by influencing key proteins involved in glucose metabolism, affecting glucose uptake and utilization.22,23 However, no studies have yet reported on CITED2’s regulation of TECs metabolism. Moreover, while protein kinase B (AKT) has been recognized as a critical regulator of cellular metabolism,24–26 the interaction between CITED2 and the AKT signaling pathway, and whether there is a regulatory mechanism between them in S-AKI, has not been documented.
This study aims to elucidate the role of CITED2 in the pathogenesis of S-AKI. We found that CITED2 is highly expressed in S-AKI and that it can regulate the metabolic reprogramming of TECs through the AKT signaling pathway, promote the inflammatory response, and contribute to S-AKI. These findings provides potential targets and new perspectives for the diagnosis and treatment of S-AKI.
Materials and Methods
Construction of the S-AKI Animal Model
Healthy adult male C57BL/6J mice (weight 25±3g) and of SPF grade, were procured from the Changzhou Cavins Laboratory Animal Company (license No. SCXK (Su) 2021–0013). All animal procedures received approval from the Fujian Medical University Institutional Animal Care and Use Committee (No. FJMU IACUC 2021–0336) and adhered to the Ethical Guidelines for the Care and Use of Laboratory Animals. For the model construction, mice were anesthetized, and their abdomens surgically opened to expose the cecum. The cecum was then ligated with silk thread and perforated to establish the S-AKI model. Subsequently, a CITED2 silencing adenovirus vector (5′-TTCTCCGAACGTGTCACGTAA-3′) (25 μL) was injected into the left kidney of S-AKI mouse model, while the right kidney underwent a similar treatment to create a CITED2-silenced sepsis mouse model.
Construction of the S-AKI Cell Model
Human renal cortical proximal tubular epithelial cells (HK-2 cells) (Procell, CL-0109, China) were cultured at 37°C in a 5% CO2 incubator using MEM complete medium, which included 10% fetal bovine serum (FBS), 1% cyan-streptomycin, and 1% non-essential amino acids (NEAA). To establish the septic HK-2 cell model, cells were treated with 50 μg/mL lipopolysaccharide (LPS) (Sigma, L2880, USA) for 24 hours. Concurrently, either a CITED2 silencing vector (5′-ACGGACUUCGUGUGCAATT-3′) or a CITED2 overexpression vector (5′-ATGGCAGACCATATGATGGCCATGAACCACGGGCGCTTCCCCGACGGCACCAATGGGCTGCACCATCACCCTGCCCACCGCATGGGCATGGGGCAGTTCCCGAGCCCCCATCACCACCAGCAGCAGCAGCCCCAGCACGCCTTCAACGCCCTAATGGGCGAGCACATACACTACGGCGCGGGCAACATGAATGCCACGAGCGGCATCAGGCATGCGATGGGGCCGGGGACTGTGAACGGAGGGCACCCCCCGAGCGCGCTGGCCCCCGCGGCCAGGTTTAACAACTCCCAGTTCATGGGTCCCCCGGTGGCCAGCCAGGGAGGCTCCCTGCCGGCCAGCATGCAGCTGCAGAAGCTCAACAACCAGTATTTCAACCATCACCCCTACCCCCACAACCACTACATGCCGGATTTGCACCCTGCTGCAGGCCACCAGATGAACGGGACAAACCAGCACTTCCGAGATTGCAACCCCAAGCACAGCGGCGGCAGCAGCACCCCCGGCGGCTCGGGCGGCAGCAGCACCCCCGGCGGCTCTGGCAGCAGCTCGGGCGGCGGCGCGGGCAGCAGCAACAGCGGCGGCGGCAGCGGCAGCGGCAACATGCCCGCCTCCGTGGCCCACGTCCCCGCTGCAATGCTGCCGCCCAATGTCATAGACACTGATTTCATCGACGAGGAAGTTCTTATGTCCTTGGTGATAGAAATGGGTTTGGACCGCATCAAGGAGCTGCCCGAACTCTGGCTGGGGCAAAACGAGTTTGATTTTATGACGGACTTCGTGTGCAAACAGCAGCCCAGCAGAGTGAGCTGTTGA-3′) (CITED2-pcDNA3.1, Anhui General Company, Anhui, China) was transfected into approximately 70% to 80% of the confluent HK-2 cells using lipofectamine 3000 (Invitrogen, L3000150, USA). Following transfection, cells were again treated with LPS for 24 hours to develop the septic cell model featuring either CITED2 silencing or overexpression.
Enzyme-Linked Immunosorbent Assay (ELISA)
ELISA kits were used to detect IL-1β (Boster, EK0394, China), IL-6 (Boster, EK0411, China), TNF-α (Boster, EK0527, China) in serum and cAMP (Elabscience, E-EL-0056c, China) in HK-2 cells. The experimental protocols were carried out in strict adherence to the manufacturer’s instructions, and concentration results were normalized using the reagents provided in the kits.
Reverse Transcription Quantitative Polymerase Chain Reaction (RT-qPCR)
Total RNA was extracted using the RNA extraction kit (CWBIO, CW0581M, China). The RNA reverse transcription reactions were performed in strict accordance with the kit instructions (Vazyme, R223-01, China). Amplification reactions were conducted using the ChamQ Universal SYBR qPCR Master kit (Vazyme, Q711-02, China). The reaction conditions were as follows: an initial predenaturation at 95°C for 2 minutes; this was followed by 40 cycles of denaturation at 95°C for 10 seconds, annealing at 60°C for 34 seconds, and extension at 72°C for 30 seconds, with a final extension period of 10 minutes. The sequences of the primers used are detailed in Table 1. β-Actin served as the internal reference gene. The relative mRNA expression levels were quantified using the 2−ΔΔCT method.
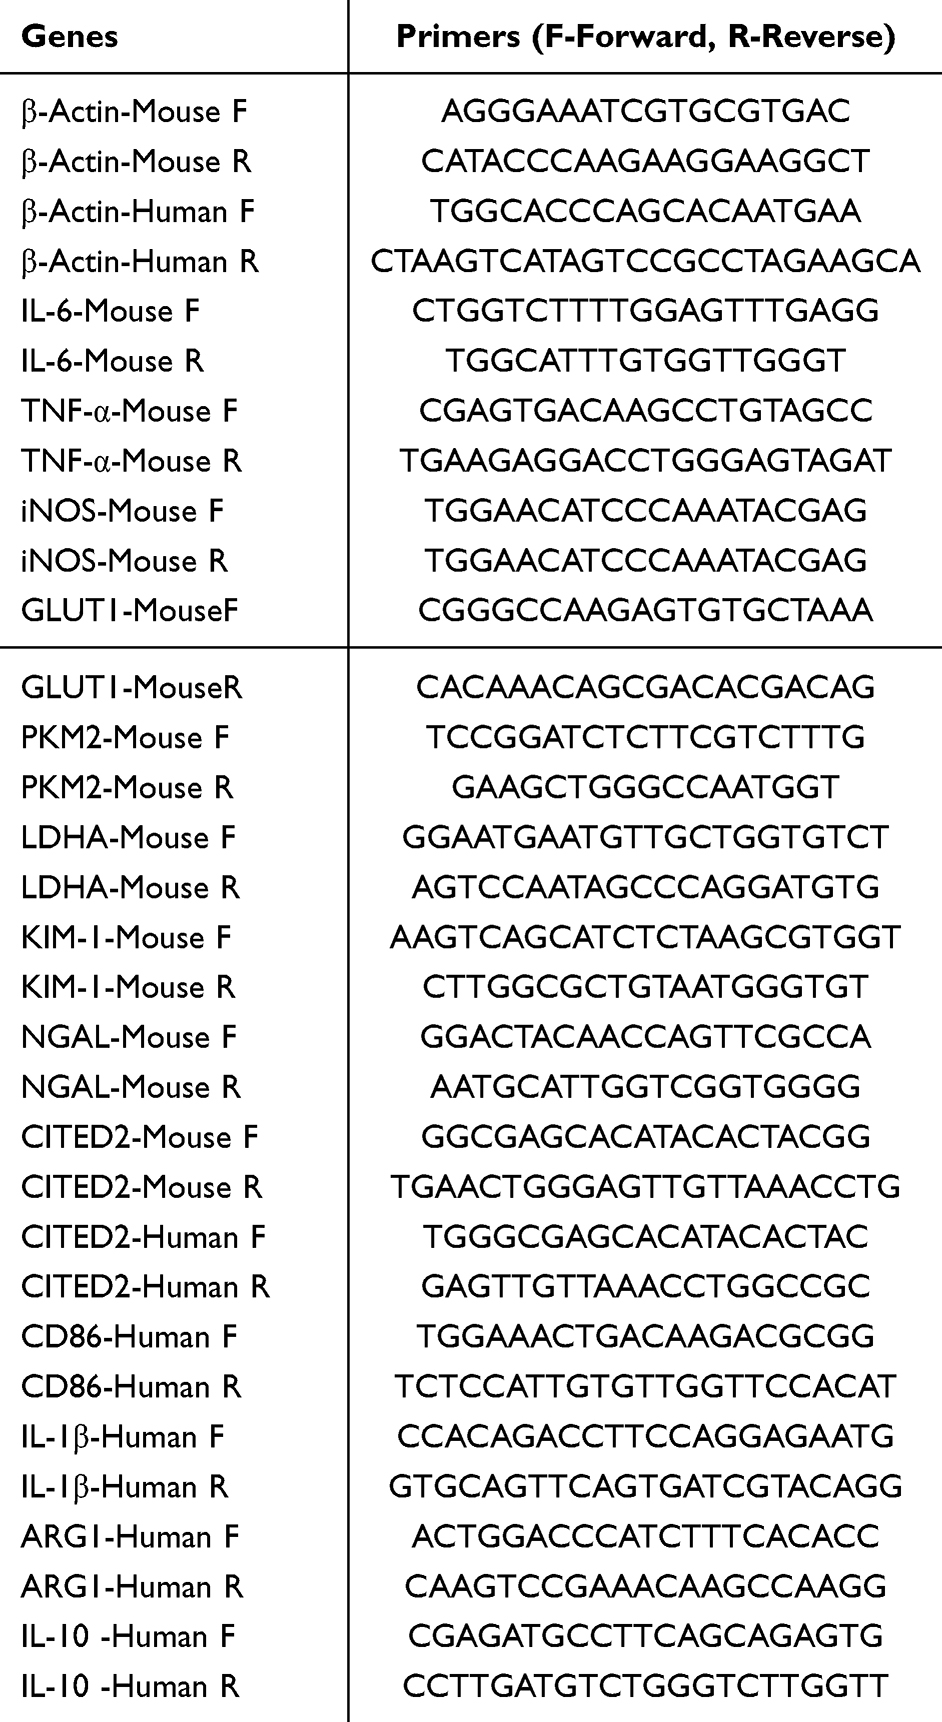 |
Table 1 List of Primer Sequence of Target Gene Used in RT-qPCR |
Hematoxylin-Eosin Staining (HE Staining)
Mouse kidneys were fixed in 4% paraformaldehyde, embedded in paraffin, and sectioned. The sections were then stained using hematoxylin and eosin. After staining, the sections were sealed with neutral resin to preserve the tissue. The structural details of the kidneys were visualized under a microscope to assess histological changes.
Western Blot (WB)
Total protein was extracted from mouse kidney tissue and HK-2 cells using RIPA lysis buffer. The protein concentration of the samples was determined using the BCA Protein Assay Kit (Elabscience, E-BC-K318-M, China). The proteins were then separated by SDS-PAGE and transferred onto PVDF membranes. The membranes were blocked with 5% skim milk before overnight incubation at 4°C with primary antibodies, as listed in Table 2. This was followed by a 1-hour incubation with the corresponding secondary antibodies. Visualization of the proteins was achieved using the ECL chemiluminescence kit (Thermo Fisher Scientific, RJ239676, USA). Quantification of protein expression was performed using ImageJ software.
 |
Table 2 List of Dilutions of Antibodies Used for the Target Protein |
Immunofluorescence
Paraffin-embedded sections of mouse kidney tissues were prepared and subjected to antigen retrieval using sodium citrate buffer solution. To prevent nonspecific binding, sections were incubation with 5% BSA for 30 minutes. Primary antibodies, specifically CITED2 (Affinity, DF2455, China, 1:200), F4/80 (Affinity, DF2789, China, 1:100) and AKAP (Affinity, AF0330, China, 1:150), were applied and incubated overnight at 4°C. This was followed by a 1-hour incubation with the appropriate secondary antibodies. Sections were then stained with DAPI and treated with an anti-fluorescence quencher to block nonspecific fluorescence. Imaging was performed using a fluorescence microscope. ImageJ software was utilized to quantitatively analyze the signal density.
Immunohistochemical
Paraffin-embedded sections of kidney tissue were deparaffinized and rehydrated, followed by antigen retrieval using sodium citrate buffer solution. The sections were blocked with 5% BSA to prevent nonspecific antibody binding. Overnight incubation at 4°C was then performed with primary antibodies: F4/80 (Affinity, DF2789, China, 1:100), IL-6 (Affinity, DF6087, China, 1:100), and CD86 (Bioss, bs-1035R, China, 1:200). This was followed by incubation with secondary antibodies. The slides were subsequently stained with DAB, sealed with neutral gum, and examined under a microscope and images were captured for documentation. Quantitative analysis of the staining intensity was conducted using ImageJ software.
Periodic Acid-Schiff Staining (PAS Staining)
Paraffin-embedded sections of kidney tissue from each experimental group were deparaffinized and exposed in 0.5% periodic acid for 15 minutes, followed by immersion in Schiff Reagent in the dark for 20 minutes. Afterward, sections were counterstained with hematoxylin for 2 minutes. The slides were then routinely dehydrated, cleared, and sealed. Microscopic photographs were captured to observe glycogen deposition in the kidney tissues. Quantitative analysis of the staining was performed using ImageJ software.
Flow Cytometry (FCM)
Flow cytometry was employed to assess apoptosis in HK-2 cells. A total of 1×10⁶ HK-2 cells from each group were seeded in 6-well plates and cultured for 24 hours. The cells were then stained with Annexin V - FITC and incubated in the dark for 15 minutes prior to detection by flow cytometry.
Cell Bioenergy Tests
HK-2 cells were plated in XF96 cell culture plates, and 48 hours post-transfection, bioenergy assessments were conducted. Initially, cells were washed twice with a pre-configured Seahorse assay solution and then incubated at 37°C for 1 hour. Subsequently, reagents necessary for measuring the extracellular acidification rate (ECAR) — glucose (100 mM), oligomycin (100 µM), and 2-deoxy-D-glucose (2-DG, 500 mM) —and the oxygen consumption rate (OCR) — oligomycin (100 µM), FCCP (100 µM), and antimycin A (50 µM) — were added to the respective wells of the probe plate. The plate was then placed in the analyzer for calibration. Following successful calibration, the incubated cells were transferred to the probe plates to measure ECAR and OCR of the cells, facilitating the final determination of the cells’ metabolic activity.
Statistical Analysis
Statistical analyses were conducted using SPSS software (version 26.0). All data are presented as the mean ± standard deviation. One-way analysis of variance (ANOVA) was employed to compare multiple groups, while the Student’s t-test was used for comparisons between two groups. A p-value of less than 0.05 was considered to indicate statistical significance.
Results
Kidney Structure and Function Deterioration in Septic Mice Associated with Increased CITED2 Expression
Relative to the Sham group, serum levels of IL-1β, IL-6 and TNF-α in the sepsis group showed significant increases (Figure 1A–C). Additionally, the serum concentrations of creatinine (CREA) and urea (UREA) in septic mice were significantly higher than those in the Sham group (Figure 1D and E), and there was an upregulation in the gene expression of kidney injury markers (KIM-1 and NGAL) (Figure 1F and G). HE staining revealed disorganized and severely damaged kidney structures, characterized by necrosis and shedding of renal tubular epithelial cells, expansion of the renal interstitial spaces, infiltration by inflammatory cells, and hemorrhage (Figure 1H). In addition, PAS staining further demonstrated destruction of glomerular structures and glycogen deposition in septic mice (Figure 1I). Protein and gene expression levels of CITED2 were also elevated in the kidney tissues of septic mice compared to the Sham group (Figure 1J). Immunofluorescence analysis revealed increased macrophages infiltration and higher CITED2 expression in the renal tissues of septic mice than in the Sham group (Figure 1K).
Figure 1 Continued. Figure 1 Impairment of kidney structure and function in septic mice, characterized by macrophage infiltration and elevated CITED2 expression. (A-C). Serum expression levels of IL-1β, IL-6, and TNF-α in the Sham and Sepsis groups. (D and E). Serum levels of UREA and CREA in the Sham and Sepsis groups. (F and G). Gene expression levels of kidney injury markers (KIM-1 and NGAL) in kidney tissues of the Sham and Sepsis groups. H. HE staining of renal tissues in the Sham and Sepsis groups. (I). PAS staining of renal tissues in both Sham and Sepsis groups. (J). Protein and gene expression levels of CITED2 in renal tissues of the Sham and Sepsis groups. (K). Immunofluorescence staining for CITED2 and F4/80 in renal tissues of the Sham and Sepsis groups. *P < 0.05, **P < 0.01, ***P < 0.001. Significance indicators: ns (no significant difference). Abbreviations: IL-1β, Interleukin-1β; IL-6, Interleukin-6; TNF-α, Tumor necrosis factor-α; PAS, Periodic Acid-Schiff.

CITED2 Regulation of Renal Inflammation in Septic Mice
In CITED2-silenced septic mice, serum levels of CREA and UREA were lower than those in control septic mice (Figure 2A and B). Furthermore, gene expression levels of kidney injury markers KIM-1 and NGAL were reduced in the CITED2-silenced septic mice compared to septic controls (Figure 2C and D). Immunofluorescence staining for the macrophage-specific marker F4/80 revealed high macrophage infiltration in the renal tissues of septic mice. However, this infiltration was notably reduced in the renal tissues of septic mice with CITED2 silencing (Figure 2E). As depicted in Figure 2F, the expression levels of CD86, F4/80 and IL-6 were elevated in the renal tissues of septic mice compared to the Sham group. Conversely, these expression levels were lower in the renal tissues of septic mice with CITED2 silencing. As shown in Figure 2G, the protein and gene expression levels of iNOS, TNF-α, and IL-6 were higher in the renal tissues of septic mice than in the Sham group. Hower, these levels were reduced in the renal tissues of septic mice with CITED2 silencing.
Figure 2 Continued. Figure 2 CITED2 Regulation of kidney inflammation in S-AKI mice models. (A and B). Serum expression levels of UREAand CREA in mice from each group. (C and D). Gene expression levels of kidney injury markers (KIM-1 and NGAL) in kidney tissues of mice from each group. (E). Immunofluorescence staining for F4/80 in renal tissues of mice from each group, illustrating macrophage presence. (F). Immunohistochemical staining for CD86, F4/80, and IL-6 in kidney tissues of mice from each group, indicating levels of inflammatory markers. (G). Protein and gene expression levels of CITED2, iNOS, TNF-α, andIL-6 in renal tissues of mice from each group, reflecting inflammation status. *P < 0.05, **P < 0.01, and ***P < 0.001, denoting statistical relevance of findings. Significance indicators are ns (no significant difference). Abbreviations: NC, Negative Control with empty vector; si-CITED2, CITED2 silencing.

Impact of CITED2 on Renal Metabolic Reprogramming and Kidney Injury via the AKT Signaling Pathway in Septic Mice
HE staining indicated that kidney tissue structure was normalized in septic mice with CITED2 silencing, and silencing of CITED2 was effective in mitigating septic kidney injury (Figure 3A). PAS staining demonstrated that the glomerular structure was preserved and there was no significant glycogen deposition in the CITED2-silenced septic mice (Figure 3B). Immunofluorescence results revealed that the expression level of AKAP was higher in the renal tissues of septic mice than in the Sham group, while it was reduced in the renal tissue of septic mice with CITED2 silencing (Figure 3C). The protein levels of PKM2, GLUT1, LDHA, phosphorylated AKT (p-AKT), and phosphorylated p70S6 kinase (p-p70S6K) were significantly increased in the renal tissues of septic mice compared with the Sham group, while these levels were lower in the renal tissues of CITED2-silenced septic mice (Figure 3D). Additionally, the gene levels of PKM2, GLUT1 and LDHA were also significantly increased in the kidney tissues of septic mice compared with the Sham group, while these levels were lower in the kidney tissues of septic mice with CITED2 silencing (Figure 3E).
Figure 3 Continued. Figure 3 Regulation of glucose metabolism in the kidneys of S-AKI mouse models via CITED2 and AKT signaling pathways. (A). HE staining of kidney tissue in each group. (B). PAS staining performed on renal tissues in each group. (C). Immunofluorescence staining for AKAP in renal tissues of mice from each group. (D). Protein levels of CITED2, PKM2, GLUT1, LDHA, phosphorylated AKT (p-AKT) and phosphorylated p70S6 kinase (p-p70S6K) in renal tissues of mice from each group. (E). Gene expression levels of CITED2, PKM2, LDHA, and GLUT1 in renal tissues of mice from each group. Significance indicators: ns (no significant difference), *P < 0.05, **P < 0.01, ***P < 0.001, denoting statistical relevance of findings. Abbreviations: PAS, Periodic Acid-Schiff; NC, Negative Control with empty vector; si-CITED2, CITED2 silencing.

Regulation of AKT Signaling and Metabolic Reprogramming in TECs by CITED2 Silencing in Septic Cells to Mitigate Acute Kidney Injury
Compared with the control group, apoptosis in LPS-treated HK-2 cells was significantly elevated (Figure 4A). Echoing findings from the sepsis animal model, protein and gene expression levels of CITED2 increased in LPS-treated HK-2 cells (Figure 4B and C). Moreover, LPS treatment heightened the cellular inflammatory response, with marked increases in CD86 and IL-1β expression and decreases in ARG1 and IL-10. However, CITED2 silencing in LPS-treated HK-2 cells led to decreased CD86 and IL-1β levels, attenuating the inflammatory response (Figure 4D).
 |
Figure 4 CITED2 Regulation of inflammatory response in TECs in the S-AKI cell model. (A). Apoptosis levels in cells from the control group compared to the LPS-treated group. (B and C). Protein and gene expression levels of CITED2 in the control and LPS groups demonstrate the direct impact of LPS exposure. (D). Gene expression levels of CD86, IL-1β, ARG1, and IL-10 across all groups, indicating variations in inflammatory and anti-inflammatory markers. *P < 0.05, **P < 0.01, and ***P < 0.001, denoting statistical relevance of the findings. Significance indicators are ns (no significant difference). Abbreviations: LPS, lipopolysaccharide; NC, Negative Control with empty vector; si-CITED2, CITED2 silencing. |
Results from ECAR assays showed that glycolysis, glycolytic capacity, and glycolytic reserve were significantly lower in the LPS group compared to the control group. However, these measures were higher in LPS-treated HK-2 cells with CITED2 silencing than in the LPS group. No significant changes in non-glycolytic acidification were observed among the groups (Figure 5A). Oxygen consumption rate (OCR) data demonstrated that basal respiration, ATP production, maximal respiration, and spare respiratory capacity decreased in the LPS group compared to controls, with no significant changes observed in these parameters in LPS-treated HK-2 cells with CITED2 silencing (Figure 5B). In terms of protein expression, PKM2, GLUT1, LDHA, p-AKT and p-p70S6K levels decreased in the LPS group compared to controls, with no significant changes observed in LPS-treated HK-2 cells with CITED2 silencing (Figure 5C). Additionally, cAMP levels were higher in the LPS group compared to controls, while cAMP levels were reduced in LPS-treated HK-2 cells with CITED2 silencing compared to the LPS group (Figure 5D).
Figure 5 Continued. Figure 5 Regulation of metabolic reprogramming of TECs by CITED2 via AKT signaling pathway in S-AKI cell model.(A). The ECAR across all groups illustrates glycolysis, glycolytic capacity, glycolytic reserve, and non-glycolytic acidification. (B). The OCR measures basal respiration, ATP production, maximal respiration, and spare respiratory capacity in each group. (C). The protein expression levels of CITED2, PKM2, GLUT1, and LDHA highlight metabolic enzyme activity in each group. (D). Protein expression levels of phosphorylated AKT (p-AKT) and phosphorylated p70 S6 kinase (p-p70S6K) in each group, reflecting changes in signaling pathways. (E). Expression levels of cyclic AMP (cAMP) in each group, showing metabolic responses. *P < 0.05, **P < 0.01, and ***P < 0.001, indicating the statistical relevance of the findings. Significance indicators are ns (no significant difference).

Impact of CITED2 Overexpression on AKT Signaling, Metabolic Reprogramming, and Inflammatory Responses in an S-AKI Cell Model
Results from the ECAR assays showed that glycolysis, glycolytic capacity, glycolytic reserve, and non-glycolytic acidification were significantly decreased in LPS-treated HK-2 cells with CITED2 overexpression compared to the LPS group. However, these parameters were significantly increased in the same cells following the addition of SC79, an AKT activator (Figure 6A). OCR measurements indicated that basal respiration, ATP production, maximal respiration, and spare respiratory capacity were reduced in LPS-treated HK-2 cells with CITED2 overexpression compared to the LPS group. Notably, the addition of SC79 significantly enhanced these respiratory parameters in cells with CITED2 overexpression (Figure 6B). As depicted in Figure 6C, compared with the control group, protein expression levels of iNOS and TNF-α were elevated in the LPS group, with further increases observed in LPS-treated HK-2 cells with CITED2 overexpression. The application of SC79 reduced the protein expression levels of iNOS and TNF-α in these cells. Moreover, CITED2 overexpression led to reduced protein expression levels of PKM2, GLUT1 and LDHA in LPS-treated HK-2 cells, while SC79 also increased the protein expression of iNOS and TNF-α in these cells. Additionally, overexpression of CITED2 further decreased the protein expression levels of p-AKT and p-p70S6K in the LPS group, whereas SC79 administration led to an increase in these protein expression levels (Figure 6C).
Figure 6 Continued. Figure 6 The impact of CITED2 overexpression on cellular metabolism and inflammation. (A). The ECAR in each group, showing measures of glycolysis, glycolytic capacity, glycolytic reserve, and non-glycolytic acidification. (B). The OCR for each group, detailing basal respiration, ATP production, maximal respiration, and spare respiratory capacity. (C). Protein expression levels of CITED2, iNOS, TNF-α, PKM2, GLUT1, LDHA, p-AKT, and phosphorylated p70 S6 kinase (p-p70S6K) across all groups. *P < 0.05, **P < 0.01, and ***P < 0.001, which denote the statistical relevance of the findings. Significance indicators include ns (no significant difference). Abbreviations: ECAR, extracellular acidification rate; OCR, oxygen consumption rate; oe-CITED2, CITED2 overexpression.

Discussion
S-AKI represents one of the most critical complications of sepsis, often progressing to renal failure, irreversible damage, chronic renal insufficiency, and ultimately end-stage renal disease.27–29 S-AKI primarily results from filtration dysfunction, which disrupts the regulation of ions, urine and other substances, thereby exacerbating the severity of sepsis and increasing mortality risk.30,31 The severity of S-AKI is intimately linked to the clinical prognosis of patients.
The complex pathophysiological mechanisms underlying S-AKI have hindered early diagnosis and treatment. Reported pathogenesis factors include microcirculation dysfunction, renal cell apoptosis, immune inflammatory responses, and coagulation abnormalities.32–35 Rosales et al36 noted that elevated vasoconstrictive tension in sepsis could precipitate acute kidney injury. Xin et al37 identified platelet count, prothrombin time, and procalcitonin as potential predictors of S-AKI. Furthermore, Wang et al38 confirmed that the increased expression of TLR2 in the renal tissues of septic patients contributes to renal inflammation and subsequent injury. Therefore, S-AKI arises from a multifactorial interaction leading to kidney injury,39 although the precise mechanisms remain incompletely understood. In S-AKI, we observed significant kidney inflammation, severe structural and functional damage to the kidneys, and extensive glycogen deposition. We hypothesize that sepsis induces abnormal glucose metabolism in the kidneys, impairing energy supply and leading to acute kidney injury. This injury disrupts secretion and reabsorption processes, causing electrolyte and acid-base imbalances that exacerbate the inflammatory response and further promote kidney damage.
S-AKI is primarily caused by damage to TECs, leading to decreased secretion and reabsorption functions.40,41 TECs are highly dependent on energy and play a crucial role in renal glucose metabolism, including glucose reabsorption, production and utilization, which is vital for maintaining systemic glucose homeostasis.42,43 When the metabolic reprogramming of TECs fails to meet their metabolic needs, it leads to impaired cell function, survival, repair or regeneration, significantly contributing to the onset and development of S-AKI.44 YANG et al45 and Zhao et al8 reported that pyruvate kinase M2 (PKM2) was significantly increased in activated macrophages during sepsis, inducing the release of high mobility group box 1 protein (HMGB1) from macrophages and enhancing the inflammatory response and oxidative stress in TECs. TECs increase glycolysis compensatorily in response to stress to provide energy for cell survival, repair, and essential functions.46,47 Additionally, glycolysis can also reduce the production of reactive oxygen species (ROS) and enhance resistance to oxidative damage.48 In our study, we observed decreased glycolysis, abnormal oxygen consumption, reduced ATP production, and increased apoptosis in TECs during sepsis, leading to significant renal structural and functional damage. Moreover, substantial glycogen deposition in kidney tissue indicated an imbalance between gluconeogenesis and glucose reabsorption, leading to glucose overload in TECs and exacerbating cell damage.
Some metabolic reprogramming has been linked to abnormal insulin sensitivity.49 CITED2, acting as a signal transduction molecule for glucagon and insulin, regulates energy metabolism by modulating inflammation and insulin sensitivity.50,51 It also serves as a transcription cofactor, regulating the transcription of metabolism-related proteins.22 Thus, CITED2 affects the expression of glycolysis-related proteins and genes, influencing glucose uptake and utilization. Kunkemoeller et al18 found that elevated CITED2 in the vascular system of patients with type 2 diabetes inhibited endothelial insulin signaling through the PI3K/Akt pathway, while the loss of CITED2 enhanced insulin signaling. Conversely, Sakai et al21 reported that increased CITED2 expression in mouse liver promoted gluconeogenesis. CITED2 is responsive to hypoxia, LPS, growth factors, and proinflammatory cytokines.52–54
Although CITED2 has been shown to reduce inflammation in other studies,51,54 our study found that CITED2 elevation during sepsis drives glucose metabolic dysregulation by upregulating gluconeogenesis and glycogen storage, while downregulating glycolysis. This shift results in energy shortages, impaired TEC repair, and kidney injury. Furthermore, we found that renal tissue damage in septic mice was closely associated with macrophage infiltration. The presence of M1 macrophages and their secretion of inflammatory factors increased, whereas M2 macrophages and their secretion decreased. Inhibition of CITED2 alleviated the inflammatory response in sepsis, while increased CITED2 expression exacerbated it. Our findings suggest that CITED2’s promotion of metabolic reprogramming in TECs led to damage and exacerbated renal inflammation. Interestingly, the discrepancies between our findings and prior studies reporting CITED2 as an anti-inflammatory mediator may stem from different cellular and pathological backgrounds. In our S-AKI model, CITED2 promoted metabolic reprogramming in TECs leading to glucose overload, energy imbalance, and kidney injury, ultimately overshadowing any anti-inflammatory effects. The proinflammatory consequences of this metabolic dysfunction in TECs appear to outweigh the anti-inflammatory properties of CITED2 observed in other systems, underlining the multifaceted role of CITED2 in sepsis. Further studies are needed to elucidate the specific pathways by which CITED2 affects TECs metabolism and inflammation, especially in the context of S-AKI. This study further supports the role of CITED2 in mediating TECs metabolic reprogramming via the AKT signaling pathway, leading to TECs injury and aggravated inflammatory response, leading to kidney injury. Targeting CITED2 to restore TECs metabolism and ATP production may be a novel therapeutic approach to alleviate S-AKI.
Our study has several limitations. First, while we observed that S-AKI may result from the metabolic reprogramming of TECs by CITED2 leading to kidney injury, we did not specifically identify which aspects of glucose metabolisms are predominantly affected by CITED2. Secondly, the specific mechanisms through which CITED2 influences the metabolic reprogramming of TECs via AKT signaling pathway require further investigation.
Conclusion
In this study, we demonstrated that the mechanism underlying S-AKI involves CITED2 affecting the metabolic reprogramming of TECs via the AKT signaling pathway. This influence leads to TECs injury, exacerbates the inflammatory response, and ultimately results in acute kidney injury. These findings provide new insights into the pathogenesis of S-AKI and offer potential targets and strategies for its prevention and treatment.
Data Sharing Statement
Data supporting the findings of this study are available from the corresponding author upon reasonable request.
Acknowledgments
The authors would like to thank their team members for their suggestions and assistance in this study.
Author Contributions
All authors made a significant contribution to the work reported, whether that is in the conception, study design, execution, acquisition of data, analysis and interpretation, or in all these areas; took part in drafting, revising or critically reviewing the article; gave final approval of the version to be published; have agreed on the journal to which the article has been submitted; and agree to be accountable for all aspects of the work.
Funding
This work was supported by the Provincial Financial Special Project (Grant numbers BPB-2023ZK), Ganzhou Municipal “Science and Technology+National Regional Medical Center” Joint Project, Jiang Xi province (Grant numbers 2022-YB1456 and 2023-LNS17415) and National Natural Science Foundation of China (Grant numbers 82460377).
Disclosure
We declare that we have no conflict of interest.
References
1. Ahn YH, Yoon SM, Lee J, et al. Early Sepsis-Associated Acute Kidney Injury and Obesity. JAMA Netw Open. 2024;7(2):e2354923. doi:10.1001/jamanetworkopen.2023.54923
2. Balkrishna A, Sinha S, Kumar A, et al. Sepsis-mediated renal dysfunction: pathophysiology, biomarkers and role of phytoconstituents in its management. Biomed Pharmacothe. 2023;165:115183. doi:10.1016/j.biopha.2023.115183
3. Legrand M, Bagshaw SM, Bhatraju PK, et al. Sepsis-associated acute kidney injury: recent advances in enrichment strategies, sub-phenotyping and clinical trials. Critical Care. 2024;28(1):92. doi:10.1186/s13054-024-04877-4
4. Wang M, Wang X, Zhu B, et al. The effects of timing onset and progression of AKI on the clinical outcomes in AKI patients with sepsis: a prospective multicenter cohort study. Renal Failure. 2023;45(1):2138433. doi:10.1080/0886022X.2022.2138433.
5. Keller SA, Chen Z, Gaponova A, et al. Drug discovery and therapeutic perspectives for proximal tubulopathies. Kidney Int. 2023;104(6):1103–1112. doi:10.1016/j.kint.2023.08.026
6. Verschuren EHJ, Castenmiller C, Peters DJM, et al. Sensing of tubular flow and renal electrolyte transport. Nat Rev Nephrol. 2020;16(6):337–351. doi:10.1038/s41581-020-0259-8
7. Wang J-N, Wang F, Ke J, et al. Inhibition of METTL3 attenuates renal injury and inflammation by alleviating TAB3 m6A modifications via IGF2BP2-dependent mechanisms. Sci Trans Med. 2022;14(640):eabk2709. doi:10.1126/scitranslmed.abk2709
8. Zhao ZB, Marschner JA, Iwakura T, et al. Tubular Epithelial Cell HMGB1 Promotes AKI-CKD Transition by Sensitizing Cycling Tubular Cells to Oxidative Stress: a Rationale for Targeting HMGB1 during AKI Recovery. J Am Soc Nephrol. 2023;34(3):394–411. doi:10.1681/ASN.0000000000000024
9. JSY L, Robertson H, Trinh K, et al. Tolerogenic dendritic cells protect against acute kidney injury. Kidney Int. 2023;104(3):492–507. doi:10.1016/j.kint.2023.05.008
10. Lok SWY, Yiu WH, Zou Y, et al. Tubulovascular protection from protease-activated receptor-1 depletion during AKI-to-CKD transition. Nephrol Dial Transplant. 2023;38(10):2232–2247. doi:10.1093/ndt/gfad051
11. Li Z, Lu S, Li X. The role of metabolic reprogramming in tubular epithelial cells during the progression of acute kidney injury. CMLS. 2021;78(15):5731–5741. doi:10.1007/s00018-021-03892-w
12. Lewy PR, Quintanilla A, Levin NW, et al. Renal energy metabolism and sodium reabsorption. Ann Rev Med. 1973;24(1):365–384. doi:10.1146/annurev.me.24.020173.002053
13. Miguel V, Tituaña J, Herrero JI, et al. Renal tubule Cpt1a overexpression protects from kidney fibrosis by restoring mitochondrial homeostasis. J Clin Invest. 2021;131(5). doi:10.1172/JCI140695.
14. Zhang L, Tian M, Zhang M, et al. Forkhead Box Protein K1 Promotes Chronic Kidney Disease by Driving Glycolysis in Tubular Epithelial Cells. Adv Sci. 2024;11(36):e2405325. doi:10.1002/advs.202405325
15. Hou Y, Tan E, Shi H, et al. Mitochondrial oxidative damage reprograms lipid metabolism of renal tubular epithelial cells in the diabetic kidney. CMLS. 2024;81(1):23. doi:10.1007/s00018-023-05078-y
16. Chen W, Shen Y, Fan J, et al. IL-22-mediated renal metabolic reprogramming via PFKFB3 to treat kidney injury. Clin Transl Med. 2021;11(2):e324. doi:10.1002/ctm2.324
17. Wiggins DA, Maxwell JN, Nelson DE. Exploring the role of CITED transcriptional regulators in the control of macrophage polarization. Front Immunol. 2024;15:1365718. doi:10.3389/fimmu.2024.1365718
18. Kunkemoeller B, Chen K, Lockhart SM, et al. The transcriptional coregulator CITED2 suppresses expression of IRS-2 and impairs insulin signaling in endothelial cells. Am J Physiol Endocrinol Metab. 2021;321(2):E252–E259. doi:10.1152/ajpendo.00435.2020
19. Shen S, Wang J-W, Zheng B-H, et al. The lnc-CITED2-2:1 inhibits metastasis via inhibiting CITED2 and epithelial-mesenchymal transition in gallbladder cancer. Clin Transl Med. 2020;10(2):e116. doi:10.1002/ctm2.116
20. Chen Z, Chen H-X, Hou H-T, et al. Identification and Functional Verification of CITED2 Gene Promoter Region in Patients with Patent Ductus Arteriosus. Int J Mol Sci. 2023;24(22):16204. doi:10.3390/ijms242216204
21. Sakai M, Tujimura-Hayakawa T, Yagi T, et al. The GCN5-CITED2-PKA signalling module controls hepatic glucose metabolism through a cAMP-induced substrate switch. Nat Commun. 2016;7(1):13147. doi:10.1038/ncomms13147
22. Li Q, Hakimi P, Liu X, et al. Cited2, a transcriptional modulator protein, regulates metabolism in murine embryonic stem cells. J Biol Chem. 2014;289(1):251–263. doi:10.1074/jbc.M113.497594
23. Sakai M, Matsumoto M, Tujimura T, et al. CITED2 links hormonal signaling to PGC-1α acetylation in the regulation of gluconeogenesis. Nat Med. 2012;18(4):612–617. doi:10.1038/nm.2691
24. Manning BD, Cantley LC. AKT/PKB signaling: navigating downstream. Cell. 2007;129(7):1261–1274. doi:10.1016/j.cell.2007.06.009
25. Cheng J, Huang Y, Zhang X, et al. TRIM21 and PHLDA3 negatively regulate the crosstalk between the PI3K/AKT pathway and PPP metabolism. Nat Commun. 2020;11(1):1880. doi:10.1038/s41467-020-15819-3
26. Whiteman EL, Cho H, Birnbaum MJ. Role of Akt/protein kinase B in metabolism. Trend endocrinol metabol. 2002;13(10):444–451. doi:10.1016/S1043-2760(02)00662-8
27. White KC, Serpa-Neto A, Hurford R, et al. Sepsis-associated acute kidney injury in the intensive care unit: incidence, patient characteristics, timing, trajectory, treatment, and associated outcomes. A multicenter, observational study. Inten Care Med. 2023;49(9):1079–1089. doi:10.1007/s00134-023-07138-0
28. Poston JT, Koyner JL. Sepsis associated acute kidney injury. BMJ. 2019;364:k4891. doi:10.1136/bmj.k4891
29. Peerapornratana S, Manrique-Caballero CL, Gómez H, et al. Acute kidney injury from sepsis: current concepts, epidemiology, pathophysiology, prevention and treatment. Kidney Int. 2019;96(5):1083–1099. doi:10.1016/j.kint.2019.05.026
30. Yajnik V, Maarouf R. Sepsis and the microcirculation: the impact on outcomes. Curr Opin Anaesthesiol. 2022;35(2):230–235. doi:10.1097/ACO.0000000000001098
31. Lumlertgul N, Hall A, Camporota L, et al. Clearance of inflammatory cytokines in patients with septic acute kidney injury during renal replacement therapy using the EMiC2 filter (Clic-AKI study). Critical Care. 2021;25(1):39. doi:10.1186/s13054-021-03476-x
32. Li B, Xia Y, Mei S, et al. Histone H3K27 methyltransferase EZH2 regulates apoptotic and inflammatory responses in sepsis-induced AKI. Theranostics. 2023;13(6):1860–1875. doi:10.7150/thno.83353
33. Nusshag C, Wei C, Hahm E, et al. suPAR links a dysregulated immune response to tissue inflammation and sepsis-induced acute kidney injury. JCI Insight. 2023;8(7). doi:10.1172/jci.insight.165740.
34. Luxen M, Zwiers PJ, Jongman RM, et al. Sepsis induces heterogeneous transcription of coagulation- and inflammation-associated genes in renal microvasculature. Thrombosis Res. 2024;237:112–128. doi:10.1016/j.thromres.2024.03.014
35. Ergin B, Kapucu A, Demirci-Tansel C, et al. The renal microcirculation in sepsis. Nephrol Dial Transplant. 2015;30(2):169–177. doi:10.1093/ndt/gfu105
36. Rosales TO, Horewicz VV, Ferreira MA, et al. Dynamics of GRK2 in the kidney: a putative mechanism for sepsis-associated kidney injury. Clin Sci. 2021;135(20):2341–2356. doi:10.1042/CS20210462
37. Xin Q, Xie T, Chen R, et al. A Predictive Model Based on Inflammatory and Coagulation Indicators for Sepsis-Induced Acute Kidney Injury. J Inflamm Res. 2022;15:4561–4571. doi:10.2147/JIR.S372246
38. Wang Q-L, Xing W, Yu C, et al. ROCK1 regulates sepsis-induced acute kidney injury via TLR2-mediated endoplasmic reticulum stress/pyroptosis axis. Mol Immunol. 2021;136:138. doi:10.1016/j.molimm.2021.06.006
39. Juan C-X, Mao Y, Cao Q, et al. Exosome-mediated pyroptosis of miR-93-TXNIP-NLRP3 leads to functional difference between M1 and M2 macrophages in sepsis-induced acute kidney injury. J Cell Mol Med. 2021;25(10):4786–4799. doi:10.1111/jcmm.16449
40. Jian Y, Yang Y, Cheng L, et al. Sirt3 mitigates LPS-induced mitochondrial damage in renal tubular epithelial cells by deacetylating YME1L1. Cell Proliferation. 2023;56(2):e13362. doi:10.1111/cpr.13362
41. Cantaluppi V, Medica D, Quercia AD, et al. Perfluorocarbon solutions limit tubular epithelial cell injury and promote CD133+ kidney progenitor differentiation: potential use in renal assist devices for sepsis-associated acute kidney injury and multiple organ failure. Nephrol Dial Transplant. 2018;33(7):1110–1121. doi:10.1093/ndt/gfx328
42. Zhao X-P, Chang S-Y, Pang Y, et al. Hedgehog interacting protein activates sodium-glucose cotransporter 2 expression and promotes renal tubular epithelial cell senescence in a mouse model of type 1 diabetes. Diabetologia. 2023;66(1):223–240. doi:10.1007/s00125-022-05810-6
43. Legouis D, Ricksten S-E, Faivre A, et al. Altered proximal tubular cell glucose metabolism during acute kidney injury is associated with mortality. Nat Metab. 2020;2(8):732–743. doi:10.1038/s42255-020-0238-1
44. Zhao L, Hao Y, Tang S, et al. Energy metabolic reprogramming regulates programmed cell death of renal tubular epithelial cells and might serve as a new therapeutic target for acute kidney injury. Front Cell Develop Biol. 2023;11:1276217. doi:10.3389/fcell.2023.1276217
45. Yang L, Xie M, Yang M, et al. PKM2 regulates the Warburg effect and promotes HMGB1 release in sepsis. Nat Commun. 2014;5(1):4436. doi:10.1038/ncomms5436
46. Li J, Shi X, Chen Z, et al. Aldehyde dehydrogenase 2 alleviates mitochondrial dysfunction by promoting PGC-1α-mediated biogenesis in acute kidney injury. Cell Death Dis. 2023;14(1):45. doi:10.1038/s41419-023-05557-x
47. Xie J, Zhong F, Guo Z, et al. Hyperinsulinemia impairs the metabolic switch to ketone body utilization in proximal renal tubular epithelial cells under energy crisis via the inhibition of the SIRT3/SMCT1 pathway. Front Endocrinol. 2022;13:960835. doi:10.3389/fendo.2022.960835
48. Rauckhorst AJ, Vasquez Martinez G, Mayoral Andrade G, et al. Tubular mitochondrial pyruvate carrier disruption elicits redox adaptations that protect from acute kidney injury. Mol Metabol. 2024;79:101849. doi:10.1016/j.molmet.2023.101849
49. Lin H-Y, Weng S-W, Shen F-C, et al. Abrogation of Toll-Like Receptor 4 Mitigates Obesity-Induced Oxidative Stress, Proinflammation, and Insulin Resistance Through Metabolic Reprogramming of Mitochondria in Adipose Tissue. Antioxid Redox Signal. 2020;33(2):66–86. doi:10.1089/ars.2019.7737
50. Jia G, Sowers JR. Targeting CITED2 for Angiogenesis in Obesity and Insulin Resistance. Diabetes. 2016;65(12):3535–3536. doi:10.2337/dbi16-0052
51. Zafar A, Ng HP, Chan ER, et al. Myeloid-CITED2 Deficiency Exacerbates Diet-Induced Obesity and Pro-Inflammatory Macrophage Response. Cells. 2023;12(17):2136. doi:10.3390/cells12172136
52. Sun HB, Zhu YX, Yin T, et al. MRG1, the product of a melanocyte-specific gene related gene, is a cytokine-inducible transcription factor with transformation activity. Proc Natl Acad Sci USA. 1998;95(23):13555–13560. doi:10.1073/pnas.95.23.13555
53. van den Beucken T, Magagnin MG, Savelkouls K, et al. Regulation of Cited2 expression provides a functional link between translational and transcriptional responses during hypoxia. Radiother Oncol. 2007;83(3):346–352. doi:10.1016/j.radonc.2007.04.026
54. Kim G-D, Das R, Rao X, et al. CITED2 Restrains Proinflammatory Macrophage Activation and Response. Mol Cell Biol. 2018;38(5). doi:10.1128/MCB.00452-17.
 © 2024 The Author(s). This work is published and licensed by Dove Medical Press Limited. The
full terms of this license are available at https://www.dovepress.com/terms.php
and incorporate the Creative Commons Attribution
- Non Commercial (unported, 3.0) License.
By accessing the work you hereby accept the Terms. Non-commercial uses of the work are permitted
without any further permission from Dove Medical Press Limited, provided the work is properly
attributed. For permission for commercial use of this work, please see paragraphs 4.2 and 5 of our Terms.
© 2024 The Author(s). This work is published and licensed by Dove Medical Press Limited. The
full terms of this license are available at https://www.dovepress.com/terms.php
and incorporate the Creative Commons Attribution
- Non Commercial (unported, 3.0) License.
By accessing the work you hereby accept the Terms. Non-commercial uses of the work are permitted
without any further permission from Dove Medical Press Limited, provided the work is properly
attributed. For permission for commercial use of this work, please see paragraphs 4.2 and 5 of our Terms.