")
Back to Journals » International Journal of Nanomedicine » Volume 20
Co-Assembled Nanoparticles Comprising Sorafenib and Hederagenin Derivative for Enhanced Anti-Hepatic Fibrosis Activity
Authors Lu M, Dai Z, Lin Y, Sun C, Li S, Guo Z, Liu Y, Liu X, Li S, Liu R, Xu B, Lei H
Received 31 December 2024
Accepted for publication 18 June 2025
Published 18 July 2025 Volume 2025:20 Pages 9135—9153
DOI https://doi.org/10.2147/IJN.S512005
Checked for plagiarism Yes
Review by Single anonymous peer review
Peer reviewer comments 3
Editor who approved publication: Dr Yan Shen
Mingjun Lu,* Ziqi Dai,* Yixuan Lin, Changsheng Sun, Shuo Li, Zhuoqian Guo, Yongji Liu, Xiaobi Liu, Shanlan Li, Runping Liu, Bing Xu, Haimin Lei
School of Chinese Pharmacy, Beijing University of Chinese Medicine, Beijing, 100102, People’s Republic of China
*These authors contributed equally to this work
Correspondence: Haimin Lei, Email [email protected] Bing Xu, Email [email protected]
Background: Sorafenib, a multi-kinase inhibitor, has emerged as a promising therapeutic agent for liver fibrosis due to its ability to target key signaling pathways involved in HSC activation. However, it may inadvertently exacerbate inflammatory responses at certain doses. Recent findings suggest that targeting the STING signaling pathway may provide an alternative strategy for slowing the progression of fibrosis.
Methods: We synthesized liver-targeted co-assembled SHG nanoparticles (SHG NPs) that incorporate sorafenib and a hederagenin derivative (Hed), which acted as a STING pathway inhibitor. SHG NPs are preferentially endocytosed by hepatocytes via DSPE-PEG-Gal-mediated ASGPR targeting. After release from hepatocytes, sorafenib diffuses into adjacent HSCs through concentration gradients, effectively inhibiting PDGFR/TGF-β signaling. Hed exhibits dual-targeting characteristics: (1) its STING inhibitory activity selectively acts on macrophage-mediated inflammation; (2) the enhanced phagocytic capacity of Kupffer cells in fibrotic livers promotes non-specific uptake. This spatiotemporal release pattern, combined with pathway-specific pharmacodynamics, ensures synergistic anti-fibrotic effects.
Results: In this study, SHG NPs have been successfully formulated with well-defined nanostructures and uniform sizes (115.1 nm). In vitro Sirius Red staining demonstrated that SHG NPs inhibited collagen deposition by 57.5 ± 2.3%, significantly higher than the inhibition observed with sorafenib alone (24.8 ± 1.8%). Furthermore, cell uptake studies confirmed enhanced uptake of SHG NPs in ASGPR-overexpressing cell lines, which was attributed to the presence of galactose on their surface. Additionally, in vivo anti-liver fibrosis activity experiments further confirmed that SHG NPs exhibit superior therapeutic efficacy compared to sorafenib.
Conclusion: Our research indicates that formulating sorafenib with a STING pathway inhibitor into liver-targeted nanoparticles represents a potentially effective strategy for the treatment of liver fibrosis.
Keywords: liver fibrosis, co-assembly, sorafenib, STING pathway, hederagenin
Introduction
Liver fibrosis is a serious pathological condition characterized by the excessive accumulation of extracellular matrix proteins within liver tissue, which leads to structural damage and compromised liver function.1,2 This pathological process is commonly caused by chronic liver diseases, including viral hepatitis,3 alcoholic liver disease,4,5 and non-alcoholic fatty liver disease.6–8 Key factors contributing to chronic liver injury include inflammation,9 oxidative stress,10,11 and metabolic dysfunction.12 Therefore, there is an urgent need to explore innovative strategies for alleviating liver fibrosis and its associated complications.13,14 The advancement of innovative therapeutic strategies aimed at targeting fibrosis while simultaneously promoting regeneration and repair is crucial for enhancing patient outcomes and mitigating the burden of liver disease.2,13,15
The potent multi-kinase inhibitor sorafenib (Sor) has demonstrated potential as an anti-fibrotic therapeutic agent due to its ability to target critical pathways involved in the initiation and progression of fibrosis,16–19 including the transforming growth factor-beta (TGF-β)20–23 and platelet-derived growth factor receptor (PDGFR) signaling pathways.24–27 However, challenges arise from the sole use of Sor for liver fibrosis treatment. Its anti-inflammatory effects are not primary therapeutic mechanism, and at certain doses, it may even upregulate inflammation-related pathways,28–34 undermining its anti-fibrotic efficacy. Therefore, identifying effective combination strategies is essential to optimize Sor’s therapeutic efficacy in the context of liver fibrosis.
The STING pathway, a crucial component of the innate immune system, has emerged as a promising pathway for inflammation and autoimmune disease therapy.35,36 Hederagenin (HE) is a natural oleanane-type pentacyclic triterpene that has been shown to inhibit STING/NF-κB signaling, thereby disrupting the initiation of the deleterious inflammatory cascade.37,38 Furthermore, recent studies have shown that inhibiting the STING pathway in macrophages can effectively reduce TGF-β secretion, offering a potential strategy for mitigating liver fibrosis.39 These studies suggest that the combination of hederagenin derivative as a STING pathway inhibitor with Sor may yield unexpected therapeutic effects.
Therefore, we propose a novel anti-fibrosis strategy that encompasses the formulation of Sor and hederagenin derivative (Hed) into liver-targeted nanoparticles (SHG NPs). For this purpose, we selected the polymer DSPE-PEG-Gal (1,2-distearoyl-sn-glycero-3-phosphoethanolamine-polyethylene glycol-galactose) to stabilize the co-assembled structures, owing to its demonstrated efficacy in facilitating the targeted delivery of nanoparticles to the liver via efficient binding with the asialoglycoprotein receptor (ASGPR). The derivative Hed was selected for this study due to its superior inhibitory activity and its ability to readily co-assemble with sorafenib to form stable nanostructures. The selection of Sor and Hed was primarily driven by considerations of both biological mechanisms and co-assembly mechanisms. Firstly, in terms of biological mechanisms, activated HSCs promote macrophage polarization toward a profibrotic phenotype via Smad3 phosphorylation, while STING activation in macrophages amplifies TGF-β production through the NF-κB/IL-6 axis. Sor inhibits HSC activation and collagen deposition by targeting PDGFR and TGF-β signaling, and Hed reduces TGF-β secretion by suppressing the STING/NF-κB pathway in macrophages. SHG NPs effectively disrupt this cycle by targeting both cell types simultaneously. On the other hand, neither Sor nor Hed can form a stable nanodispersion individually. However, when co-formulated, they can self-assemble into stable nanostructures. By leveraging the unique properties of liver-targeted nanoparticles for precise drug delivery, this approach has significant potential to enhance the efficacy of anti-fibrotic therapies while minimizing adverse effects. The development of this co-delivery system represents a notable advancement in liver fibrosis therapy, offering a promising strategy to address the complexities of fibrotic pathogenesis and treatment challenges.
Materials and Methods
Materials
All analytical grade reagents and solvents were obtained from commercial vendors and were used without any further purification. Sorafenib (Ark Pharma Scientific, Ltd), Hederagenin (Spring Autumn Biotechnology Co., Nanjing, China), H151 (Shanghai Yuanye Bio-Technology Co., Ltd), DMXAA (Ark Pharma Scientific, Ltd), DMEM medium (containing 4.5 g/L glucose, Gibco), Column chromatography was carried out on silica gel (200 ~ 300 mesh) (Qingdao Haiyang Chemical Co., Qingdao, China). NMR spectra were recorded on a Bruker 400 spectrometer (Bruker, Germany); chemical shifts (δ) were given in ppm and coupling constants (J) in Hz with tetramethylsilane (TMS) as an internal standard. HR-MS data was recorded with the aid of a Thermo Scientific TM LTQ Orbitrap XL hybrid FTMS instrument (Thermo Technologies, New York, NY, USA). RAW264.7, HepG2, JS-1 and AML12 cell lines were purchased from the Cell Resource Center Chinese Academy of Medical Sciences & Peking Union Medical College (National Infrastructure of Cell Line Resource).
Construction of the IFN-β Luciferase Reporter Gene Model and Evaluation of Its Activity
A549 cells were inoculated in 96-well plates at a density of 5×10⁴ cells per well. Complete medium containing a specific concentration of the STING-activating inducer DMXAA was used in the control group and drug administration group. After 24 h of incubation, the medium of the drug administration group contained different concentrations of the hederagenin derivative. The expression of IFN-β was quantitatively assessed by measuring the expression of fluorescein to characterize the inhibitory effect of the derivatives on the STING pathway.
Preparation of SHG NPs
SHG NPs were fabricated using a nano-precipitation method. Firstly, Sor, Hed and DSPE-PEG-Gal at a specific molar ratio of 1: 5: 1.2 were dissolved in a mixed solvent of tetrahydrofuran and ethanol (2:3). The mixed solution was introduced into deionized water on a magnetic stirrer operating at 1000 rpm using a micropipette. Once the system stabilizes, the organic solvent will be thoroughly removed through vacuum rotary evaporation, followed by dilution with deionized water to achieve the target concentration.
Characterization of SHG NPs
After the preparation of SHG NPs, they were dispersed in deionized water (pH 7.0, 25°C). Different concentrations were prepared for various characterization experiments (powder after lyophilization was used in some experiments). The nanoparticle suspension was not subjected to ultrasonication or filtration before testing, and the measurements were directly performed using the uniformly dispersed solution. The particle size of the SHG NPs was determined using a Malvern laser particle size analyzer (Zetasizer Nano-ZS 90, Malvern). The morphology of the SHG NPs was visualized using scanning electron microscopy (SEM, ZEISS SUPRA55, Germany) and transmission electron microscopy (JOEL JEM-2100F, Japan). UV-vis spectra were acquired using a UV-vis spectrophotometer (HITACHI UH5300, Japan) within the range of 190 ~ 600 nm. Fluorescence spectra were recorded on a fluorescence spectrophotometer (F97pro TY2021007864) with an excitation wavelength of 287 nm. FT-IR spectra were obtained using a Fourier-transform infrared spectrometer (Nicolet iS10, Thermo, USA) covering the range of 4000 ~ 400 cm−1. 1H-NMR spectroscopy (Avance IIIHD 400 MHz spectrometer, Bruker, Germany) was utilized to confirm the formation mechanism between Sor and Hed. The drug encapsulation efficiency (EE) was calculated by (loaded drug/drug added) × 100. Loading capacity (LC) was calculated by (loaded drug/nanoparticle weight) × 100.
Drug Release
For assessing how drugs are released, 1 mL of SHG nanoparticles were introduced into a dialysis membrane (MWCO 1000 Da) to undergo dialysis against 40 mL of PBS buffer (PH=7.4) at 37°C. As planned, 2 mL of the buffer solution was extracted for HPLC analysis, followed by the addition of 2 mL of a new PBS buffer.
Molecular Dynamic Simulation
MD simulations were performed using the GRMOACS 2020.6 software package. The visualization of the structures was performed with VMD software. The molecules were mixed in a cubic box with periodic boundary conditions using the PACKMOL software package. The detailed steps can be found in the Supporting Methods.
In vitro Cytotoxicity Assay
JS-1 cells were incubated in 96-well plates at a density of 5×10³ cells per well, and the drug was administered 24 h later. Then, 100 μL of medium containing different concentrations of Sor, Hed, S-H, and SHG NPs was added to each well in the drug-dosing group, an equal volume of medium without drug was added to the control group, and no medium was added to the blank wells. Then, 20 μL of MTT (5 mg·mL−1) was added to test the viability of the cells at 48 h after drug administration. Following, the absorbance values were measured at 490 nm (Multiskan GO Multifunctional Enzyme Labeler, Thermo Electron Scientific Instruments Ltd., Finland), and the inhibition rate was calculated according to the following formula.

In vitro Ability of Inhibit Collagen Production Assay
The modelling agent used in the collagen deposition model was TGF-β1, and the medium master mix containing TGF-β1 at a concentration of 10 ng·mL−1 was prepared. JS-1 cells were inoculated in 96-well plates at a density of 5×10³ cells per well, and the drug was administered 24 h later. The cells were fixed in methanol overnight at 48 h after drug administration, 0.1% Sirius Scarlet Staining Solution was added, and the cells were stained for 1 h at room temperature in the dark. The absorbance values were measured at 540 nm, and the relative collagen concentrations were calculated according to the following formula.

Cell Targeting Ability
HepG2 cells were inoculated at a density of 7×10⁴ cells per well in laser confocal dishes 1 cm in diameter, with a volume of 1 mL of added medium, and administered 16 h later. The cells were divided into an administration group (with direct addition of FITC-containing SHG NPs) and a galactose pre-saturated group (incubation with galactose for 30 min to pre-occupy the ASGPR receptor, followed by the addition of FITC-containing SHG NPs).
In laser confocal dishes, JS-1 cells and AML12 cells were dispersed at a concentration of 7×10⁴ in each well, followed by the addition of 1 mL of the medium and its administration after 24 hours using free FITC and SHG NPs loaded with FITC.
After incubation, the cells were washed 3 times with PBS and 4% paraformaldehyde fixative was added. The mixture was fixed for 15 min at room temperature and protected from light. Then, the cells were stained with DAPI nuclear staining solution (Beijing Paragon Bio-technology Co.) for 15 min. Next, the laser confocal dish was placed under a laser confocal microscope (Leica TCSSP8, Leica, Germany) for observation.
Animal Experiments
A total of 48 healthy male 8-week-old C57BL/6J mice, weighing between 20.0 ~ 25.0 g, were purchased from Sibeifu (Beijing) Biotechnology Co with SPF grade. After 1 week of acclimatization, all the mice were randomly divided into 8 groups, each consisting of 6 mice. The groups were as follows: control group, model group, Sor group (5 mg·kg−1), Hed group (41 mg·kg−1), S-H group (5 mg·kg−1 of Sor and 41 mg·kg−1 of Hed), SHG NPs-L group (2.5 mg·kg−1), SHG NPs-M group (5 mg·kg−1), and SHG NPs-H group (7.5 mg·kg−1). The control group received oral gavage of olive oil twice a week, while the remaining groups received oral gavage of olive oil containing 10% CCl4, which induced liver fibrosis continuously for 8 weeks. Drug administration started at the 5th week. Mice in each group were injected with the drug via the tail vein.
The animal study proposal was approved by the ethics committee of Beijing University of Chinese Medicine with the permit number 1121043000408. All animal experimental procedures were performed according to the Regulations for the Administration of Affairs Concerning Experimental Animals approved by the State Council of the People’s Republic of China.
RNA Sequencing (RNA-Seq)
Liver tissues from the control, model and SHG NPs groups were collected for analysis. The methods were supplied in the Supporting Methods.
Statistical Analysis
All the statistical analyses were performed with GraphPad Prism 8.0 software and the results were expressed as mean ± SD. Statistical significance was calculated by one-way ANOVA analysis among multiple groups. *P < 0.05, **P < 0.01 and ***P < 0.001 were considered statistically significant.
Results and Discussion
Synthesis, Characterization and Evaluation of the Effects of Hederagenin Derivative (Hed) on the STING Pathway
Hed was synthesized following the synthetic methods and routes outlined in Scheme 1. The chemical structures of Hed were characterized using 1H NMR, 13C NMR, and HRMS analysis (Supporting Results, Figures S1−S3). Subsequently, a reporter gene assay of luciferase activity was successfully established to monitor the expression of the downstream molecule of the STING pathway (IFN-β) through fluorescence intensity. Figure S4 showed that Hed exhibited a remarkable inhibition rate of 75.48 ± 0.34% on IFN-β, surpassing the inhibitory effects of Hederagenin (HE, 21.85 ± 0.026%) and the positive control drug H151 (52.28 ± 0.46%).
 |
Scheme 1 Synthesis of Hed. Reagents and conditions: (a) K2CO3, dry DMF, 85°C, reflux, 4 h; (b) EDCI, DMAP, dry CH2Cl2, r.t., 12 h. |
Preparation and Characterization of SHG NPs
Sor and Hed exhibited poor solubility in water, as demonstrated in Figure 1BI. Interestingly, when dissolved in THF: EtOH (2:3) and then separately introduced into water, Sor precipitated, while Hed tended to self-assemble (Figure 1BII). Subsequently, according to the schematic shown in Figure 1A, SHG NPs were prepared using a one-step nanoprecipitation technique by introducing a mixture of Sor, Hed, and DSPE-PEG-Gal into water. Specifically, Sor, Hed, and DSPE-PEG-Gal were initially dissolved in THF: EtOH (2:3), and the three solutions were combined at a molar ratio of 1:5:1.2. The subsequent evaporation of the organic solvent yielded the SHG NPs. The successful synthesis of the SHG NPs resulted in a noticeable transformation of the solution’s appearance, shifting from being colorless and transparent to exhibiting a light blue hue and opalescent quality. As illustrated in Figure 1BIII, the SHG NPs appeared as a blue colloidal solution with a prominent Tyndall effect. Furthermore, dynamic light scattering (DLS) analysis revealed an average particle size of 115.1 ± 3.5 nm for the SHG NPs (Figure 1C). Scanning electron microscopy (SEM) and transmission electron microscopy (TEM) confirmed the uniform distribution of spherical SHG NPs of approximately 100 nm, as illustrated in Figure 1D–E. These observations and data collectively indicated the stability and uniform dispersion of the SHG NPs. Besides, the drug encapsulation efficacy and loading capacity of Sor was 99.9% and 7.06%, respectively. As shown in Figure S5, the cumulative release of SHG NPs over 24 hours was lower (< 3%) than that of free Sor in the PBS buffer (pH = 7.4) system, which also demonstrated their stability under physiological conditions.
 |
Figure 1 Synthesis and characterization of SHG NPs. (A) Preparation process of the SHG NPs. (B): (I) Images of the Sor, Hed in aqueous solution. (II) Images of HED and Sor dissolved in THF:EtOH and dispersed in aqueous solution. (III) Images of the SHG NPs. (C) Size distribution of the SHG NPs. (D) SEM images of the SHG NPs, scale bar = 500 nm. (E) TEM images of the SHG NPs, scale bar = 100 nm. |
Spectroscopic Characterizations of the SHG NPs
To investigate the co-assembly process of SHG NPs, a series of spectroscopic studies were conducted. Initially, the UV absorption maxima of Sor and Hed were determined to be 266 nm and 228 nm, respectively (Figure 2A). After the formation of SHG NPs at equivalent concentrations, a notable increase in absorbance was observed, indicating that the hyperchromic effect occurred due to the co-assembly of Sor and Hed. Besides, the characteristic absorption peaks of SHG NPs appeared at 232 and 276 nm. Subsequent fluorescence spectral analysis demonstrated that the absorption peaks of Sor and Hed coincided at a maximum absorption wavelength of 409 nm when excited at 287 nm. However, these peaks disappeared upon the formation of SHG NPs, with a less intense absorption peak emerging at 655 nm (Figure 2B). This observation suggested that the majority of the fluorescence intensity was likely blocked by the co-assembly of Sor and Hed. Furthermore, Fourier transform infrared (FTIR) spectroscopy data indicated a significant shift in the vibrational peaks of the carbonyl group ν (C=O) (1774 cm−1 and 1683 cm−1) of Sor (Figure 2C), indicating a potential weak interaction between Sor’s carbonyl group and Hed during nanoparticle assembly.
 |
Figure 2 Spectroscopic properties of the SHG NPs. (A) UV spectra of the SHG NPs. (B) Fluorescence spectra of the SHG NPs. (C) FTIR spectra of the SHG NPs. (D) NMR hydrogen spectra of the SHG NPs. (E) Atom numbers of Sor. |
In addition, 1H-NMR spectral analysis revealed a shift in the signals corresponding to the 7-position and 9-position N-H bonds of Sor upon the formation of SHG NPs (Figure 2E). Specifically, signals originally observed at 9.02 ppm and 9.24 ppm migrated to 9.12 ppm and 9.36 ppm, respectively (Figure 2D). This shift suggested a significant alteration in the chemical environment of these N-H bonds when co-assembled with Hed. It can be inferred that weak bonding forces may influence the N-H bonds at positions 7 and 9 of Sor when interacting with Hed, leading to the observed spectral changes.
Molecular Dynamics Simulation and Molecular Docking of Sor and Hed
Molecular dynamics (MD) simulation and molecular docking were employed to elucidate the molecular mechanism of the interaction between Sor and Hed. Figure 3A illustrated the aggregation state of the nanoparticles before and after co-assembly, showing the agglomeration of initially dispersed Sor and Hed in the aqueous environment.
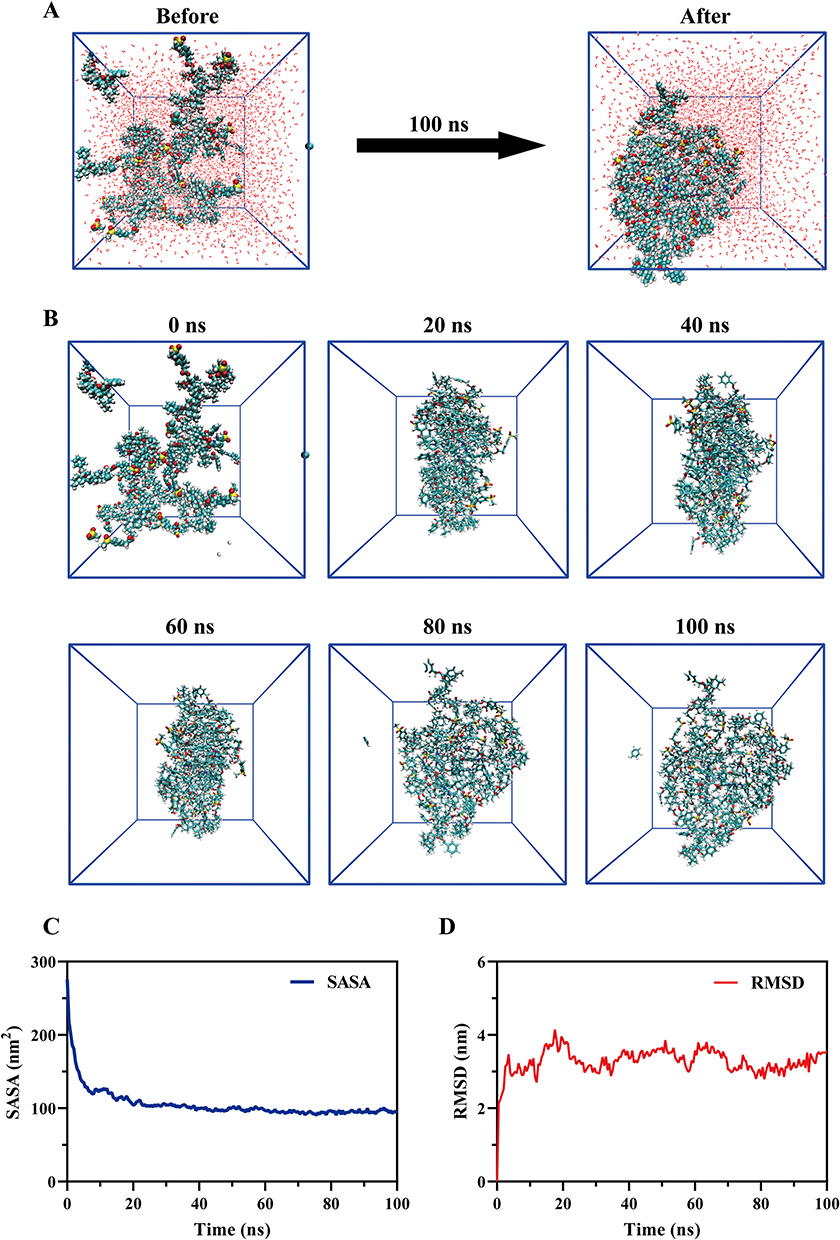 |
Figure 3 Molecular Dynamics Simulation of SHG NPs. (A) Structural changes in the SHG NPs in the initial and final states during the MD simulation. (B) Structural changes in the SHG NPs with time during the MD simulation. (C) Time-dependent changes of SASA during the co-assembly process. (D) Time-dependent changes of RMSD during the co-assembly process. |
Figure 3B exhibited the dynamic co-assembly process, with system conformations recorded every 20 ns. Agglomeration became apparent by 20 ns, suggesting a strong interaction between Sor and Hed. The rapid formation of the agglomeration structure in the system mirrored the wet experimental results. Upon introduction of the organic phase to the aqueous phase, a blue emulsion formed rapidly without precipitation, leading to the swift establishment of a dispersion system. The agglomeration structure at 80 ns closely resembled that at 100 ns, indicating system stabilization at this time.
Solvent accessible surface area (SASA) value and root-mean-square deviation (RMSD) value were commonly used to evaluate the stability and compactness of molecular systems.40,41 As shown in Figure 3C and D, the SASA value fluctuated significantly from 275.504 nm2 at the onset of assembly, eventually stabilizing after 20 ns. Similarly, the RMSD value indicated a reduction in structural variability and exposed surface area as the system underwent co-assembly, forming compact cluster-like polymers.
In addition, the results of molecular docking were shown in Figure S6. Hed formed π-π T-shaped interactions with Sor. Sor formed π-Lone Pair interactions with O40 of Hed, and O53 of Hed formed hydrogen bond interactions with F24 of Sor.
Evaluation of the Cytotoxicity and Anti-Collagen Deposition of SHG NPs on JS-1 Cells
The toxicity of each group on mouse hepatic stellate cells (JS-1) was assessed using the MTT method. The IC50 for Sor was 56.24 ± 1.68 µM, and the IC50 for Hed exceeded 100 µM. On this basis, neither the mechanical mixture group (S-H) nor the nano group (SHG NPs) had obvious toxicity at concentrations less than 5 µM (using the concentration of Sor as a reference). However, the toxicity of the SHG NPs increased significantly at 10 µM, and the survival rate remained above 60% (Figure 4A). Therefore, we chose concentrations less than 5 µM to evaluate the ability of anti-collagen proliferation.
 |
Figure 4 In vitro cell experiments. (A) MTT assay of JS-1 cells treated with Sor, Hed, S-H and SHG NPs. (B) The collagen inhibitory effect of Sor, Hed, S-H and SHG NPs. *P < 0.05, ***P < 0.001 compared to model group. ###P < 0.001 compared to control group. (C) Cellular uptake of SHG NPs. (D) Inhibition of IL-6 in LPS-induced RAW264.7 cells by Sor, Hed and SHG NPs. (E) Inhibition of TGF-β1 in LPS-induced RAW264.7 cells by Sor, Hed and SHG NPs. ***P < 0.001 compared to Sor group. ###P < 0.001 compared to Hed group. |
The collagen proliferation induced by TGF-β1 (5 ng·mL−1) was assessed using Sirius Red staining,42 and the collagen concentration in each drug treatment group was compared to that in the model group. As shown in Figure 4B, Hed minimally inhibited collagen deposition, while Sor, S-H, and SHG NPs inhibited collagen deposition in a concentration-dependent. Notably, compared with S-H, SHG NPs inhibited collagen deposition significantly better, suggesting potential anti-hepatic fibrosis effects. These results also suggest that nano-system formation enhances treatment efficacy.
Cellular Uptake of SHG NPs
The asialoglycoprotein receptor (ASGPR) was a member of the C-type lectin family and was considered a promising target for targeted drug delivery (TDD) due to its high expression in hepatocytes.43 ASGPR facilitated internalization by clathrin-mediated endocytosis and exhibited high affinity for galactose, N-acetylgalactosamine and glucose.44 The abundant expression of ASGPR on hepatocyte membranes suggested a strategy for liver-targeted drug delivery by formulating drugs into nanoparticles with galactose.
To investigate the relationship between drug uptake by HepG2 cells and the specific binding of ASGPR to galactose, we divided the FITC-containing SHG NPs into two groups: a direct incubation group for 10 min and a group in which HepG2 cells were pre-incubated with galactose for 30 min before the addition of the SHG NPs (Figure 4C). Both groups exhibited successful uptake by HepG2 cells, with the direct incubation group showing significantly brighter green fluorescence intensity than the galactose pre-incubation group. This suggested that the galactose active targeting moiety can specifically bind to the overexpressed ASGPR on the cell surface, enabling targeted delivery of SHG NPs. Furthermore, a comparison between the 10 min and 1 h incubation groups of SHG NPs demonstrated a time-dependent increase in cellular uptake.
The specificity of active targeting with galactose was further confirmed by replacing galactose residues with methyl groups in the nanoparticles (SHM NPs). After 1 h of incubation, the fluorescence intensity of the SHM NPs group was lower than that of the SHG NPs group, supporting the initial hypothesis. As shown in Figure S7, after incubation for 1 h, the fluorescence intensity of SHG NPs uptake by AML12 cells was significantly stronger than that of JS-1 cells, further suggesting that SHG NPs were targeted to the cells with high expression of ASGPR.
Effect of SHG NPs on Inflammatory Factors in the Supernatants of LPS-Induced RAW264.7 Cells
As depicted in Figure 4D, demonstrated a stronger inhibition of IL-6 expression in LPS-stimulated RAW264.7 cells compared to Sor, while SHG NPs showed the most significant reduction in IL-6 levels across all groups, varying with concentration. Concurrently, the expression of TGF-β1 in RAW264.7 cells’ supernatant was identified, revealing that the suppressive impact of SHG NPs was more effective and varied with concentration (Figure 4E).
In vivo Biodistribution Analysis
For assessing the biodistribution of SHG NPs, C57 mice received intravenous injections of SHG NPs marked with DIR. Figure 5A–C demonstrated a gradual rise in the liver’s free DIR fluorescence intensity over time, peaking at 8 hours, followed by a gradual decline. In contrast, the intensity of liver fluorescence in the SHG NPs group stood out as the most intense throughout the experiment. Additionally, the use of ex vivo fluorescence imaging on removed liver tissues reinforced the findings of in vivo imaging studies (Figure 5B–D). The aforementioned findings intuitively demonstrate its ability to extend blood circulation duration and boost the liver accumulation capability of SHG NPs.
 |
Figure 5 In vivo bio-distribution. (A) The IVIS pictures of DIR and targeted SHG NPs at various time points. (B) Ex vivo images of livers (a), lungs (b), hearts (c), spleens (d) and kidneys(e) 24 h post-injection. (C) Quantitative analysis of liver fluorescence intensity over time. (D) Fluorescence intensity of livers, hearts, spleens, lungs and kidneys 24 h post-injection. ***P < 0.001 compared to DIR group. |
SHG NPs Effectively Alleviated the CCl4-Induced Liver Injury in vivo
To investigate the therapeutic effects and underlying mechanisms of SHG NPs on liver fibrosis, a mouse model of liver fibrosis induced by CCl4 was utilized. The mice were orally administered 0.1 mg·mL−1 CCl4 for 4 weeks to induce liver fibrosis. All treatments were given once every three days for 4 weeks, while the administration of CCl4 continued (Figure 6A).
 |
Figure 6 Anti-liver fibrosis capacity of the SHG NPs in mice. (A) Schedule of SHG NPs treatment in fibrotic mice induced by CCl4. (B) Serum levels of AST. (C) Serum levels of ALT. (D) Serum levels of TBA. (E) Representative images of H&E-stained liver sections, scale bar = 100 μm. (Yellow arrows highlighted the inflammatory cell infiltration). *P < 0.05, **P < 0.01 ***P < 0.001 compared to model group. ###P < 0.001 compared to control group. |
Treatment with Sor, S-H and different concentrations of SHG NPs effectively mitigated the CCl4-induced increase in alanine transaminase (ALT), aspartate transaminase (AST), and total bile acid (TBA) levels (Figure 6B–D). Notably, the medium- and high-dose SHG NPs groups appeared to demonstrate improved efficacy compared to the Sor and S-H groups in our experiments. The plateaued efficacy observed in the high-dose group could potentially be explained by factors such as ASGPR saturation or inflammatory feedback mechanisms, though further investigation would be needed to confirm this. The differential trends between ALT and TBA levels might reflect possible variations in hepatocyte repair processes versus bile acid metabolism, or could suggest an interplay between STING and TGF-β pathways. Hematoxylin and eosin (H&E) staining was used to observe histopathological changes. As shown in Figure 6E, the liver was damaged and inflammatory cell infiltration (Yellow arrows highlighted) was obvious after CCl4 treatment. Sor and Hed combined (S-H and SHG NPs) significantly reduced inflammatory infiltration and attenuated CCl4-induced hepatic fibrosis in mice. In addition, H&E staining of vital organs, including the heart, spleen, lung and kidney from mice in each treatment group (Figure S8), revealed no significant pathological changes. Moreover, there were no observable toxicity or adverse effects on the examined organs across all groups, indicating the favorable safety profile of the tested drugs.
SHG NPs Effectively Alleviated CCl4-Induced Liver Fibrosis in vivo
The synthesis and secretion of collagen increase following fibrosis, and Masson staining could be used to stain collagen in liver tissue blue, allowing for the assessment of the degree of liver fibrosis based on color depth.45 Compared to the control group, the model group exhibited more and darker blue areas (Yellow arrows highlighted), indicating severe collagen over-deposition and increased collagen proliferation. While some improvement was observed with individual drug administration (Sor and Hed groups), the therapeutic effect was enhanced with simultaneous drug administration (S-H group and SHG NPs groups). Furthermore, the amelioration of hepatic fibrosis was significantly more pronounced in the SHG NPs-M and SHG NPs-H groups than in the S-H group, with only minimal collagen proliferation visible (Figure 7A).
 |
Figure 7 Anti-liver fibrosis capacity of the SHG NPs in mice. (A) Representative images of Masson-stained liver sections. (Yellow arrows highlighted the darker blue areas). (B) Immunofluorescence staining of α-SMA (green) and COL 1 (red), nuclei counterstained with DAPI (blue) in the liver. (C) Protein expression of α-SMA and COL 1 in liver tissues. (D) Relative intensity of COL 1/β-actin. (E) Relative intensity of α-SMA/β-actin. *P < 0.05, **P < 0.01 ***P < 0.001 compared to model group. ###P < 0.001 compared to control group. |
Consistent with the Masson staining results, we further evaluated the efficacy of SHG NPs against hepatic fibrosis using immunofluorescence. α-Smooth muscle actin (α-SMA) and collagen I (COL 1), recognized markers of hepatic stellate cells (HSCs) activation,46 were utilized to assess the efficacy of the drugs by examining their inhibitory effects. In Figure 7B, the model group exhibited the highest intensity of green and red fluorescence, indicating severe collagen deposition and fibrosis. In contrast, all treatment groups showed varying degrees of reduced fluorescence intensity, with the SHG NPs groups displaying a concentration-dependent decrease in fluorescence intensity, highlighting their anti-fibrotic efficacy. Figure S9 showed DAPI staining (blue) of α-SMA and COL 1 for localization of nuclei. Furthermore, Western blotting analysis in Figure 7C–E revealed a significant increase in the expression of COL 1 and α-SMA in the model group, while these markers decreased in all treatment groups. Notably, the SHG NPs-H group exhibited the most pronounced inhibitory effect, emphasizing its superior anti-hepatic fibrosis capability. Original Western blots for α-SMA, COL 1, and β-actin were shown in Figure S10.
Anti-Liver Fibrosis and Anti-Inflammatory Mechanism Analysis of SHG NPs
To investigate the molecular mechanisms underlying the effects of SHG NPs in treating liver fibrosis, RNA sequencing (RNA-seq) experiments were conducted on liver tissue samples. The analysis aimed to identify differentially expressed genes (DEGs) among the control group (Con group), model group (Mod group), and SHG NPs-treated group (SHG NPs group) and to conduct a preliminary validation of the anti-liver fibrosis mechanism of SHG NPs.
Differential expression analysis was performed using DESeq2 to identify DEGs between the groups. The volcano plot generated (Figure 8A) revealed 614 genes that were significantly differentially expressed between the Con group and the Mod group, with 172 genes up-regulated and 442 genes down-regulated, at a significance level of P-adjust of 0.05 and a Log2(FC) fold change of 2. There were 483 DEGs in the SHG NPs group compared to the Mod group, comprising 354 up-regulated genes and 129 down-regulated genes (Figure 8B). To further identify the signaling pathways affected by SHG NPs, KEGG enrichment analysis was performed for all differentially expressed genes. As shown in Figure 8C, the Mod and SHG NPs groups were enriched for the Rap1 signaling pathway, PI3K-Akt signaling pathway, focal adhesion and ECM-receptor interaction. Subsequently, qPCR analysis was conducted on selected genes associated with collagen deposition (Figure 8D). The expression level of Col1a1 was significantly lower in the SHG NPs group than in the Mod group.
 |
Figure 8 RNA expression profiles of livers from different groups of mice. (A) Volcano plots of DEGs. (B) Volcano plots of DEGs. (C) KEGG analysis of gene enrichment in the signaling pathways. (D) Gene expression levels of Col1a1. ***P < 0.001 compared to model group, ###P < 0.001 compared to control group. |
In addition, we performed a comparative analysis of the fluorescence intensity of TGF-β and p65 to verify the mechanism by which the SHG NPs in attenuate liver fibrosis. As shown in Figure 9, the relative fluorescence intensity of TGF-β in the model group was significantly greater than that in the SHG NPs. Notably, the fluorescence intensity in the SHG NPs-treated groups was significantly reduced in a concentration-dependent manner, highlighting the effective attenuation of liver fibrosis by the SHG NPs. Figure S9 also showed DAPI staining (blue) of TGF-β and p65 for localization of nuclei.
 |
Figure 9 Immunofluorescence analysis. (A) Immunofluorescence staining of TGF-β (green) and p65 (red), and nuclei counterstained with DAPI (blue) in liver. (B) Fluorescence statistical analysis of TGF-β. *P < 0.05, **P < 0.01 ***P < 0.001 compared to model group. ##P < 0.01 ###P < 0.001. (C) Fluorescence statistical analysis of p65. *P < 0.05, **P < 0.01 ***P < 0.001 compared to Sor group. #P < 0.05. |
Conclusion
In summary, we developed co-assembled SHG NPs to enhance both the therapeutic efficacy against liver fibrosis and the delivery efficiency. SHG NPs are preferentially internalized by hepatocytes via DSPE-PEG-Gal-mediated ASGPR targeting. Sorafenib, released from hepatocytes, diffuses into adjacent HSCs to inhibit PDGFR/TGF-β signaling. Hed selectively targets macrophage-mediated inflammation via its STING inhibitory activity and is preferentially taken up by Kupffer cells in fibrotic livers. This dual-targeting and spatiotemporal release ensure synergistic antifibrotic effects. Notably, upon administration via tail vein injection, the anti-hepatic fibrosis effects of mechanical mixture group (S-H) and SHG NPs were significantly greater than those of Sor, as evidenced by decreased levels of ALT, AST, and TBA in the blood, inhibition of collagen deposition, and a reduction in inflammation. These advantages of S-H and SHG NPs over Sor could be attributed to the anti-inflammatory properties of Hed. Moreover, both in vitro and in vivo experiments demonstrated that SHG NPs exhibited superior activity compared to S-H. Supramolecular co-assembly is a versatile nano-architectural approach for the manipulation of small molecules into nanostructures. The development of liver-targeted nanoparticles through co-administration of Sor and STING pathway inhibitor in this work represents a significant advancement in the field of hepatic fibrosis treatment and offers a promising strategy to address the complexities of liver fibrosis pathogenesis and therapeutic challenges.
Abbreviations
ASGPR, Asialoglycoprotein receptor; 13C-NMR, Carbon-13 nuclear magnetic resonance; CDCl3, Chloroform with one deuterium atom; DMAP, 4-Dimethylaminopyridine; DMSO, Dimethyl Sulfoxide; H&E, Hematoxylin and eosin; HE, Hederagenin; Hed, Hederagenin derivative; 1H-NMR, Proton nuclear magnetic resonance; HRMS, High Resolution Mass Spectrometer; HSCs, Hepatic stellate cells; IC50, Half Maximal Inhibitory Concentration; IFN, Interferons; IR, Infrared spectrum; MTT, Methyl Thiazolyl Tetrazolium Assay; PBS, Phosphate buffer solution; Sor, Sorafenib; STING, Stimulator of interferon gene; UV, Ultraviolet spectrum.
Data Sharing Statement
Data will be made available on request.
Acknowledgments
This research was funded by the National Natural Science Foundation of China (No. 82104365, 82274082), National Key R&D Program of China (2022YFC3502100), Beijing “high-grade, precision and advanced” project, Beijing Key Laboratory for Basic and Development Research on Chinese Medicine (Beijing, 100102).
Author Contributions
All authors made a significant contribution to the work reported, whether that is in the conception, study design, execution, acquisition of data, analysis and interpretation, or in all these areas; took part in drafting, revising or critically reviewing the article; gave final approval of the version to be published; have agreed on the journal to which the article has been submitted; and agree to be accountable for all aspects of the work.
Disclosure
The authors declare that they have no competing interests in this work.
References
1. Kisseleva T, Brenner D. Molecular and cellular mechanisms of liver fibrosis and its regression. Nat Rev Gastroenterol Hepatol. 2021;18:151–166. doi:10.1038/s41575-020-00372-7
2. Roehlen N, Crouchet E, Baumert TF. Liver fibrosis: mechanistic concepts and therapeutic perspectives. Cells. 2020;9:875. doi:10.3390/cells9040875
3. Su TH, Kao JH, Liu CJ. Molecular mechanism and treatment of viral hepatitis-related liver fibrosis. Int J Mol Sci. 2014;15:10578–10604. doi:10.3390/ijms150610578
4. Kawaratani H, Moriya K, Namisaki T, et al. Therapeutic strategies for alcoholic liver disease: focusing on inflammation and fibrosis (Review). Int J Mol Med. 2017;40:263–270. doi:10.3892/ijmm.2017.3015
5. Lackner C, Tiniakos D. Fibrosis and alcohol-related liver disease. J Hepatol. 2019;70:294–304. doi:10.1016/j.jhep.2018.12.003
6. Enomoto H, Bando Y, Nakamura H, Nishiguchi S, Koga M. Liver fibrosis markers of nonalcoholic steatohepatitis. World J Gastroenterol. 2015;21:7427–7435. doi:10.3748/wjg.v21.i24.7427
7. Bessone F, Razori MV, Roma MG. Molecular pathways of nonalcoholic fatty liver disease development and progression. Cell Mol Life Sci. 2019;76:99–128. doi:10.1007/s00018-018-2947-0
8. Peiseler M, Schwabe R, Hampe J, Kubes P, Heikenwälder M, Tacke F. Immune mechanisms linking metabolic injury to inflammation and fibrosis in fatty liver disease - novel insights into cellular communication circuits. J Hepatol. 2022;77:1136–1160. doi:10.1016/j.jhep.2022.06.012
9. Chen H, Tan H, Wan J, et al. PPAR-γ signaling in nonalcoholic fatty liver disease: pathogenesis and therapeutic targets. Pharmacol Ther. 2023;245:108391. doi:10.1016/j.pharmthera.2023.108391
10. Seen S. Chronic liver disease and oxidative stress - a narrative review. Expert Rev Gastroenterol Hepatol. 2021;15:1021–1035. doi:10.1080/17474124.2021.1949289
11. Fehér J, Lengyel G. Silymarin az idült májbetegségek kezelésében: múlt és jövo [Silymarin in the treatment of chronic liver diseases: past and future]. Orv Hetil. 2008;149:2413–2418. doi:10.1556/oh.2008.28519
12. Scheiner B, Lindner G, Reiberger T, et al. Acid-base disorders in liver disease. J Hepatol. 2017;67:1062–1073. doi:10.1016/j.jhep.2017.06.023
13. Odagiri N, Matsubara T, Sato-Matsubara M, Fujii H, Enomoto M, Kawada N. Anti-fibrotic treatments for chronic liver diseases: the present and the future. Clin Mol Hepatol. 2021;27:413–424. doi:10.3350/cmh.2020.0187
14. Mohammed OS, Attia HG, Bmsa M, Elbaset MA, Fayed HM. Current investigations for liver fibrosis treatment: between repurposing the FDA-approved drugs and the other emerging approaches. J Pharm Pharm Sci. 2023;26:11808. doi:10.3389/jpps.2023.11808
15. Koyama Y, Brenner DA. New therapies for hepatic fibrosis. Clin Res Hepatol Gastroenterol. 2015;39:S75–9. doi:10.1016/j.clinre.2015.06.011
16. Yuan S, Wei C, Liu G, et al. Sorafenib attenuates liver fibrosis by triggering hepatic stellate cell ferroptosis via HIF-1α/SLC7A11 pathway. Cell Prolif. 2022;55:e13158. doi:10.1111/cpr.13158
17. Ma R, Chen J, Liang Y, et al. Sorafenib: a potential therapeutic drug for hepatic fibrosis and its outcomes. Biomed Pharmacother. 2017;88:459–468. doi:10.1016/j.biopha.2017.01.107
18. Cheng Y, Zheng H, Wang B, Xu W, Xu J, Zhu Y. Sorafenib and fluvastatin synergistically alleviate hepatic fibrosis via inhibiting the TGFβ1/Smad3 pathway. Dig Liver Dis. 2018;50:381–388. doi:10.1016/j.dld.2017.12.015
19. Jia L, Ma X, Gui B, et al. Sorafenib ameliorates renal fibrosis through inhibition of TGF-β-induced epithelial-mesenchymal transition. PLoS One. 2015;10:e0117757. doi:10.1371/journal.pone.0117757
20. Robertson IB, Rifkin DB. Regulation of the Bioavailability of TGF-β and TGF-β-Related Proteins. Cold Spring Harb Perspect Biol. 2016;8:a021907. doi:10.1101/cshperspect.a021907
21. Soukupova J, Malfettone A, Bertran E, et al. Epithelial-Mesenchymal Transition (EMT) Induced by TGF-β in Hepatocellular Carcinoma Cells Reprograms Lipid Metabolism. Int J Mol Sci. 2021;22:5543. doi:10.3390/ijms22115543
22. Fabregat I, Caballero-Díaz D. Transforming growth factor-β-induced cell plasticity in liver fibrosis and hepatocarcinogenesis. Front Oncol. 2018;8:357. doi:10.3389/fonc.2018.00357
23. Navarro-Corcuera A, Ansorena E, Montiel-Duarte C, Iraburu MJ. AGAP2: modulating tgfβ1-signaling in the regulation of liver fibrosis. Int J Mol Sci. 2020;21:1400. doi:10.3390/ijms21041400
24. Bonner JC. Regulation of PDGF and its receptors in fibrotic diseases. Cytokine Growth Factor Rev. 2004;15:255–273. doi:10.1016/j.cytogfr.2004.03.006
25. Li F, Ma Z, Liu H, et al. Y-box protein-1 regulates the expression of collagen i in hepatic progenitor cells via PDGFR-β/ERK/p90RSK signalling. Stem Cells Int. 2017;2017:6193106. doi:10.1155/2017/6193106
26. Chen C, Li X, Wang L. Thymosinβ4 alleviates cholestatic liver fibrosis in mice through downregulating PDGF/PDGFR and TGFβ/Smad pathways. Dig Liver Dis. 2020;52:324–330. doi:10.1016/j.dld.2019.08.014
27. Ying HZ, Chen Q, Wy Z, et al. PDGF signaling pathway in hepatic fibrosis pathogenesis and therapeutics (Review). Mol Med Rep. 2017;16:7879–7889. doi:10.3892/mmr.2017.7641
28. Sung YC, Yc L, Chao PH, et al. Combined delivery of sorafenib and a MEK inhibitor using CXCR4-targeted nanoparticles reduces hepatic fibrosis and prevents tumor development. Theranostics. 2018;8:894–905. doi:10.7150/thno.21168
29. Duncan JS, Whittle MC, Nakamura K, et al. Dynamic reprogramming of the kinome in response to targeted MEK inhibition in triple-negative breast cancer. Cell. 2012;149:307–321. doi:10.1016/j.cell.2012.02.053
30. Alcalá AM, Flaherty KT. BRAF inhibitors for the treatment of metastatic melanoma: clinical trials and mechanisms of resistance. Clin Cancer Res. 2012;18:33–39. doi:10.1158/1078-0432.CCR-11-0997
31. Engelman JA, Zejnullahu K, Mitsudomi T, et al. MET amplification leads to gefitinib resistance in lung cancer by activating ERBB3 signaling. Science. 2007;316:1039–1043. doi:10.1126/science.1141478
32. Chen Y, Liu YC, Yc S, et al. Overcoming sorafenib evasion in hepatocellular carcinoma using CXCR4-targeted nanoparticles to co-deliver MEK-inhibitors. Sci Rep. 2017;7:44123. doi:10.1038/srep44123
33. Huang Y, Liang W, Li K, et al. Sorafenib suppresses the activation of type I interferon pathway induced by RLR-MAVS and cGAS-STING signaling. Biochem Biophys Res Commun. 2022;623:181–188. doi:10.1016/j.bbrc.2022.07.028
34. Zheng N, Liu W, Li B, et al. Co-delivery of sorafenib and metapristone encapsulated by CXCR4-targeted PLGA-PEG nanoparticles overcomes hepatocellular carcinoma resistance to sorafenib. J Exp Clin Cancer Res. 2019;38:232. doi:10.1186/s13046-019-1216-x
35. Cui X, Zhang R, Cen S, Zhou J. STING modulators: predictive significance in drug discovery. Eur J Med Chem. 2019;182:111591. doi:10.1016/j.ejmech.2019.111591
36. Decout A, Katz JD, Venkatraman S, Ablasser A. The cGAS-STING pathway as a therapeutic target in inflammatory diseases. Nat Rev Immunol. 2021;21:548–569. doi:10.1038/s41577-021-00524-z
37. Yu T, Cheng H, Li X, et al. Design and synthesis of hederagenin derivatives modulating STING/NF-κB signaling for the relief of acute liver injury in septic mice. Eur J Med Chem. 2023;245:114911. doi:10.1016/j.ejmech.2022.114911
38. Li H, Xie W, Gao X, et al. Design and synthesis of novel hederagonic acid analogs as potent anti-inflammatory compounds capable of protecting against LPS-induced acute lung injury. Eur J Med Chem. 2024;263:115941. doi:10.1016/j.ejmech.2023.115941
39. Luo X, Li H, Ma L, et al. Expression of STING is increased in liver tissues from patients with NAFLD and promotes macrophage-mediated hepatic inflammation and fibrosis in mice. Gastroenterology. 2018;155:1971–1984.e4. doi:10.1053/j.gastro.2018.09.010
40. Hou Y, Chen M, Ruan H, et al. A new supramolecular natural product gel based on self-assembled pomolic acid from traditional Chinese medicine. Colloid Interface Sci Commun. 2022;46:100583. doi:10.1016/j.colcom.2021.100583
41. Li B, Huang Y, Bao J, Xu Z, Yan X, Zou Q. supramolecular nanoarchitectonics based on antagonist peptide self-assembly for treatment of liver fibrosis. Small. 2023;19:e2304675. doi:10.1002/smll.202304675
42. Xiao Z, Ji Q, Fu YD, et al. Amygdalin ameliorates liver fibrosis through inhibiting activation of TGF-β/smad signaling. Chin J Integr Med. 2023;29:316–324. doi:10.1007/s11655-021-3304-y
43. Ivanenkov YA, Majouga AG, Ra P, et al. Synthesis and biological evaluation of novel doxorubicin-containing ASGP-R-targeted drug-conjugates. Bioorg Med Chem Lett. 2018;28:503–508. doi:10.1016/j.bmcl.2017.12.004
44. D’Souza AA, Devarajan PV. Asialoglycoprotein receptor mediated hepatocyte targeting - strategies and applications. J Control Release. 2015;203:126–139. doi:10.1016/j.jconrel.2015.02.022
45. Liang Y, Wang J, Xu C, et al. Remodeling collagen microenvironment in liver using a biomimetic nano-regulator for reversal of liver fibrosis. Adv Sci. 2023;10:e2300127. doi:10.1002/advs.202300127
46. Niu X, Meng Y, Cui J, et al. Hepatic stellate cell- and liver microbiome-specific delivery system for dihydrotanshinone i to ameliorate liver fibrosis. ACS Nano. 2023;17:23608–23625. doi:10.1021/acsnano.3c06626
 © 2025 The Author(s). This work is published and licensed by Dove Medical Press Limited. The
full terms of this license are available at https://www.dovepress.com/terms.php
and incorporate the Creative Commons Attribution
- Non Commercial (unported, 4.0) License.
By accessing the work you hereby accept the Terms. Non-commercial uses of the work are permitted
without any further permission from Dove Medical Press Limited, provided the work is properly
attributed. For permission for commercial use of this work, please see paragraphs 4.2 and 5 of our Terms.
© 2025 The Author(s). This work is published and licensed by Dove Medical Press Limited. The
full terms of this license are available at https://www.dovepress.com/terms.php
and incorporate the Creative Commons Attribution
- Non Commercial (unported, 4.0) License.
By accessing the work you hereby accept the Terms. Non-commercial uses of the work are permitted
without any further permission from Dove Medical Press Limited, provided the work is properly
attributed. For permission for commercial use of this work, please see paragraphs 4.2 and 5 of our Terms.
Recommended articles
Sorafenib Attenuates Fibrotic Hepatic Injury Through Mediating Lysine Crotonylation
Chen XF, Ji S
Drug Design, Development and Therapy 2022, 16:2133-2144
Published Date: 3 July 2022