")
Back to Journals » International Journal of Nephrology and Renovascular Disease » Volume 18
Combining Super-Resolution Imaging and Shear Wave Elastography for Enhanced Risk Assessment of Moderate-to-Severe Renal Fibrosis in Chronic Kidney Disease Patients
Authors Huang X , Zhang Y, Hu Y, Pan J, Huang X, Zhang J, Pu H, Chen Y, Deng Q, Zhou Q
Received 10 April 2025
Accepted for publication 14 June 2025
Published 30 June 2025 Volume 2025:18 Pages 187—199
DOI https://doi.org/10.2147/IJNRD.S528614
Checked for plagiarism Yes
Review by Single anonymous peer review
Peer reviewer comments 3
Editor who approved publication: Professor Pravin Singhal
Xingyue Huang,* Yao Zhang,* Yugang Hu, Juhong Pan, Xin Huang, Jun Zhang, Huan Pu, Yueying Chen, Qing Deng, Qing Zhou
Department of Ultrasound Imaging, Renmin Hospital of Wuhan University, Wuhan, 430061, People’s Republic of China
*These authors contributed equally to this work
Correspondence: Qing Zhou, Department of Ultrasound Imaging, Renmin Hospital of Wuhan University, No. 99 of Zhangzhidong Road, Wuhan, 430061, People’s Republic of China, Tel +86027-88041911, Email [email protected] Qing Deng, Department of Ultrasound Imaging, Renmin Hospital of Wuhan University, No. 99 of Zhangzhidong Road, Wuhan, 430061, People’s Republic of China, Tel +86027-88041911, Email [email protected]
Objective: This study aims to evaluate the diagnostic efficacy of shear wave elastography (SWE) and super-resolution imaging (SRI) in detecting moderate-to-severe renal fibrosis (MSRF) among patients with chronic kidney disease (CKD).
Methods: In this prospective study, 202 CKD patients who underwent SWE and SRI prior to renal biopsy were enrolled. Based on pathological findings, patients were categorized into a mild renal fibrosis group (n=107) and an MSRF group (n=95). LASSO logistic regression was employed to identify independent risk factors for MSRF. Four diagnostic models—isolated, series, parallel, and integrated—were developed by combining elasticity values from SWE and vascular density values from SRI. Additionally, a nomogram incorporating clinical parameters and ultrasound composite parameters was constructed to assess MSRF in CKD patients.
Results: LASSO and subsequent logistic regression analysis revealed that age, diabetes history, estimated glomerular filtration rate (eGFR), elasticity, and vascular density were independently associated with MSRF. The integrated model, utilizing a logistic algorithm, demonstrated superior diagnostic performance with an area under the curve (AUC) of 0.83 (P < 0.001), sensitivity of 80.4%, and specificity of 75.8%, outperforming all other models. Furthermore, the nomogram, which integrated clinical factors and ultrasound composite parameters, exhibited excellent predictive performance (AUC = 0.878, 95% CI 0.782– 0.974). Calibration and decision curve analyses confirmed the model’s robust calibration and clinical utility.
Conclusion: The integration of SWE-derived elasticity and SRI-derived vascular density significantly enhances the diagnostic accuracy for MSRF in CKD patients. This comprehensive approach offers a promising non-invasive strategy for assessing renal fibrosis severity.
Keywords: chronic kidney disease, renal fibrosis, shear wave elastography, super-resolution imaging
Key Points
1. Novel Dual-Perspective Approach: This study is the first to assess renal fibrosis by integrating super-resolution imaging (SRI) for microvascular evaluation and shear wave elastography (SWE) for parenchymal diffuse lesions, providing a comprehensive analysis of fibrosis severity in chronic kidney disease (CKD) patients.
2. Advanced Diagnostic Strategy: The diagnostic performance of two innovative ultrasound techniques—microvascular contrast imaging and elastography—was evaluated both individually and in various combinations. A novel method for calculating ultrasound composite parameters was developed, significantly improving sensitivity, specificity, and diagnostic accuracy for renal fibrosis.
3. Integrated Predictive Model: A robust predictive model was designed by combining clinical parameters (eg age, diabetes history, eGFR) with advanced ultrasound-derived parameters. This model effectively identifies independent risk factors and enhances the prediction of moderate-to-severe renal fibrosis, offering a valuable tool for clinical decision-making.
Introduction
Chronic kidney disease (CKD) represents a major global health burden, with renal fibrosis being the key pathological driver of progression to end-stage renal disease. Early and precise detection of renal fibrosis is crucial for effective clinical management and improving patient outcomes.1 Renal fibrosis involves pathological changes in the glomeruli, interstitium, and microvasculature. Conventional ultrasound and shear wave elastography (SWE) have been utilized to evaluate renal fibrosis, providing insights into renal size, parenchymal thickness, diffuse lesions, and tissue stiffness. However, morphological changes in the kidney typically manifest in the middle to late stages of CKD, limiting the utility of these methods in early disease. SWE can differentiate between glomerulosclerosis and interstitial fibrosis based on tissue stiffness,2 offering some correlation with the progression of renal fibrosis. Nevertheless, a comprehensive assessment of early-stage fibrosis remains challenging.
The kidney is a highly vascularized organ, and microvascular injury is a common feature across various kidney diseases, ultimately contributing to CKD progression.3 Super-resolution imaging (SRI), an advanced ultrasound technology with exceptional temporal and spatial resolution, enables noninvasive evaluation of renal microcirculation. Renal cortical microvascular hemodynamics, closely linked to renal function,4,5 in this study, we integrated SRI with conventional ultrasound and SWE to assess renal cortical microvascular lesions, addressing a critical gap in previous research by incorporating vascularization into the evaluation of renal fibrosis.
This study aims to identify independent risk factors for moderate-to-severe renal fibrosis by analyzing ultrasound and clinical parameters, develop an ultrasound composite parameter to improve fibrosis assessment in CKD, and design an integrated model combining clinical and ultrasound-derived parameters for enhanced risk stratification. By integrating microvascular and parenchymal evaluations, this approach offers a more comprehensive and accurate method for diagnosing and monitoring renal fibrosis in CKD.
Methods
Study Population
A prospective study was conducted on 422 patients who underwent renal biopsy at Renmin Hospital of Wuhan University from January 1, 2024, to September 31, 2024. Based on pathological results (semi-quantitative score <9 points or not6,7), patients were divided into a mild renal fibrosis group (n=107) and a moderate-to-severe renal fibrosis group (n=95). Inclusion criteria were: 1) diagnosis of CKD according to KDIGO criteria,8 2) availability of clear pathological results from renal biopsy, 3) no contraindications to ultrasonography, and 4) ability to cooperate during image acquisition to ensure high-quality, clear, and homogeneous ultrasound images. Exclusion criteria included: 1) structural renal diseases (eg, large stones, hydronephrosis, renal artery stenosis) and 2) incomplete ultrasound data (eg, inability to cooperate with breath-holding or allergy to ultrasound contrast agents). After screening, 104 cases with structural renal lesions and 116 cases with incomplete ultrasound data were excluded, leaving 202 patients for final analysis. This study was conducted in accordance with the Declaration of Helsinki (as revised in 2013) and was approved by the Clinical Research Ethics Committee of Renmin Hospital of Wuhan University (No. WDRM2024-K109) and all patients provided informed consent. (Figure 1).
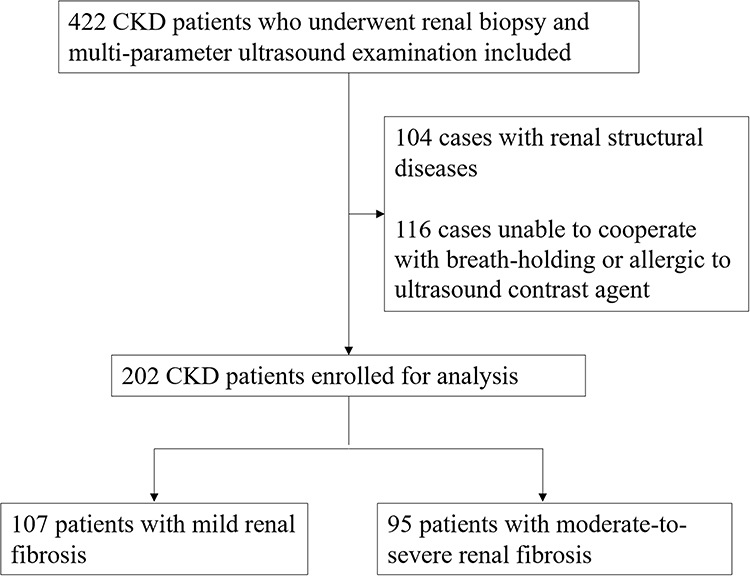 |
Figure 1 Flowchart of study population recruitment. |
Clinical Data Collection
Clinical data, including age, gender, body mass index (BMI), history of diabetes mellitus, hypertension, hyperuricemia, and hyperlipidemia, were collected for all patients during hospitalization. Laboratory parameters were recorded within 48 hours prior to renal biopsy.
Ultrasound Imaging Collection
Conventional Ultrasound
Using the Mindray Resona A20 Pro ultrasound diagnostic instrument with an SC7-1U probe, patients were examined in the prone position. Two-dimensional and color Doppler ultrasound images of the kidneys were acquired, measuring renal length, cortical thickness, and the distance between peripheral blood vessels and the renal capsule in CDFI mode. All examinations were performed by the same physician with over ten years of experience in ultrasound diagnostics and all relevant data were collected within 24 hours before renal biopsy.
Shear Wave Elastography (SWE)
The clearest two-dimensional image of the kidney was selected, and the sample box was placed in the middle of the kidneys (perpendicular to the probe direction) for elastography and viscoelasticity measurements, avoiding the renal collecting system and surrounding tissues. The distance between the sample box and the probe was maintained within 5 cm for all patients. Patients were instructed to hold their breath for 5–10 seconds to obtain satisfactory images. The collected shear wave elastography and viscoelasticity results had to meet the following conditions: 1) the ultrasound instrument displayed an M-STB index of at least four stars; 2) the test area showed a uniform green color; 3) the index allowed values greater than 90%. The rectangular sample box measurement software within the instrument was used, with a sample box size of 1×1 cm. The circular region of interest (ROI) method was used to select an ROI with a diameter of 2 mm in the middle cortical region, and the Young’s modulus and the viscosity within the ROI were recorded. It was measured three times under the same conditions, and the average value was calculated.
Super-Resolution Ultrasound Imaging (SRI)
The clearest long-axis view of the kidney was selected in two-dimensional mode. The probe position was fixed, and the “microvascular imaging” mode was activated. A contrast agent (SonoVue 0.5 mL) was injected through the patient’s elbow vein, followed by a 5 mL saline flush. At the peak contrast intensity, the patient was instructed to hold their breath to ensure probe stability. Dynamic images were collected for 3 seconds, with the machine acquiring 1500 frames at a high rate of 500 frames per second. Super-resolution images of renal blood vessels were automatically generated, and microvascular density in the subcapsular renal cortex was calculated.
Comparison of Diagnostic Strategies
This study evaluated the diagnostic utility of combining shear wave elastography (SWE) values with SRI vascular density using four strategies:
Isolated Use
SWE or vascular density values alone were used to differentiate between mild and moderate-to-severe renal fibrosis, assessing the independent diagnostic validity of each parameter.
Series Combination
Only cases diagnosed with moderate-to-severe renal fibrosis by both methods were classified into the moderate-to-severe group, improving diagnostic specificity.
Parallel Combination
A diagnosis of moderate-to-severe renal fibrosis by either method was included in the moderate-to-severe group, leveraging the complementary strengths of both techniques to reduce missed diagnoses.
Integrated Scheme
A logistic regression algorithm combined SWE values and vascular density values into a unified diagnostic model. This approach calculated the probability of moderate-to-severe renal fibrosis based on predefined thresholds, enhancing accuracy and reliability.
Statistical Analysis
Data were analyzed using IBM SPSS 20.0 and R 3.3.3 software. Normally distributed data were compared using the t-test, while non-normally distributed data were analyzed using the Mann–Whitney U-test. Categorical data were compared using the chi-square test. To avoid overfitting, LASSO regression was applied to screen risk factors associated with moderate-to-severe renal fibrosis, followed by univariate and multivariate logistic regression to identify independent risk factors.
The consistency analysis between diagnostic patterns and pathological results was conducted using a confusion matrix to summarize the classification agreement, and Cohen’s Kappa statistic to quantify the level of agreement beyond chance.
The Shapiro–Wilk test was used to assess normality of diagnostic variables. The Pearson chi-square test evaluated the relationship between diagnostic and pathological findings. Receiver operating characteristic (ROC) curves were constructed, and area under the curve (AUC) values were calculated to assess diagnostic performance in differentiating mild from moderate-to-severe fibrosis. The DeLong test compared AUCs between diagnostic modalities. Optimal cutoff values were determined using the Youden index, and sensitivity and specificity were calculated accordingly. Paired diagnostic strategies were compared using McNemar’s test, and accuracy was assessed using the Pearson chi-square test. Statistical significance was defined as a two-sided P < 0.05.
A nomogram combining ultrasound composite parameters and clinical information was developed. The predictive model was internally validated using calibration curves, and its efficacy was assessed using ROC curves and decision curve analysis. Differences were considered statistically significant at P < 0.05.
Results
Participant Characteristics
A total of 202 patients were included in this study, Subjects demographic was presented in Table 1, comprising 85 females (42%) and 117 males (57.9%), with ages ranging from 17 to 75 years. Based on pathological semi-quantitative scores, 107 cases (53%) were diagnosed with mild renal fibrosis, and 95 cases (47%) were classified as moderate-to-severe renal fibrosis. The pathological diagnoses included membranous nephropathy (89 cases), IgA nephropathy (78 cases), hypertensive renal damage (15 cases), minor glomerular lesions (10 cases), and other conditions (10 cases).
 |
Table 1 The Baseline Characteristics of All Patients |
The study flow is illustrated in Figure 1, and representative renal ultrasound images for the different groups are shown in Figure 2. The moderate-to-severe renal fibrosis group had a higher mean age and a greater prevalence of hypertension and diabetes mellitus compared to the mild renal fibrosis group. However, there were no statistically significant differences between the two groups in terms of gender, body mass index (BMI), history of hyperlipidemia, or hyperuricemia (p > 0.05). Creatinine, estimated glomerular filtration rate (eGFR), and blood glucose levels were significantly higher in the moderate-to-severe renal fibrosis group, and there was also a statistically significant difference in hematuria-proteinuria between the two groups (p < 0.05).
 |
Figure 2 Multi-parameter ultrasound schematic diagram, mild renal fibrosis group (up-side) and moderate to severe renal fibrosis group (down-side). The number of green stars represents the quality of the SWE pictures, and four and more stars mean that the quality of SWE picture was qualified. |
Kidney and spleen elasticity values were significantly higher in the moderate-to-severe renal fibrosis group compared to the mild renal fibrosis group, while vascular density values and kidney length were lower (p < 0.05). No statistically significant differences were observed in renal parenchyma thickness, renal cortex thickness, CDFI end-vessel distance from the renal capsule, or hepatic shear wave elasticity values between the two groups (Table 1).
Assessment of Risk Factors for Moderate to Severe Renal Fibrosis in CKD Patients
The risk factors for severe renal fibrosis in CKD patients were screened by LASSO regression as age, history of diabetes, Glu, BUN, eGFR, proteinuria, renal elasticity value, splenic elasticity value and vascular density value, and further applied univariate and multivariate logistic regression to analyse the independent risk factors for severe renal fibrosis in CKD patients, and the results showed that the age (OR= 1.03, 95% CI 1.01–1.06, P=0.041), history of diabetes (OR=3.17, 95% CI 1.13–8.89, P=0.029), eGFR (OR=0.98, 95% CI 0.97–0.99, P=0.023), renal elasticity value RSWE (OR=1.22, 95% CI 1.10 −1.35, P<0.001), and vascular density value SRI (OR=0.92, 95% CI 0.88–0.95, P<0.001) were independent risk factors for moderate to severe renal fibrosis in patients with CKD (Table 2, Figure 3A and B).
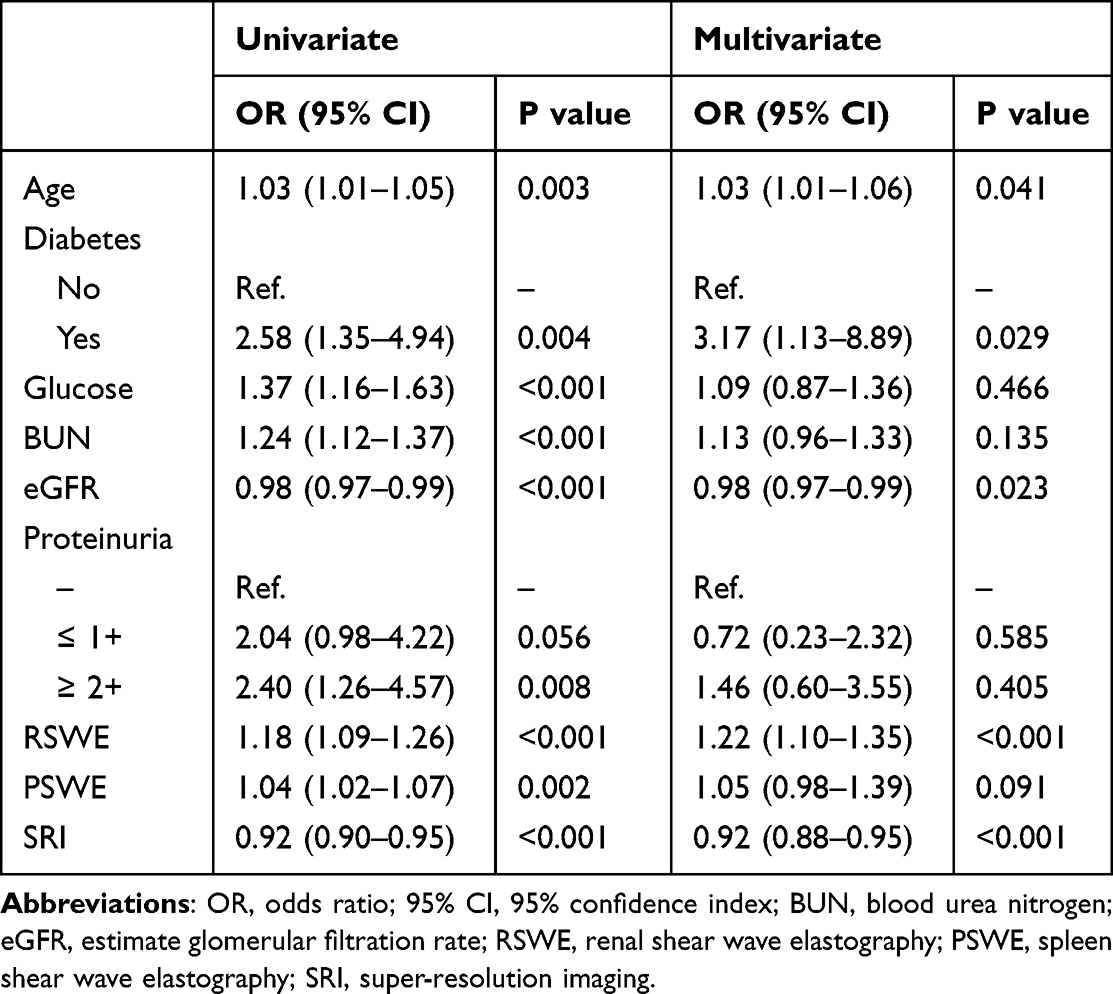 |
Table 2 Logistic Regression Analysis for the Predictors of Moderate to Severe Renal Fibrosis Selected by LASSO Regression |
 |
Figure 3 Screening of variables based on LASSO regression. (A) The variation characteristics of the coefficient of variables; (B) the selection process of the optimum value of the parameter λ in the Lasso regression model by cross-validation method, each colored line represents a variable. |
Comparison of Diagnostic Strategies and Analysis of Concordance with Pathological Findings
All diagnostic methods demonstrated statistically significant performance in differentiating mild from moderate-to-severe renal fibrosis (Table 3). The kappa values for diagnostic agreement were as follows: renal shear wave elasticity values (Kappa = 0.375), SRI vascular density values (Kappa = 0.474), serial scheme (Kappa = 0.445), parallel scheme (Kappa = 0.386), and integrated scheme (Kappa = 0.488).
 |
Table 3 Consistency Analysis Between Diagnostic Patterns and Pathological Results |
In individual diagnoses, the sensitivity and specificity of differentiating mild and moderate-to-severe renal fibrosis using SWE values were 82.1% (95% CI: 72.9–89.2) and 57.9% (95% CI: 48.0–67.4), respectively. For vascular density values, the sensitivity and specificity were 72.6% (95% CI: 62.5–81.3) and 74.8% (95% CI: 65.4–82.7), respectively. The serial scheme improved specificity to 86.9% (95% CI: 79.0–92.7) but reduced sensitivity to 56.8% (95% CI: 46.3–67.0), with an AUC of 0.72 (95% CI: 0.65–0.78). The parallel scheme achieved a high sensitivity of 97.9% (95% CI: 92.6–99.7) but a lower specificity of 42.1% (95% CI: 32.6–52.0), with an AUC of 0.70 (95% CI: 0.61–0.76). The integrated strategy, combining SWE and SRI vascular density values using a logistic regression algorithm, achieved a sensitivity of 80.4% (95% CI: 71.6–87.4) and specificity of 75.8% (95% CI: 65.9–84.0). Detailed performance metrics for all diagnostic strategies are provided in Table 4.
 |
Table 4 Comparison of Diagnostic Performance Between Various Approaches |
Establishment of Ultrasound Synthesis Parameters
Optimal threshold values were determined using the Youden index: SWE value = 10.7 kPa and SRI vascular density value = 47.3% (Figure 4A and B). Patients were grouped based on these cutoff values, and subgroup analyses were performed (Figure 5A–C).
 |
Figure 4 Scatter plots illustrating the trend of diagnostic metric changes for SWE value (A) and SRI (B) in relation to the Youden index variation. |
 |
Figure 5 The waterfall plot of SWE value (A), and SRI value (B) for each patient. (C) The forest plot revealed the results of subgroup analysis for moderate to severe renal fibrosis based on SWE and SRI in the crude cohort. |
Within the integrated strategy, the diagnostic formula derived from the logistic regression algorithm was as follows: Diagnostic probability = 1.88–0.08 × SRI vascular density value + 0.16 × RSWE value. Using the Youden index, the optimal diagnostic probability threshold was set at −0.02.
Construction and Evaluation of Predictive Models
We constructed a diagnostic model for predicting the risk of developing moderate-to-severe renal fibrosis in patients with CKD by combining clinical indicators and ultrasound composite parameters (Figure 6A). The addition of ultrasound composite parameters significantly improved predictive efficacy compared to models using clinical characteristics alone or individual ultrasound parameters (NRI = 0.511, 95% CI: 0.340–0.681, p < 0.001; IDI = 0.234, 95% CI: 0.170–0.298, p < 0.001) (Table 5).
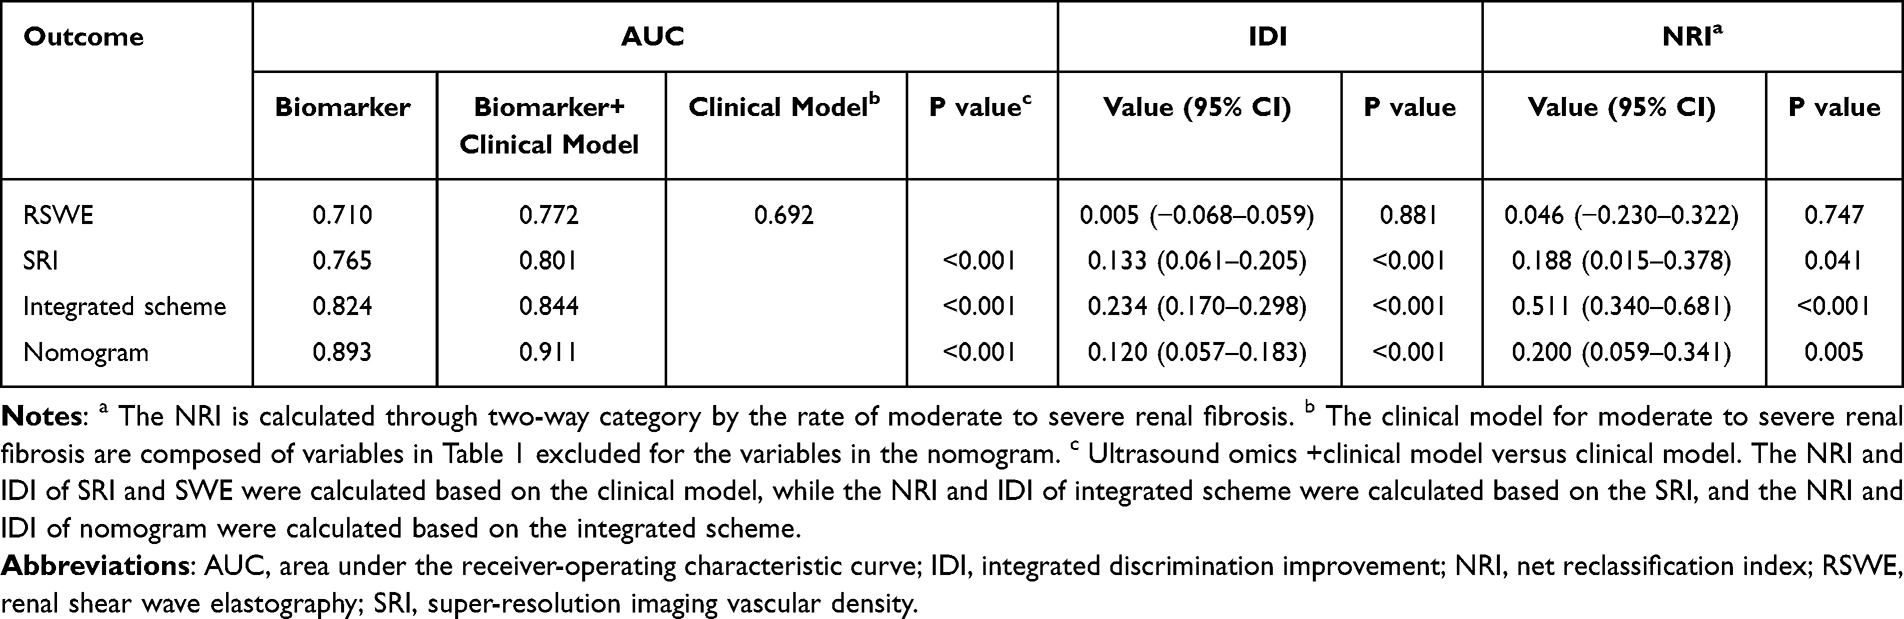 |
Table 5 NRI and IDI Analyses for Risk Reclassification of Moderate to Severe Renal Fibrosis |
 |
Figure 6 The nomogram for the risk of moderate to severe renal fibrosis in CKD patients(A). The receiver operating characteristic curve (B), the calibration curve (C), and the decision curve analysis (D) of the nomogram for moderate to severe renal fibrosis. |
The combined clinical-ultrasound model demonstrated excellent predictive performance (AUC = 0.893) and further improved predictive efficacy (NRI = 0.511, 95% CI: 0.340–0.681, p = 0.005; IDI = 0.12, 95% CI: 0.057–0.183, p < 0.001). The model exhibited strong discriminatory power (Figure 6B), good calibration (Figure 6C), and high clinical utility, as demonstrated by the decision curve analysis (Figure 6D).
Discussion
Chronic kidney disease (CKD) is characterized by chronic structural and functional renal dysfunction caused by various etiologies, resulting in a reduced glomerular filtration rate (GFR) persisting for more than three months.9 In China, the prevalence of CKD is rising annually, imposing a significant societal burden. Despite advances in traditional pharmacological therapies and renal replacement treatments, a substantial proportion of CKD patients progress to end-stage renal disease (ESRD), with a five-year survival rate for dialysis patients of less than 50%. Renal fibrosis is a hallmark of CKD, and renal biopsy remains the gold standard for its detection. However, due to the kidney’s strong compensatory capacity, irreversible damage often occurs by the time symptoms become apparent. Early intervention in CKD can improve patient prognosis, underscoring the importance of diagnosing renal fibrosis at an early stage.10 The quest for non-invasive diagnostic methods is driven by the limitations of traditional renal biopsies.
As CKD progresses, there is a notable cellular depletion in the renal tissue, which is supplanted by an extracellular matrix (ECM) within the glomerular and interstitial compartments. The relentless accumulation of ECM culminates in the formation of fibrotic lesions, leading to a significant architectural distortion within the kidney. The fibrotic kidneys exhibit an enhanced mechanical rigidity, attributed to the increased cross-linking of collagen and elastin fibers, which are hallmarks of the fibrotic process.11 Supersonic Imagine pioneered the development of the original 2D-SWE technology, and a multitude of research studies and systematic reviews have affirmed its efficacy in evaluating tissue fibrosis.12 Previous studies have confirmed that SWE can be used as a noninvasive tool to evaluate renal fibrosis.13,14 And it holds promise for monitoring disease progression during long-term follow-up.15 A meta-analysis including 1394 samples from 24 studies conducted by Cao et. al16 in 2023 showed that SWE is a good technique for diagnosing mild and severe renal fibrosis. Some researchers believe that the shear wave velocity of renal cortex in patients with renal fibrosis is significantly higher than that in normal control group, and it is positively correlated with the pathological grade of fibrosis,17 consistent with our findings. In this study, SWE values increased progressively with the severity of fibrosis, achieving a sensitivity of 82.1% in diagnosing renal fibrosis.
In the early stages of intrarenal diseases, microvascular damage is often subtle, with lesions initially confined to the distal capillary bed. As the disease progresses, reduced microvascular density leads to decreased renal perfusion, eventually involving larger vessels and resulting in diminished blood flow.18,19 Renal cortical microvascular hemodynamics, closely linked to renal function,4,5 plays a critical role in glomerular blood supply. However, renal microvessels are extremely fine (diameter < 200 μm), with slow blood flow,20 making their assessment challenging. Super-resolution imaging (SRI), combining ultrasound, ultra-fast frame rate imaging, advanced clutter filtering, and novel centering techniques, significantly enhances vascular resolution beyond the acoustic diffraction limit.21 By utilizing contrast microbubbles as point targets for localization and tracking, SRI enables precise mapping of microvessels and measurement of blood flow velocity.22 SRI has been applied in preclinical models and pilot clinical studies across neurology, oncology, nephrology, and cardiology. In renal applications, SRI’s high spatial resolution and quantitative hemodynamic measurements have visualized renal microvasculature in rats before and after renal ischemia.23 Huang et al24 demonstrated that SRI effectively assesses renal microcirculation in acute kidney injury (AKI) patients, offering a non-invasive technique for AKI diagnosis and quantitative evaluation. In our study, SRI vascular density values decreased with the severity of renal fibrosis and correlated positively with eGFR, indicating its utility in reflecting disease progression.
By comparing the diagnostic efficacy of SWE and SRI, we found that a series diagnostic strategy enhanced the detection of early mild renal fibrosis, while a parallel strategy improved the identification of moderate-to-severe fibrosis. However, these strategies involve a trade-off: increasing sensitivity often reduces specificity, and vice versa. In contrast, an integrated diagnostic approach demonstrated superior performance, achieving a balanced sensitivity and specificity that outperformed individual methods.25 This study is the first to combine parameters from SWE and SRI to derive a formula for ultrasound composite parameters, enabling a more accurate assessment of renal fibrosis severity and facilitating its inclusion in clinical research models.
In summary, this study identified independent predictors of renal fibrosis, compared the diagnostic efficacy of various ultrasound parameters, and introduced a novel composite parameter. A comprehensive nomogram was developed to enhance clinical decision-making. However, this study has limitations, including its single-center design and relatively small sample size. Future multicenter studies with larger cohorts are needed to validate these findings.
Abbreviations
CKD, chronic kidney disease; BMI, body mass index; CDFI, color Doppler flow imaging; eGFR, estimate glomerular filtration rate; RSWE, renal shear wave elastography; SRI, super-resolution imaging; LSWE, liver shear wave elastography; PSWE, spleen shear wave elastography; LASSO, least absolute shrinkage and selection operator.
Disclosure
The authors report no conflicts of interest in this work.
References
1. Kidney Disease: Improving Global Outcomes (KDIGO) CKD Work Group. KDIGO 2024 clinical practice guideline for the evaluation and management of chronic kidney disease. Kidney Int. 2024;105(4s):S117–s314. doi:10.1016/j.kint.2023.10.018
2. Zhang J, Liu L, Yang F, et al. Application value of real-time shear wave elastography for quantitative evaluation of chronic kidney disease in pediatric patients. Am J Transl Res. 2024;16(10):5595–5604. doi:10.62347/YDHS2063
3. Li S, Wang F, Sun D. The renal microcirculation in chronic kidney disease: novel diagnostic methods and therapeutic perspectives. Cell Biosci. 2021;11(1):90. doi:10.1186/s13578-021-00606-4
4. Chade AR. Renal vascular structure and rarefaction. Compr Physiol. 2013;3(2):817–831. doi:10.1002/j.2040-4603.2013.tb00504.x
5. Ballermann BJ, Obeidat M. Tipping the balance from angiogenesis to fibrosis in CKD. Kidney Int Suppl. 2014;4(1):45–52. doi:10.1038/kisup.2014.9
6. Hu Q, Wang XY, He HG, et al. Acoustic radiation force impulse imaging for non-invasive assessment of renal histopathology in chronic kidney disease. PLoS One. 2014;9(12):e115051. doi:10.1371/journal.pone.0115051
7. Li Q, Li J, Zhang L, et al. Diffusion-weighted imaging in assessing renal pathology of chronic kidney disease: a preliminary clinical study. Eur J Radiol. 2014;83(5):756–762. doi:10.1016/j.ejrad.2014.01.024
8. Stevens PE, Levin A. Evaluation and management of chronic kidney disease: synopsis of the kidney disease: improving global outcomes 2012 clinical practice guideline. Ann Intern Med. 2013;158(11):825–830. doi:10.7326/0003-4819-158-11-201306040-00007
9. Romagnani P, Remuzzi G, Glassock R, et al. Chronic kidney disease. Nat Rev Dis Primers. 2017;3(1):17088. doi:10.1038/nrdp.2017.88
10. Zhuang Z, Tong M, Clarke R, et al. Probability of chronic kidney disease and associated risk factors in Chinese adults: a cross-sectional study of 9 million Chinese adults in the Meinian onehealth screening survey. Clin Kidney J. 2022;15(12):2228–2236. doi:10.1093/ckj/sfac176
11. Nogueira A, Pires MJ, Oliveira PA. Pathophysiological mechanisms of renal fibrosis: a review of animal models and therapeutic strategies. In Vivo. 2017;31(1):1–22. doi:10.21873/invivo.11019
12. Ferraioli G, Wong VW, Castera L, et al. Liver ultrasound elastography: an update to the world federation for ultrasound in medicine and biology guidelines and recommendations. Ultrasound Med Biol. 2018;44(12):2419–2440. doi:10.1016/j.ultrasmedbio.2018.07.008
13. Qin C, Jin H, Zhang H, et al. Noninvasive assessment of interstitial fibrosis and tubular atrophy in renal transplant by combining point-shear wave elastography and estimated glomerular filtration rate. Diagnostics. 2021;12(1):18. doi:10.3390/diagnostics12010018
14. Chen Z, Ying TC, Chen J, et al. Using elastography-based multilayer perceptron model to evaluate renal fibrosis in chronic kidney disease. Ren Fail. 2023;45(1):2202755. doi:10.1080/0886022X.2023.2202755
15. Mancianti N, Garosi G, Iadanza E, et al. Using renal elastography to predict the therapeutic response of nephrological patients. J Clin Med. 2023;12(23):7385. doi:10.3390/jcm12237385
16. Cao H, Ke B, Lin F, et al. Shear wave elastography for assessment of biopsy-proven renal fibrosis: a systematic review and meta-analysis. Ultrasound Med Biol. 2023;49(5):1037–1048. doi:10.1016/j.ultrasmedbio.2023.01.003
17. Warner L, Yin M, Glaser KJ, et al. Noninvasive In vivo assessment of renal tissue elasticity during graded renal ischemia using MR elastography. Invest Radiol. 2011;46(8):509–514. doi:10.1097/RLI.0b013e3182183a95
18. Inker LA, Astor BC, Fox CH, et al. KDOQI US commentary on the 2012 KDIGO clinical practice guideline for the evaluation and management of CKD. Am J Kidney Dis. 2014;63(5):713–735. doi:10.1053/j.ajkd.2014.01.416
19. García IM, Altamirano L, Mazzei L, et al. Role of mitochondria in paricalcitol-mediated cytoprotection during obstructive nephropathy. Am J Physiol Renal Physiol. 2012;302(12):F1595–605. doi:10.1152/ajprenal.00617.2011
20. Sun D, Eirin A, Ebrahimi B, et al. Early atherosclerosis aggravates renal microvascular loss and fibrosis in swine renal artery stenosis. J Am Soc Hypertens. 2016;10(4):325–335. doi:10.1016/j.jash.2016.01.019
21. Harmon JN, Khaing ZZ, Hyde JE, et al. Quantitative tissue perfusion imaging using nonlinear ultrasound localization microscopy. Sci Rep. 2022;12(1):21943. doi:10.1038/s41598-022-24986-w
22. Song P, Rubin JM, Lowerison MR. Super-resolution ultrasound microvascular imaging: is it ready for clinical use? Z Med Phys. 2023;33(3):309–323. doi:10.1016/j.zemedi.2023.04.001
23. Andersen SB, Taghavi I, Hoyos CAV, et al. Super-resolution imaging with ultrasound for visualization of the renal microvasculature in rats before and after renal ischemia: a pilot study. Diagnostics. 2020;10(11):862. doi:10.3390/diagnostics10110862
24. Huang X, Zhang Y, Zhou Q, et al. Value of ultrasound super-resolution imaging for the assessment of renal microcirculation in patients with acute kidney injury: a preliminary study. Diagnostics. 2024;14(11):1192. doi:10.3390/diagnostics14111192
25. Chen Z, Wang Y, Gunda ST, et al. Integrating shear wave elastography and estimated glomerular filtration rate to enhance diagnostic strategy for renal fibrosis assessment in chronic kidney disease. Quant Imaging Med Surg. 2024;14(2):1766–1777. doi:10.21037/qims-23-962
 © 2025 The Author(s). This work is published and licensed by Dove Medical Press Limited. The
full terms of this license are available at https://www.dovepress.com/terms.php
and incorporate the Creative Commons Attribution
- Non Commercial (unported, 4.0) License.
By accessing the work you hereby accept the Terms. Non-commercial uses of the work are permitted
without any further permission from Dove Medical Press Limited, provided the work is properly
attributed. For permission for commercial use of this work, please see paragraphs 4.2 and 5 of our Terms.
© 2025 The Author(s). This work is published and licensed by Dove Medical Press Limited. The
full terms of this license are available at https://www.dovepress.com/terms.php
and incorporate the Creative Commons Attribution
- Non Commercial (unported, 4.0) License.
By accessing the work you hereby accept the Terms. Non-commercial uses of the work are permitted
without any further permission from Dove Medical Press Limited, provided the work is properly
attributed. For permission for commercial use of this work, please see paragraphs 4.2 and 5 of our Terms.