")
Back to Journals » Journal of Inflammation Research » Volume 17
Comparative Proteomic Analysis of Endolymphatic Sac Luminal Fluid in Patients with Meniere’s Disease and Controls
Authors Zhang Z, Wang Q, Zhou Z, Peng A, Jiang W
Received 29 July 2024
Accepted for publication 12 November 2024
Published 4 December 2024 Volume 2024:17 Pages 10209—10222
DOI https://doi.org/10.2147/JIR.S474910
Checked for plagiarism Yes
Review by Single anonymous peer review
Peer reviewer comments 2
Editor who approved publication: Professor Ning Quan
Zhiwen Zhang,1,* Qin Wang,1,* Zhou Zhou,1 Anquan Peng,1 Wenqi Jiang2
1Department of Otolaryngology-Head and Neck Surgery, The Second Xiangya Hospital, Central South University Changsha, People’s Republic of China; 2Department of Anesthesiology, Sun Yat-Sen University Cancer Center, State Key Laboratory of Oncology in South China, Collaborative Innovation Center for Cancer Medicine, Guangzhou, People’s Republic of China
*These authors contributed equally to this work
Correspondence: Wenqi Jiang, Department of Anesthesiology, Sun Yat-sen University Cancer Center, State Key Laboratory of Oncology in South China, Collaborative Innovation Center for Cancer Medicine, Guangzhou, People’s Republic of China, Tel +86-13570399853, Email [email protected]
Introduction: Meniere’s disease (MD) is known to be caused by the dysfunction of the endolymphatic sac (ES), but its molecular mechanism is unknown.
Methods: We performed a comparative proteomic analysis of ES luminal fluids (ELFs) from patients with MD and controls.
Results: We found 6 differentially expressed proteins, including 2 significantly increased proteins and 4 significantly decreased proteins, 8 proteins identified exclusively in at least 7 of the 8 ELF samples from MD patients and 3 proteins detected solely in at least 4 of the 5 ELF samples from controls.
Discussion: The increased levels of IGLV 3– 9 and IGLV1-47 in MD group compared with control group suggested an increased inflammatory reactions and a decreased level of Aldehyde dehydrogenase 2 in MD group compared with control group might result in oxidative damage and inflammatory lesions in the ES of MD. Whereas CD44 identified exclusively in MD samples might be involved in the metabolism of its ligand, hyaluronic acid for overproduction of endolymph in the ES of MD.
Keywords: proteomic, meniere’s disease, endolymphatic sac, endolymphatic sac luminal fluid
Introduction
Meniere’s disease (MD) is a common inner ear disorder. The cause of MD remains elusive; however, dysfunction of the endolymphatic sac (ES) is known to be related to the etiology of this disease.1 Previous studies have shown that the ES has an important role in regulating electrolyte homeostasis2 and endolymph pressure and volume,3 in the elimination of endolymphatic waste products4 and in the regulation of immune function in the inner ear.5 During pathological changes, the function of the ES may be compromised and endolymphatic hydrops (EH) may occur, resulting in fluctuating hearing loss and recurrent vertigo in patients with MD.6 Although histological studies on cadaveric specimens of human ES and animal models have indicated that pathological changes in the ES could be involved in the development of EH in MD,7–9 the molecular pathological mechanism underlying the secretion and resorption of endolymph in the sac is still unknown,1 and the exact role of ES in the pathophysiology of MD remains elusive. One of the main hindrances in elucidating how molecular pathological changes in the ES are involved in the etiology of MD is that the ES is a small structure (∼15 mm2) and is located in the bony canal of the vestibular aqueduct, reaching a dura mater duplicature in the posterior cranial fossa near the cerebellum.10 This complicates the study of ES fluid and limits the identification of biomarkers in the luminal fluid and the characterization of the dynamic changes in the functional activity in the epithelium of the ES.
Recently, there has been a growing interest in a “liquid biopsy” of the inner ear as an alternative to tissue biopsy for the identification of molecular biomarkers.11,12 Proteomic and metabolomic analyses of the perilymph from patients with sensorineural hearing loss who received cochlear implantation have been adopted to investigate the potential pathophysiological mechanisms in sensorineural hearing loss.13–16 Lin et al11 compared the proteomic profiles of perilymph from individuals with intact hearing and from patients with MD suffering from drop attacks who underwent a labyrinthectomy for vertigo control and identified 38 proteins with significantly differential abundance. Shew et al17 reported that patients with MD exhibited distinct microRNA expression profiles within both the perilymph and serum when compared with the control group. Furthermore, Kim et al12 performed a proteomic analysis of diluted ES luminal fluid (ELF; obtained from 200 µL normal saline infused into the ES) and reported that increased inflammatory responses in the inner ear may underlie the pathology of MD. Recently, Ölander et al18 reported an in vivo and in situ sampling probe technique for harvesting ES endolymph samples for the analysis of ES proteomic profiles, providing a novel method of sampling luminal fluid proteins. Recently, we described a specialized sampling technique that may reduce the risk of contamination of samples with other body fluids when collecting 2 µL diluted ELF from patients with MD who received endolymphatic duct blockage (EDB) for the treatment of intractable MD.19,20 By analyzing the cytokine levels in the ELF samples harvested from patients with MD or with acoustic neuroma (AN), an upregulated expression of interferon-gamma, interleukin-6 and tumor necrosis factor-alpha was found in the ELFs from the patients with MD.19 Furthermore, by performing untargeted metabolomic analysis on ELF samples collected from patients with MD or with AN, 7 significantly increased metabolites and 8 significantly decreased metabolites were detected in the ELFs from the patients with MD.20 These results may present an opportunity for improving the understanding of the molecular pathological mechanism of MD.
To further understanding of the change in protein levels in the endolymph of the ES during the development of MD, in the present study we used liquid chromatography-tandem mass spectrometry (LC-MS/MS) to perform proteomic analysis of ELF samples from patients with MD or with AN. The purpose of the present study was to identify any differentially expressed proteins in the ELF during MD pathogenesis.
Materials and Methods
ELF Sample Collection
Based on the 2015 criteria established by the Classification Committee of the Bárány Society for the diagnosis of MD,21 a total of 10 patients diagnosed with unilateral MD (sex, 4 females and 6 males; average age, 47.5 years, ranging 34–62 years; average duration of the disease, 28.6 months, ranging 21–58 months), who underwent EDB surgery for the treatment of intractable MD followed by Magnetic Resonance Imaging (MRI)-based visualization of unilateral EH, were enrolled into the MD group. In addition, 6 patients with AN (sex, 3 females and 3 males; average age, 56.2 years, ranging 45–65 years), who underwent translabyrinthine removal of a neuroma due to no serviceable hearing in the diseased ear, were enrolled into the control group. In the MD group, systemic autoimmune disease and vestibular migraine were ruled out in all cases. In the control group, patients with ipsilateral EH were excluded, as described in our previous study.20
The harvesting of ELF samples was performed as previously described.19 Briefly, after exposure of the ES lumen by incision of the proximal extraosseous ES, 2 μL sterile water was infused into the ES lumen followed by aspiration of 2 μL diluted luminal fluid (Figure 1a). Subsequently, the sample was transferred to an Eppendorf tube (Eppendorf SE) containing 100 µL sterile water for storage at −80°C until further analysis.19
 |
Figure 1 Workflow of ELF proteome analysis. (a) A calibrated disposable micropipette was used to infuse 2 µL sterile water into the lumen of the ES and then 2 µL diluted luminal fluid was aspirated from the lumen of the ES. (b) SDT Lysis Buffer was used to extract proteins from the ELF. (c) A total of 15 µL extracted protein supernatant was analyzed by SDS-PAGE. (d) A total of 2.5 µL extracted protein supernatant was quantified by BCA assay. (e) The remaining extracted protein supernatant was digested with trypsin into peptides. (f) ELF proteins were identified by LC-MS/MS. (g) Proteins were identified by database search algorithms. (h) Immunohistochemical analysis was used to validate the identified differentially expressed proteins in human ES. Abbreviations: BSA, bicinchoninic acid; ES, endolymphatic sac; ELF, ES luminal fluid; LC-MS/MS, liquid chromatography-tandem mass spectrometry. |
Sample Preparation for LC-MS/MS Analysis
SDT Lysis Buffer (Guanzhou Saiguo Biotech Co., Ltd.; cat no. ED-8452) was added to the ELF samples harvested from patients with MD or with AN as previously described.22 The samples were centrifuged at 14,000 x g for 15 min, the supernatant was collected (Figure 1b) and 15 µL supernatant from each sample was mixed with 6X loading buffer and boiled for 5 min. The proteins were then separated using a 12% SDS-PAGE gel (Beyotime Institute of Biotechnology; cat. no. P0015F) as previously described.23 The resulting protein bands were visualized by Coomassie Blue R-250 staining (Figure 1c).
To determine the total protein concentration, 2.5 µL supernatant from each sample was quantified using a bicinchoninic acid (BCA) Protein Assay Kit (Beyotime Institute of Biotechnology; cat. no. P0012) (Figure 1d). Subsequently, the proteins in the remaining collected supernatant samples were reduced with 100 mm DTT (Sigma-Aldrich; Merck KGaA; cat no. 43819–5G) for 5 min at 100°C (Figure 1e). Then, the detergent, DTT and other low molecular weight components were removed using UA buffer [8 M Urea (Bio-Rad Laboratories, Inc.; cat. no. 161–0731), 150 mm Tris-HCl (Merck KGaA; cat. no. 1185–53-1) pH 8.5] and repeated ultrafiltration (30 kDa cut-off; Sartorius AG; cat. no. VN01H22). Next, 100 µL iodoacetamide (IAA; Sigma-Aldrich; Merck KGaA; cat. no. 11149–5G) (100 mm IAA in UA buffer) was added to the samples for 30 min in the dark to cap reduced cysteine residues. The filters were washed with 100 µL UA buffer three times and then with 100 µL 50 mm NH4HCO3 (Sigma-Aldrich; Merck KGaA; cat. no. A6141-25G) buffer twice. Finally, the protein suspensions were digested with 4 μg trypsin (Promega Corporation, cat. no. V5117) in 40 µL 50 mm NH4HCO3 buffer overnight at 37°C, and the resulting peptides were collected as a filtrate. The peptide supernatants were desalted using a C18 cartridge (Waters China, Ltd.; cat. no. WAT023590) and the concentrations were estimated by UV light spectral density at 280 nm, using an extinction coefficient of 1.1 of 0.1% (g/l) solution, which was calculated based on the frequency of tryptophan and tyrosine residues in vertebrate proteins. The resulting peptide extracts were directly analyzed using LC-MS/MS or stored at −20°C (Figure 1f).
LC-MS/MS Analysis
LC-MS/MS analysis was conducted as described previously.24 Briefly, samples were processed using a nanoElute (Bruker Corporation) coupled to a timsTOF Pro (Bruker Corporation) equipped with a CaptiveSpray source (Figure 1g). A 25-cm x 75-μm analytical column with 1.6-μm C18 beads and a packed emitter tip (IonOpticks) was used to separate the peptides. The column temperature was maintained at 50°C using an integrated column oven (Sonation GmbH). The column was equilibrated using 4 column volumes of 100% buffer A [99.9% MilliQ water, 0.1% formic acid (FA; Thermo Fisher Scientific, Inc. cat. no. A117)] before the sample was loaded; both steps were performed at 800 bar. The samples were separated at 300 nl/min using a linear gradient of 2–25% buffer B [99.9% acetonitrile (Merck KGaA; cat. no. 1000304008), 0.1% FA] over 90 min, before increasing to 37% buffer B over 10 min, increasing to 80% buffer B over 10 min and sustaining at 80% buffer B for 10 min (total separation method time, 120 min). The timsTOF Pro was operated in PASEF mode. Settings: Mass range, 100–1700 m/z; 1/K0 start, 0.75 V⋅s/cm2 and end, 1.4 V⋅s/cm2; ramp time, 100 ms; lock duty cycle to 100%; capillary voltage, 1500 V; dry gas, 3 L/min; dry temperature, 180°C. PASEF settings: 10 MS/MS scans (total cycle time, 1.16 sec); charge range, 0–5; active exclusion, 0.5 min; scheduling target intensity, 10,000; intensity threshold 2500; CID collision energy, 20–59 eV.
The raw data were processed using Max Quant software (version 1.6.17.0)25,26 and human entries in the Swissprot/Uniprot database. An initial search was set at a precursor mass window of 6 ppm. The search followed an enzymatic cleavage rule of Trypsin/P and allowed a maximum of two missed cleavage sites and a mass tolerance of 20 ppm for fragment ions. Carbamidomethylation of cysteines was defined as the fixed modification, while protein N-terminal acetylation and methionine oxidation were defined as the variable modifications for database searching. The cut-off for the global false discovery rate for peptide and protein identification was set to 0.01. The normalized spectral protein intensity (LFQ intensity) was used to calculate protein abundance. Differentially expressed proteins were defined as fold change >2 or <0.5 and p value (Student’s t test) <0.05.
Bioinformatics Analysis
Gene Ontology Annotation (GOA): Proteins were subjected to GOA classification using UniProt.27 The UniProt website (http://www.uniprot.org) can be used to map information regarding the identified proteins. The proteins were also classified into the GO molecular function, biological process and cellular compartment categories and described using a standardized vocabulary. For the functional enrichment of GO and protein domain analyses, a two-tailed Fisher’s exact test was used to test the enrichment of target proteins, and a corrected p < 0.05 was considered significant. Protein cluster analysis was performed using the ComplexHeatmap R package (R, version 3.4). The filtered P matrix was transformed using -log10 (p-value). Enrichment-based clustering was visualized using the R package heatmap (version 2.03).
Kyoto Encyclopedia of Genes and Genomes (KEGG) pathway annotation: Pathway analysis was performed using the KEGG database. The Fisher’s exact test was used to identify the significantly enriched pathways by comparing the number of differentially expressed proteins between the MD and AN groups, and the proteins identified only in the MD group and the proteins identified only in the AN group.
Immunohistochemistry of Human ES (Figure 1h)
Sac specimens were harvested from the aforementioned 8 patients with MD and 5 patients with AN. The method for collecting and preparing the sac specimens for immunohistochemical analysis was as described previously.19,20 Briefly, following deparaffinization, rehydration and antigen retrieval of the specimen slides, 10% normal horse serum (Abcam; cat. no. AB7484) in PBS was used to block the slides for 1 h. Subsequently, primary antibodies (100 µL, 1:400) against aldehyde dehydrogenase 2 (ALDH2; Abcam; cat. no. ab227021; rabbit polyclonal) and CD44 (Abcam; cat. no. ab119348; rat monoclonal) in 0.1% Triton-PBS (Ziker Biological technology Co., Ltd.; cat. no. ZK-L1578) were incubated with the samples overnight at 37°C. Negative controls were performed using PBST in place of the primary antibody. The slides were incubated with horseradish peroxidase conjugated secondary antibody (Beyotime Institute of Biotechnology; 1:200) for 1 h at room temperature, and then washed three times in PBS. The samples were subsequently incubated in diaminobenzidine solution (FUJIFILM Wako Pure Chemical Corporation; 1:50) for visualization. After final wash steps using PBS, the samples were dehydrated and mounted with cover glasses.
For the double labeling immunofluorescence staining, following incubation with the primary antibodies, the slides were incubated with fluorescent secondary antibodies (Thermo Fisher Scientific, Inc; cat. no. A-11034; 1:400) for 2 hours at 37°C. The slides were then washed with 0.1 M PBS and mounted using antifading medium with DAPI (Vector Laboratories, Inc.; Maravai LifeSciences; cat. no. H-1800). Confocal images were acquired using a laser scanning confocal microscope (Leica TCS SP5, Leica Microsystems GmbH, Mannheim, Germany) equipped with 561 and 633 nm lasers for excitation and a 63x oil immersion objective (1.4 NA, Leica). Confocal microscopy analysis was used to reveal the subcellular localization of ALDH2 and CD44 in the membrane, cytoplasm and nucleus of the ES epithelium.
Quantitative Analysis of the ALDH2 and CD44 Fluorescence Intensities
To compare the ALDH2 and CD44 expression levels in the ES epithelium of patients with MD or with AN, the fluorescence intensities of ALDH2 and CD44 in three non-consecutive sections from the same specimen were measured, for determining the mean and standard deviation (mean ± SD) values of the DAPI-stained epithelial area using ImageJ software (National Institutes of Health), as described in our previous study.20 The Mann–Whitney U-test was used to analyze the statistical significance. P<0.05 was considered to indicate a statistically significant difference.
Results
Patient Characteristics
From July 2021 to July 2022, EDB surgery was performed at our hospital on 10 patients who had a normoplastic ES for the treatment of intractable unilateral MD, according to the classification of the intraoperative pathoanatomic findings of the sac in MD.28 A total of 10 diluted ELF samples were harvested from 10 patients with MD, whereas only 6 control ELF samples were collected from 8 patients with AN who underwent translabyrinthine removal of a neuroma as 2 samples were excluded due to possible blood contamination. The sex distribution and mean age of patients in the MD group did not differ significantly from that in the control group (p<0.05, χ2 test and Mann–Whitney U-test).
Analysis of the ELFs
The SDS-PAGE results revealed that a protein band with a molecular weight of 70 kDa was found in all ELF samples from both the patients with MD and the patients with AN, as shown in Figure 2A.
 |
Figure 2 (A) SDS-PAGE gel showing a clear protein band with a molecular weight of 70 kDa in the ELFs from patients with MD (A1, A3, A4, A5, A6, A7, A9 and A10) and patients with AN (N1, N2, N3, N4 and N6), and a very weak protein band in the ELFs from patients with MD (A2 and A8) and a patient with AN (N5). (B) There was no statistically significant difference in the mean protein content between ELF samples in the MD and AN groups. (C) Number of identified proteins in at least 4 out of the 8 analyzed ELFs from patients with MD and/or at least 3 out of the 5 analyzed ELFs from patients with AN, including proteins identified only in the MD (147) or the AN (13) groups, and proteins identified in both of the two groups (380). Abbreviations: ELF, endolymphatic sac luminal fluid; MD, Meniere’s disease; AN, acoustic neuroma. |
The results of the BCA assay demonstrated that the mean protein content of the 10 ELF samples collected from patients with MD and the 6 ELF samples collected from patients with AN were 0.169±0.113 µg/µL and 0.152±0.086 µg/µL, respectively. There was no statistically significant difference in the mean protein content between the ELF samples of the two groups (p=0.753; Figure 2B). However, 2 ELF samples from patients with MD (patients no. 2 and 8) and 1 ELF sample from a patient with AN (patient no. 5) were excluded for further LC-MS/MS analysis due to a very weak SDS-PAGE protein band (Figure 2A) and an extremely low protein concentration (≤0.01 µg/µL). Therefore, a total of 8 ELF samples from patients with MD and 5 ELF samples from patients with AN were subjected to LC-MS/MS analysis.
Protein Identification and Screening of Differentially Abundant Proteins in the ELFs from Patients with MD and an
A total of 1068 protein groups (Supplementary Table S1) were identified in the samples, when it was not considered in how many samples the protein was detected. However, a total of 540 protein groups were detected in at least 4 out of the 8 analyzed ELF samples from patients with MD and/or at least 3 out of the 5 analyzed ELF samples from patients with AN, including 380 proteins found in both groups, 147 proteins identified only in the MD group and 13 proteins identified only in the AN group (Supplementary Table S2 and Figure 2C).
A quantitative analysis of the label-free intensity values of the 380 proteins found in at least 4 out of the 8 analyzed ELF samples in the MD group and in at least 3 out of the 5 analyzed ELF samples in the control group was performed. A total of 167 proteins showed a higher abundance in the MD group, whereas 213 proteins showed a higher abundance in the control group (Supplementary Table S3). Using fold change >2 or <0.5 and p value (Student’s t test) <0.05 as the thresholds, a total of 6 differentially expressed proteins were found between the ELF samples in the MD and control groups. The levels of immunoglobulin lambda variable (IGLV) 3–9 and IGLV1-47 were significantly increased in the ELFs from patients with MD, whereas the levels of RAS-related nuclear protein (RAN), purine nucleoside phosphorylase (PNP), thymosin beta 4 (Tmsb4x) and ALDH2 were significantly decreased in the ELFs from patients with MD (Table 1). Volcano plots were used to show the upregulated and downregulated proteins in the MD group compared with the control group (Figure 3). Hierarchical clustering was performed on the 6 differentially expressed proteins (Figure 4), showing the proteins differentially expressed in the ELFs obtained from patients with MD and from patients with AN. Of the 147 proteins identified only in the samples from patients with MD, 8 were detected in at least 7 of the 8 ELF samples (Table 2). Of the 13 proteins identified only in the samples from patients with AN, 3 were detected in 4 of the 5 ELF samples (Table 3).
 |
Table 1 A Total of 6 Differentially Expressed Proteins Between the Endolymphatic Sac Luminal Fluid Samples of Patients with Meniere’s Disease and Patients with Acoustic Neuroma |
 |
Table 2 A Total of 8 Proteins Were Solely Identified in at Least 7 Out of the 8 Endolymphatic Sac Luminal Fluid Samples of Patients with Meniere’s Disease |
 |
Table 3 A Total of 3 Proteins Were Solely Identified in at Least 4 of the 5 Endolymphatic Sac Luminal Fluid Samples from Patients with Acoustic Neuroma |
 |
Figure 3 Volcano plots showing the upregulated and downregulated proteins in the ELFs from patients with MD compared with patients with AN. Abbreviations: ELF, endolymphatic sac luminal fluid; MD, Meniere’s disease; AN, acoustic neuroma. |
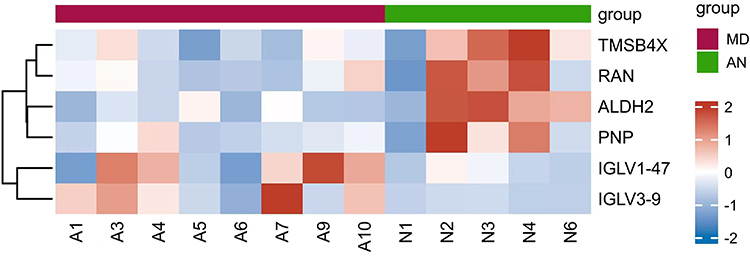 |
Figure 4 Hierarchical clustering showing the proteins differentially expressed between ELFs obtained from patients with MD (A1, A3, A4, A5, A6, A7, A9 and A10) versus ELFs obtained from patients with AN (N1, N2, N3, N4 and N6). A deep red color indicates higher spectral counts. Abbreviations: ELF, endolymphatic sac luminal fluid; MD, Meniere’s disease; AN, acoustic neuroma. |
Functional Analysis of the Uniquely Identified Proteins in the ELFs from Patients with MD and an
To cluster the 166 uniquely identified proteins in the ELF samples, including the 6 differentially expressed proteins between the MD and control groups, the 147 proteins identified only in the MD samples and the 13 proteins identified only in the AN sample, GO, KEGG pathway and protein domain enrichment analyses were performed. The GO analysis revealed that the three most prominent terms in the biological processes category were the arginine metabolic process, proline metabolic process and antimicrobial humoral response. In the molecular function category, the three most prominent terms were metallocarboxypeptidase activity, metalloendopeptidase inhibitor activity and protein tyrosine phosphatase activator activity. In the cellular component category, the three most prominent terms were insulin-like growth factor ternary complex, platelet dense granule lumen and membrane part (Figure 5A). The KEGG pathway analysis revealed that the top three significantly enriched signaling pathways were involved in arginine and proline metabolism, tyrosine metabolism and carbon metabolism (Figure 5B). Based on the InterPro database (https://www.ebi.ac.uk/interpro/), the protein domain enrichment analysis revealed that cysteine-rich flanking region, alcohol dehydrogenase-C-terminal and dehydrogenase-N-terminal were the top three protein domain enrichment categories of the 166 identified proteins (Figure 5C).
 |
Figure 5 Bubble charts of 166 uniquely identified proteins in the ELF samples, including 6 differentially expressed proteins between the MD and AN group, 147 proteins identified only in the MD group and 13 proteins identified only in the AN group assessed by (A) GO, (B) KEGG pathway and (C) protein domain enrichment analyses. Each bubble in the chart represents the number of differentially expressed proteins. Abbreviations: P, Biological Process; F, Molecular Function: C, Cellular Component: ELF, endolymphatic sac luminal fluid; MD, Meniere’s disease; AN, acoustic neuroma; KEGG, Kyoto Encyclopedia of Genes and Genomes; GO, Gene Ontology. |
Immunohistochemical Detection of ALDH2 and CD44 Expression in the ES Specimens Harvested from Patients with MD or with an
Among the 166 uniquely identified proteins in the ELF samples, including 6 differentially expressed proteins between the MD and control groups, 147 proteins identified only in the MD group and 13 proteins identified only in the AN group, 2 proteins, ALDH2 and CD44, were selected for further validation. This was because ALDH2 was found to be ~0.26-fold decreased in the ELF from the MD group compared with the AN group, which was the lowest among the down-regulated proteins (Table S2), whereas CD44 was the only one detected in all the 8 ELF samples in the MD group but was not identified in any ELF sample in the AN group (Table S2).
The immunohistochemical results revealed that there was weak staining for ALDH2 and intense staining for CD44 in the ES epithelium from patients with MD, as shown in Figures 6 and 7. By contrast, strong staining for ALDH2 and weak staining for CD44 was found in the ES epithelium from patients with AN, as shown in Figures 6 and 7. Fluorescence intensity analysis demonstrated that the ALDH2 and CD44 fluorescence intensities in the DAPI-stained epithelial area were 0.565±0.219 and 2.317±0.749 in patients with MD and 1.447±0.485 and 0.735±0.254 in patients with AN, respectively. Furthermore, the differences in the fluorescence intensity of CD44 (p=0.001) and ALDH2 (p=0.001) in the DAPI-stained epithelial area of the ES between the MD and control groups were statistically significant (Figure 8).
 |
Figure 6 Representative immunohistological images of CD44 and ALDH2 in ES tissue sections from patients with MD or with AN. No staining was found in the ES epithelium (arrow) in the negative controls in the patients with MD (A) and patients with AN (D). A weak expression of ALDH2 (B) (arrow) and a strong expression of CD44 (C) (arrow) were found in the ES epithelium of the patients with MD; while ALDH2 staining was strong (E) (arrow) and CD44 signal was extremely weak (F) (arrow) in the ES epithelium of the patients with AN. |
 |
Figure 7 Representative images of the co-expression of CD44 and ALDH2 in ES tissue sections from patients with MD or with AN. Immunofluorescence staining showing a strong signal for (A) CD44 (red; white arrow) and (B) weak staining for ALDH2 (green; pink arrow) in the ES epithelium of patients with MD. (C) ES epithelium nucleus of patients with MD. (D) Merged image of the immunofluorescent labeling for CD44 and ALDH2 showing a pink color in the ES epithelium of patients with MD. Immunofluorescence staining showing (E) weak staining for CD44 (red; white arrow) and (F) a strong signal for ALDH2 (green; pink arrow) in the ES epithelium and the subepithelial connective-tissue (blue arrow) of patients with AN. (G) ES epithelium nucleus of patients with AN. (H) Merged image of the immunofluorescent labeling for CD44 and ALDH2 showing weak green fluorescence in the ES epithelium of patients with AN. Scale bars (A-H), 25 µm. Abbreviations: ALDH2, aldehyde dehydrogenase 2; MD, Meniere’s disease; AN, acoustic neuroma; ES, endolymphatic sac. |
 |
Figure 8 ALDH2 and CD44 fluorescence intensity values of the DAPI-stained ES epithelial area of the MD group compared with the AN group. Abbreviations: MD, Meniere’s disease; AN, acoustic neuroma; ES, endolymphatic sac; ALDH2, aldehyde dehydrogenase 2. |
Discussion
In the present study, label-free LC-MS/MS based shot-gun proteomics was applied to investigate local changes in protein levels in ELF samples collected from patients with MD or with AN. To the best of our knowledge, the present study was the first to explore MD-specific changes in proteins in the ES. Of the 380 proteins detected in at least 4 out of the 8 analyzed ELF samples from patients with MD and in at least 3 out of the 5 analyzed ELF samples from patients with AN, 6 differentially expressed proteins were identified using Student’s t-test, 2 of which were significantly increased and 4 of which were significantly decreased. Of the 147 proteins identified only in the samples from patients with MD, 8 were detected in at least 7 of the 8 ELF samples. Of the 13 proteins identified only in the samples from patients with AN, 3 were detected in 4 of the 5 ELF samples. Following analysis of the immunohistochemical results of the sac specimens collected from the aforementioned 8 patients with MD and 5 patients with AN, ALDH2 (a differentially expressed protein found to be ~0.26-fold decreased in the ELF from patients with MD compared with the ELF from patients with AN) was confirmed to be downregulated, whereas CD44 protein (identified in all 8 ELF samples in the MD group but not identified in every ELF sample in the control group) was confirmed to be upregulated in the ES epithelium from the patients with MD. These proteins found to be significantly altered (in terms of expression) in the ES of patients with MD in the present study may improve our understanding of the molecular pathological changes that underlie the mechanism of MD.
The ES is the “source” of the immune reaction in the inner ear,29 and abnormal immune activity is frequently found in the ES of patients with MD.19,30,31 Previous studies have reported that a chronic inflammatory process underlies MD in two inflammatory subtypes of patients based on the proinflammatory cytokines and methylation profile status,32–34 and an increased immune response in the ES of patients with MD.19 In the present study, an increased level of IGLV3-9 and IGLV1-47 in the ELF from patients with MD compared with ELF from AN further supported that increased inflammatory reactions in the ES may underlie the pathology of MD.19,33,34 Moreover, since the expression levels of Tmsb4x, D-dopachrome tautomerase (DDT) and extracellular matrix protein, tenascin-C (TNC), have been reported to be involved in regulating immune response during inflammation and tissue remodeling,35–37 the downregulated expression of Tmsb4x and the expression of TNC and DDT in only the patients with MD in the present study further suggested that persistent inflammatory activity may exist in the ES of patients with MD.
Although numerous medical therapies and surgical interventions have been considered in the treatment of MD,37 at present, there is no standard treatment for this disease. However, restriction of alcohol intake is routinely recommended for the treatment of MD.38 Notably, in the present study, protein domain enrichment analysis of 166 uniquely identified proteins in the ELF samples revealed that alcohol dehydrogenase-C-terminal, alcohol dehydrogenase-N-terminal and alcohol dehydrogenase, zinc-type, conserved site were the top enriched categories, suggesting that various alcohol dehydrogenase isoenzymes might be involved in the metabolism of the ES in patients with MD. A faster acetaldehyde-producing enzyme, ADH1B,39 detected solely in the ELF samples from patients with MD, a major acetaldehyde-metabolizing enzyme, mitochondrial ALDH2,39 which had a significantly lower abundance in the ES from patients with MD, and a cytosolic aldehyde dehydrogenase, ALDH9A1,40 solely detected in the ELF samples from patients with AN and not found in the MD samples suggested that an increased accumulation of acetaldehyde may occur in the ES of patients with MD, while alcohol consumption may compromise the function of the ES in the development of MD.41 This hypothesis may explain why the restriction of alcohol intake is strongly recommended for controlling vertigo in MD.
Notably, except for the detoxification of ethanol-derived acetaldehyde, more evidence has accumulated in recent years to indicate that the most important physiological role of ALDH2 is to catalyze the oxidation of endogenous aldehydes, especially lipid peroxidation-derived reactive aldehyde under oxidative stress, to reduce the risk of suffering from cardiovascular disease, Alzheimer’s disease and traumatic brain injury.42–44 Previous studies have also reported that oxidative stress may be involved in the development of EH and hearing loss in the late stages of MD.11 An increased level of inducible nitric oxide synthase and nitric oxide45 was observed in the hydropic vestibule in both an animal model46 and patients with MD.47,48 In the present study, it was found that stress induced phosphoprotein 1 and oxidative stress-responsive kinase 1 were identified solely in the ELF samples from patients with MD, further suggesting that oxidative stress may be involved in the pathogenesis of MD. Although the precise role of ALDH proteins in the inner ear remains unknown, in the present study, ALDH2 protein was found to be significantly decreased in the ELF samples from patients with MD, and confirmed to be downregulated in the epithelium of the ES in patients with MD (Figures 6 and 7), suggesting the capacity of removing endogenous aldehydes might be reduced in the ES of patients with MD, leading to increase the accumulation of oxidative stress-induced lipid peroxidation such as 4-HNE in the ES of patients with MD that has been reported in our previous study.20 Subsequently, this accumulation of endogenous aldehydes was likely to deteriorate the function of ES, resulting in a reduced absorption of endolymph in ES and the development of EH in MD.41 Therefore, we speculated that a downregulation of ALDH2 in the ES of patients with MD may lower its capacity to protect the ES from aldehyde toxicity such as 4-HNE, and result in oxidative damage and inflammatory lesions of the ES underlying the pathogenesis of MD.
CD44 is a membrane glycoprotein, is the main receptor for hyaluronic acid (HA) and is considered to play a vital role in mediating development, inflammation, immune responses, wound healing and cancer progression.49,50 Although the distribution and physiological role of CD44 in the ES has been scarcely described in the literature, its ligand, HA, has been reported to be synthesized in ES epithelial cells and subsequently secreted into the ES lumen for regulation of inner ear fluid volume and pressure.51,52 Recently, we reported that HA levels are ~3-fold increased in the ELF of patients with MD compared with ELF from the control group, and confirmed that HA was upregulated in the epithelium of ES samples from patients with MD.20 In the present study, CD44 was solely identified in all 8 ELF samples in the MD group and confirmed to be upregulated in the ES epithelium samples from patients with MD (Figures 6 and 7). As CD44 is known to play an important role in HA metabolism regulation53,54 and mediate most of the endogenous effects of HA through CD44-HA interactions,55 an increased level of CD44 might mediate HA metabolism to increase the expression of HA in the ES of patients with MD that has be observed in our previous study,20 whereby an elevated level of HA in the ES of patients with MD was speculated to attract more ions and water by its anionic charges and hydrophilic properties and further the influx of water to the endolymphatic space for the development of EH.56,57 However, the precise role of an increased level of CD44 in the ES should be confirmed in further studies.
However, limitations exist in the present study. First, as harvesting ELF from healthy individuals is almost impossible due to ethical reasons, the lack of data from normal hearing subjects further limited the presented results. Second, as only a small group of patients with MD who had a normoplastic ES were indicated for EDB treatment following the failure of medical therapy, the sample size was limited in the present study. Therefore, additional studies using larger cohorts are necessary to verify our findings. In addition, the results of the present study depicted the differentially expressed proteins in the ES from patients with MD who had a normoplastic sac rather than patients with MD who had an atrophic sac. Furthermore, as the change in protein levels in the ES may not be the same in the patients with different time of the disease, additional studies between the patients with different time of onset of EH development are necessary to validate our findings in larger cohorts. If ethically feasible, the use of the ELF from healthy individuals with normal hearing as control may improve our study.
In summary, to the best of our knowledge, the present study was the first proteomic study performed on ELF samples collected from 8 patients with MD and 5 patients with AN to identify 2 significantly increased proteins and 4 significantly decreased proteins, 8 proteins only detected in at least 7 out of the 8 ELF samples in the MD group and 3 proteins only detected in at least 4 out of the 5 ELF samples in the AN group. Among these differentially expressed proteins, the increased levels of IGLV3-9 and IGLV1-47 in the ELF samples from patients with MD suggested that the inflammatory response in the ES may underlie the pathology of MD. The downregulated expression of ALDH2 in the ELF samples from patients with MD may be related to the increased levels of oxidative stress-induced endogenous aldehydes such as 4-HNE, in the ES, resulting in oxidative damage and inflammatory lesions of the ES underlying the pathogenesis of MD. While CD44, found only in the ELF samples from patients with MD, may be involved in the metabolism of its ligand, HA, for the regulation of ES fluid volume and pressure in these patients. As the level of ALDH2 was found to be ~0.26-fold decreased in the ELF samples from patients with MD, and CD44 was detected in all 8 ELF samples from patients with MD but was not identified in every ELF sample from the AN group, these two proteins in the ES of patients with MD may be important biomarkers underlying the mechanism of this disease and possible therapeutic targets for treatment of MD. However, more studies are required to further elucidate the role of these proteins of interest in the development of MD.
Abbreviations
ES, endolymphatic sac; MD, Meniere’s disease; ELFs, ES luminal fluids; AN, acoustic neuroma; LC-MS/MS, liquid chromatography-tandem mass spectrometry; ALDH2, aldehyde dehydrogenase 2; EH, endolymphatic hydrops.
Data Sharing Statement
All the data generated or analyzed during this study are included in this published article or are available from the corresponding author on reasonable request.
Informed Consent
All participants provided informed consent for the collection of endolymphatic sac luminal fluid in the present study, which was in accordance with the national legislation and the Declaration of Helsinki. The present study was approved by the Medical Ethics Committee of The Second Xiangya Hospital (approval no. S452).
Author Contributions
All authors made a significant contribution to the work reported, whether that is in the conception, study design, execution, acquisition of data, analysis and interpretation, or in all these areas; took part in drafting, revising or critically reviewing the article; gave final approval of the version to be published; have agreed on the journal to which the article has been submitted; and agree to be accountable for all aspects of the work.
Funding
This study was supported by National Natural Science Foundation of China (Grant No. 82301326) and Natural Science Foundation of Hunan province (Grant No.2022JJ30829). And the funder has no interest relationship with our study.
Disclosure
The authors declare that the research was conducted in the absence of any commercial or financial relationships that could be construed as a potential conflict of interest.
References
1. Kim SH, Nam G-S, Choi JY. Pathophysiologic findings in the human endolymphatic sac in endolymphatic hydrops: functional and molecular evidence. Ann Otol Rhinol Laryngol. 2019;128(6S):76S–83S. doi:10.1177/0003489419837993
2. Mori N, Miyashita T, Inamoto R, et al. Ion transports its regulation in the endolymphatic sac: suggestions for clinical aspects of Meniere’s disease. Eur Arch Otorhinolaryngol. 2017;274(4):1813–1820. doi:10.1007/s00405-016-4362-1
3. Salt AN. Regulation of endolymphatic fluid volume. Ann N Y Acad Sci. 2001;942(1):306–312. doi:10.1111/j.1749-6632
4. Rask-Andersen H, Stahle J. Immunodefence of the inner ear? Lymphocyte-macrophage interaction in the endolymphatic sac. Acta Otolaryngol. 1980;89:283–294. doi:10.3109/00016488009127140
5. Kampfe Nordstrom C, Danckwardt-Lilliestrom N, Laurell G, Liu W, Rask-Andersen H. The human endolymphatic sac and inner ear immunity: macrophage interaction and molecular expression. Front Immunol. 2018;9:3181. doi:10.3389/fimmu.2018.03181
6. Kim H-M, Wangemann P. Failure of fluid absorption in the endolymphatic sac initiates cochlear enlargement that leads to deafness in mice lacking pendrin expression. PLoS One. 2010;5(11):e14041. doi:10.1371/journal.pone.0014041
7. Møller MN, Caye-Thomasen P, Qvortrup K. Oxygenated fixation demonstrates novel and improved ultrastructural features of the human endolymphatic sac. Laryngoscope. 2013;123(8):1967–1975. doi:10.1002/lary.23929
8. Mori N, Miyashita T, Inamoto R, et al. Ion transports its regulation in the endolymphatic sac: suggestions for clinical aspects of Meniere’s disease. Europ Archiv Oto-Rhino-Laryngol. 2016;274(4):1813–1820. doi:10.1007/s00405-016-4362-1
9. Ignatova EG, Thalmann I, Xu B, Ornitz DM, Thalmann R. Molecular mechanisms underlying ectopic otoconia-like particles in the endolymphatic sac of embryonic mice. Hear Res. 2004;194(1–2):65–72. doi:10.1016/j.heares.2004.03.019
10. Friberg U, Jansson B, Rask-Andersen H, Bagger-Sjoback D. Variations in surgical anatomy of the endolymphatic sac. Arch Otolaryngol Head Neck Surg. 1988;114(4):389–394. doi:10.1001/archotol.1988.01860160033016
11. Lin H-C, Ren Y, Lysaght AC, Kao S-Y, Stankovic KM. Proteome of normal human perilymph and perilymph from people with disabling vertigo. PLoS One. 2019;14:e0218292. doi:10.1371/journal.pone.0218292
12. Kim SH, Kim JY, Lee HJ, et al. Autoimmunity as a candidate for the etiopathogenesis of Meniere’s disease: detection of autoimmune reactions and diagnostic biomarker candidate. PLoS One. 2014;9:e111039. doi:10.1371/journal.pone.0111039
13. Schmitt HA, Pich A, Schroder A, et al. Proteome analysis of human perilymph using an intraoperative sampling method. J Proteome Res. 2017;16:1911–1923. doi:10.1021/acs.jproteome.6b00986
14. Schmitt HA, Pich A, Prenzler NK, et al. Personalized proteomics for precision diagnostics in hearing loss: disease-specific analysis of human perilymph by mass spectrometry. ACS Omega. 2021;6(33):21241–21254. doi:10.1021/acsomega.1c01136
15. St Peter M, Warnecke A, Staecker H. A Window of opportunity: perilymph sampling from the round window membrane can advance inner ear diagnostics and therapeutics. J Clin Med. 2022;11(2):316. doi:10.3390/jcm11020316
16. Mavel S, Lefèvre A, Bakhos D, Dufour-Rainfray D, Blasco H, Emond P. Validation of metabolomics analysis of human perilymph fluid using liquid chromatography-mass spectroscopy. Hear Res. 2018;367:129–136. doi:10.1016/j.heares.2018.05.016
17. Shew M, Wichova H, St Peter M, Warnecke A, Staecker H. Distinct MicroRNA profiles in the perilymph and serum of patients with Menière’s Disease. Front Neurol. 2021;12:646928. doi:10.3389/fneur.2021.646928
18. Ölander C, Rasmussen JE, Eriksson PO, et al. The proteome of the human endolymphatic sac endolymph. Sci Rep. 2021;11(1):11850. doi:10.1038/s41598-02-89597-3
19. Huang C, Wang Q, Pan X, et al. Up-regulated expression of interferon-gamma, interleukin-6 and tumor necrosis factor-alpha in the endolymphatic sac of Meniere’s disease suggesting the local inflammatory response underlies the mechanism of this disease. Front Neurol. 2022;13:781031. doi:10.3389/fneur.2022.781031
20. Huang L, Wang Q, Huang C, Zhou Z, Peng A, Zhang Z. Untargeted metabolomic analysis in endolymphatic sac luminal fluid from patients with Meniere’s Disease. J Assoc Res Otolaryngol. 2023;24(2):239–251. doi:10.1007/s10162-023-00887-1
21. Lopez-Escamez JA, Carey J, Chung W-H, et al. Diagnostic criteria for Menière’s disease. J Vestib Res. 2015;25(1):1–7. doi:10.3233/ves-150549
22. Wisniewski JR, Zougman A, Nagaraj N, et al. Universal sample preparation method for proteome analysis. Nat Methods. 2009;6(5):359–362. doi:10.1038/nmeth.1322
23. Schroder A, Rohrbeck A, Just I, Pich A. Proteome alterations of hippocampal cells caused by clostridium botulinum C3 exoenzyme. J Proteome Res. 2015;14(11):4721–4733. doi:10.1021/acs.jproteome.5b00591
24. Zeiser J, Gerhard R, Just I, Pich A. Substrate specificity of clostridial glucosylating toxins and their function on colonocytes analyzed by proteomics techniques. J Proteome Res. 2013;12(4):1604–1618. doi:10.1021/pr300973q
25. Cox J, Hein MY, Luber CA, Paron I, Nagaraj N, Mann M. Accurate proteome-wide label-free quantification by delayed normalization and maximal peptide ratio extraction, termed MaxLFQ. Mol Cell Proteomics. 2014;13(9):2513–2526. doi:10.1074/mcp.M113.031591
26. Cox J, Mann M. MaxQuant enables high peptide identification rates, individualized p.p.b.-range mass accuracies and proteome-wide protein quantification. Nat Biotechnol. 2008;26(12):1367–1372. doi:10.1038/nbt.1511
27. Consortium U. UniProt: a hub for protein information. Nucleic Acids Res. 2015;43(D1):D204–12.
28. Wang Q, Hu JJ, Li W, et al. MD patients with distinct sac pathoanatomic findings react differently to endolymphatic duct blockage. Laryngoscope. 2023;133(10):2761–2769. doi:10.1002/lary.30520
29. Tomiyama S, Harris JP. The endolymphatic sac: its importance in inner ear immune responses. Laryngoscope. 1986;96(685):91. doi:10.1288/00005537-198606000-00018
30. Møller MN, Kirkeby S, Vikeså J, Nielsen FC, Cayé-Thomasen P. Gene expression demonstrates an immunological capacity of the human endolymphatic sac. Laryngoscope. 2015;125(8):E269–75. doi:10.1002/lary.25242
31. Satoh H, Firestein GS, Billings PB, Harris JP, Keithley EM. Proinflammatory cytokine expression in the endolymphatic sac during inner ear inflammation. JARO. 2003;04:139–147. doi:10.1007/s10162-002-3025-7
32. Frejo L, Martin-Sanz E, Teggi R, et al. Extended phenotype and clinical subgroups in unilateral Meniere disease: a cross-sectional study with cluster analysis. Clin Otolaryngol. 2017;42(6):1172–1180. doi:10.1111/coa.12844
33. Frejo L, Gallego-Martinez A, Requena T, et al. Proinflammatory cytokines and response to molds in mononuclear cells of patients with Meniere disease. Sci Rep. 2018;8(1):5974. doi:10.1038/s41598-018-23911-4
34. Flook M, Escalera-balsera A, Gallego-martinez A, et al. DNA methylation signature in mononuclear cells and proinflammatory cytokines may define molecular subtypes in sporadic Meniere Disease. Biomedicines. 2021;9(11):1530. doi:10.3390/biomedicines9111530
35. Liao Y, Xiao N, Wang X, Dai S, Wang G. Promoting effect of Tmsb4x on the differentiation of peripheral blood mononuclear cells to dendritic cells during septicemia. Int Immunopharmacol. 2022;111:109002. PMID: 35932611. doi:10.1016/j.intimp.2022.109002
36. Merk M, Mitchell RA, Endres S, Bucala R. D-dopachrome tautomerase (D-DT or MIF-2): doubling the MIF cytokine family. Cytokine. 2012;59(1):10–17. doi:10.1016/j.cyto.2012.03.014
37. Marzeda AM, Midwood KS. Internal affairs: tenascin-C as a clinically relevant, endogenous driver of innate immunity. J Histochem Cytochem. 2018;66(4):289–304. doi:10.1369/0022155418757443
38. Gibson WPR. Meniere’s Disease. Adv Otorhinolaryngol. 2019;82:77–86. doi:10.1159/000490274
39. Chang TG, Yen TT, Wei CY, Hsiao TH, Chen IC. Impacts of ADH1B rs1229984 and ALDH2 rs671 polymorphisms on risks of alcohol-related disorder and cancer. Cancer Med. 2023;12(1):747–759. doi:10.1002/cam4.4920
40. Zhang H, Wang F, Xu H, et al. Differentially co-expressed genes in postmortem prefrontal cortex of individuals with alcohol use disorders: influence on alcohol metabolism-related pathways. Hum Genet. 2014;133(11):1383–1394. doi:10.1007/s00439-014-1473-x
41. Eckhard AH, Zhu M, O’Malley JT, et al. Inner ear pathologies impair sodium-regulated ion transport in Meniere’s disease. Acta Neuropathol. 2019;137:343–357. doi:10.1007/s00401-018-1927-7
42. Chen CH, Ferreira JCB, Mochly-Rosen D. ALDH2 and cardiovascular disease. Adv Exp Med Biol. 2019;1193:53–67.
43. Ueno M, Yoshino Y, Mori H, et al. Association study and meta-analysis of polymorphisms and blood mRNA expression of the ALDH2 gene in patients with Alzheimer’s Disease. J Alzheimers Dis. 2022;87(2):863–871. doi:10.3233/JAD-215627
44. Knoppa RC, Leea SH, Hollas M, et al. Interaction of oxidative stress and neurotrauma in ALDH2−/− mice causes significant and persistent behavioral and pro-inflammatory effects in a tractable model of mild traumatic brain injury. Redox Biol. 2020;32:101486. doi:10.1016/j.redox.2020.101486
45. Calabrese V, Cornelius C, Maiolino L, et al. oxidative stress, redox homeostasis and cellular stress response in Me´nie`re’s disease: role of vitagenes. Neurochem Res. 2010;35:2208–2217. doi:10.1007/s11064-010-0304-2
46. Watanabe K, Tomiyama S, Jinnouchi K, et al. Expression of inducible nitric oxide synthase (iNOS/NOS II) in the hydropic vestibule after injection of keyhole limpet hemocyanin into the endolymphatic sac of guinea pigs. J Vestib Res. 2001;11(2):67–71. doi:10.3233/VES-2001-11201
47. Ishiyama G, Wester J, Lopez IA, et al. Oxidative stress in the blood labyrinthine barrier in the macula utricle of meniere’s disease patients. Front Physiol. 2018;9:1068. doi:10.3389/fphys.2018.01068
48. Ishiyama G, Lopez IA, Acuna D, Ishiyama A. Investigations of the microvasculature of the human macula utricle in Meniere’s Disease. Front Cell Neurosci. 2019;13:445. doi:10.3389/fncel.2019.00445
49. Johnson RB, Ruffell B. CD44 and its role in inflammation and inflammatory diseases. Inflamm Allergy Drug Targets. 2009;8(3):208–220. doi:10.2174/187152809788680994
50. Müller S, Sindikubwabo F, Cañeque T, et al. CD44 regulates epigenetic plasticity by mediating iron endocytosis. Nat Chem. 2020;12(10):929–938. doi:10.1038/s41557-020-0513-5
51. Friberg U, Erwall C, Bagger-sjöbäck D, Rask-Andersen H. Hyaluronan content in human inner ear fluids. Acta Oto-Laryngologica. 1989;108(1–2):62–67. doi:10.3109/00016488909107393
52. Hultcrantz M, Bagger-Sjöbäck D, Barbara M. Presence of glycosaminoglycans in the endolymphatic sac. Acta Oto-Laryngologica. 1997;117(4):518–522. doi:10.3109/00016489709113431
53. Hassn Mesrati M, Syafruddin SE, Mohtar MA, Syahir A. CD44: a multifunctional mediator of cancer progression. Biomolecules. 2021;11(12):1850. doi:10.3390/biom11121850
54. Knudson W, Chow G, Knudson CB. CD44-mediated uptake and degradation of hyaluronan. Matrix Biol. 2002;21(1):15–23. doi:10.1016/s0945-053x(01)00186-x
55. Yusupov M, Privat-Maldonado A, Cordeiro RM, et al. Oxidative damage to hyaluronan-CD44 interactions as an underlying mechanism of action of oxidative stress-inducing cancer therapy. Redox Biol. 2021;43:101968. doi:10.1016/j.redox.2021.101968
56. Friis M, Thomsen AR, Poulsen SS, Qvortrup K. Experimental hyperactivity of the endolymphatic sac. Audiol Neurootol. 2013;18(2):125–133. doi:10.1159/000345977
57. Inamoto R, Miyashita T, Akiyama K, Mori T, Mori N. Endolymphatic sac is involved in the regulation of hydrostatic pressure of cochlear endolymph. Am J Physiol Regul Integr Comp Physiol. 2009;297:R1610–4. doi:10.1152/ajpregu.00073.2009
 © 2024 The Author(s). This work is published and licensed by Dove Medical Press Limited. The
full terms of this license are available at https://www.dovepress.com/terms.php
and incorporate the Creative Commons Attribution
- Non Commercial (unported, 3.0) License.
By accessing the work you hereby accept the Terms. Non-commercial uses of the work are permitted
without any further permission from Dove Medical Press Limited, provided the work is properly
attributed. For permission for commercial use of this work, please see paragraphs 4.2 and 5 of our Terms.
© 2024 The Author(s). This work is published and licensed by Dove Medical Press Limited. The
full terms of this license are available at https://www.dovepress.com/terms.php
and incorporate the Creative Commons Attribution
- Non Commercial (unported, 3.0) License.
By accessing the work you hereby accept the Terms. Non-commercial uses of the work are permitted
without any further permission from Dove Medical Press Limited, provided the work is properly
attributed. For permission for commercial use of this work, please see paragraphs 4.2 and 5 of our Terms.