")
Back to Journals » Clinical Ophthalmology » Volume 19
Comparison of Biometric Measurements and IOL Power Calculation Between a Swept-Source OCT and an Optical Low-Coherence Reflectometry Biometer
Authors Romero D , Monera CE, Cooke D , Alio JL, Tarazona C, Martínez-Toldos JJ
Received 16 January 2025
Accepted for publication 10 April 2025
Published 26 June 2025 Volume 2025:19 Pages 2021—2028
DOI https://doi.org/10.2147/OPTH.S515167
Checked for plagiarism Yes
Review by Single anonymous peer review
Peer reviewer comments 2
Editor who approved publication: Dr Scott Fraser
Daniel Romero,1 Carlos E Monera,1 David Cooke,2 Jorge L Alio,3 Claudia Tarazona,1 Jose Juan Martínez-Toldos1
1Department of Ophthalmology, General University Hospital of Elche, Elche Foundation for the Promotion of Health and Biomedical Research in the Valencian Region (FISABIO), Valencia, Spain; 2Great Lakes Eye Care, St. Joseph, MI, USA; 3VISSUM Ophthalmological Institute of Alicante, Alicante, Spain
Correspondence: Daniel Romero, Department of Ophthalmology, General University Hospital of Elche, Carrer de la Almazara 11, Elche, Alicante, CP 03203, Spain, Email [email protected]
Purpose: To evaluate the comparability of biometric measurements obtained using the swept-source optical coherence tomography (SS-OCT) biometer (Anterion) and the optical low-coherence reflectometry (OLCR) biometer (Lenstar LS900).
Methods: This observational study included 150 cataract patients undergoing preoperative biometry at the General University Hospital of Elche. Measurements from the Anterion and Lenstar LS900 were compared for axial length (AL), mean keratometry (Km), anterior chamber depth (ACD), lens thickness (LT), and central corneal thickness (CCT). Bland-Altman plots and statistical analyses were conducted to assess differences and correlations.
Results: The mean AL measurements showed no significant difference between the two devices (mean difference − 0.004 ± 0.053 mm, P = 0.420). ACD and LT measurements displayed statistically significant differences, with Anterion showing greater mean values (ACD difference: 0.054 ± 0.037 mm, P < 0.001; LT difference: 0.107 ± 0.079 mm, P < 0.001). Mean keratometry was significantly flatter by 0.074 ± 0.259D (P = 0.001) in Anterion compared to Lenstar, primarily due to differences in steep keratometry. No correlation was found between keratometry differences and corneal asphericity. Estimated intraocular lens (IOL) power for emmetropia was significantly higher using Anterion by 0.146 ± 0.398D (P < 0.001), necessitating an A-constant adjustment of approximately 0.16 to equal mean IOL power in both devices.
Conclusion: a good correlation was found between both biometers. However, due to the differences found between biometric measurements between devices, these two biometers should not be considered interchangeable and clinicians should adjust IOL constants accordingly. Future studies will be necessary to determine whether one biometer is superior to the other in terms of refractive outcome predictability.
Keywords: biometry, swept-source optical coherence tomography, optical low-coherence reflectometry, anterion, Lenstar LS900, IOL power calculation, cataract surgery
Introduction
Achieving accurate ocular biometry is crucial for intraocular lens (IOL) power calculation.1,2 Classically IOL power calculation was based on ultrasound biometry and the measurement of two parameters: axial length (AL) and mean keratometry (Km). With the appearance of partial coherence interferometry (PCI) and optical low-coherence interferometry (OLCR) the AL measurement improved significantly, resulting in an improvement in the IOL power calculation accuracy.3–5
Recently swept-source optical coherence tomography (SS-OCT) has become available. SS-OCT uses a tunable laser that rapidly sweeps wavelengths to capture high-resolution cross-sectional images of ocular structures, allowing for deeper tissue penetration and faster acquisition, which allow for axial length measurements in eyes with dense cataracts.6 In contrast, OLCR uses a broadband light source to measure the time delay of reflected light through interference patterns, providing highly accurate axial length measurements but without generating detailed anatomical images. Several optical biometers based on SS-OCT technology including the IOLMaster 700 (Carl Zeiss, Jena, Germany), OA-2000 (Tomey, Nagoya, Japan) andArgos (Movu, Komaki, Japan) are now commercially available for ocular biometry.
The Anterion (Heidelberg Engineering Inc., Heidelberg, Germany) is an SS-OCT biometer that allows simultaneous topography and biometry, which can improve image acquisition in irregular corneas, and has proven to have good repeatability in prior research7,8 studies showed a good agreement between Anterion and an OLCR based biometer, the Lenstar LS-900 (Lenstar, Haag-Streit, Köniz, Switzerland) in terms of AL. However, flatter keratometries were obtained with Anterior when compared with Lenstar LS900 compromising the interchangeability of the parameters measured by both biometers.8–10 The aim of this study is to evaluate the comparability of Anterion biometry with the Lenstar LS900.
Materials and Methods
This cross-sectional prospective observational study included patients with a diagnosis of cataract who were scheduled for preoperative examination at the General University Hospital of Elche (Alicante, Spain) between January 2023 and May 2023. Eyes with a history of ocular surgery, trauma, corneal or ocular surface disease, or those belonging to contact lens wearers were excluded from the study. Only one eye per patient was included: the right eye was selected unless it met the exclusion criteria, in which case the left eye was included. This study adhered to the principles of the Declaration of Helsinki and was approved by the ethics committee of our institution (PI 7/2020). Patients provided informed consent to participate in the study.
Biometry Devices
Biometer A was the Anterion (Heidelberg Engineering Inc., Heidelberg, Germany), an SS-OCT biometer with a laser wavelength of 1300 nm, axial resolution of less than 10 µm, and lateral resolution of less than 35 µm. Keratometric values are obtained by means of a 65-radial scan in a 3-mm zone.
Biometer B was the Lenstar LS900 (Haag-Streit AG), an OLCR device that uses an 820 nm superluminiscent diode to measure axial length with a resolution of 10 µm. Corneal measurements use 32 points placed at two concentric rings of 16 points, placed at 1.65-mm and 2.30-mm optical zones.
Patients underwent biometry under consistent conditions. Both biometers were placed in the same room, and ocular measurements were obtained by the same examiner on the same day under the same lighting conditions.
Statistical Analysis
A Microsoft Excel datasheet was used for data management. Statistical analysis was performed using SPSS (IBM Statistics, v21) Corneal astigmatism was analysed using vectorial analysis as described by Thibos et al.11
Estimated IOL power for emmetropia was calculated by means of the online version of the Barrett Universal-II formula using axial length, anterior chamber depth and mean keratometry as biometric variables. The IOL power for emmetropia was calculated by interpolation of the two IOL power options closest to emmetropia listed on the calculator website. A comparison was performed between the IOL power calculated using the data form the different devices. An A-constant of 119.1 was employed for IOL power calculation. Finally, A-constant correction to equal mean IOL power of the other device was calculated with the method recently described by Gatinel et al.12
Prior to the analysis, outliers were identified and removed using the interquartile range (IQR) method. The data points which fall below first quartile – 1.5 x IQR or above third quartile + 1.5 IQR of the difference between biometers for that variables were identified as outliers and removed from the analysis. Kolmogorov–Smirnov test was used to test for normal distribution. Descriptive analysis was performed using mean and standard deviation (SD). Comparison between both biometers included mean absolute difference, mean arithmetic difference and Bland-Altman plots including 95% limits of agreement (LoA). In case of paired samples, t-test for paired samples was employed for mean comparison between normally distributed data and Wilcoxon signed-rank test for not normally distributed data. A P-value less than 0.05 was considered statistically significant.
Considering the impact of keratometry on intraocular lens power calculations and the different measurement diameters used by both devices, if significant differences are found between the biometers in corneal measurements, we will explore whether there is a relationship between the measurement differences and corneal asphericity measured by Anterion. Corneal asphericity can affect the accuracy of keratometry measurements, as a more aspherical cornea may lead to variations in curvature that could influence the calculation of intraocular lens power. A correlation analysis will be conducted using Pearson or Spearman correlation coefficients, depending on the normality of the data, to assess the strength and direction of the association between the differences in measurements and corneal asphericity.
Results
In total, 150 eyes of 150 patients were included in the study (76 were man (50.66%)) with a mean age of 74.13 ± 6.76 years. Table 1 presents the outcomes of comparing the biometrical measurements acquired from the two biometers.
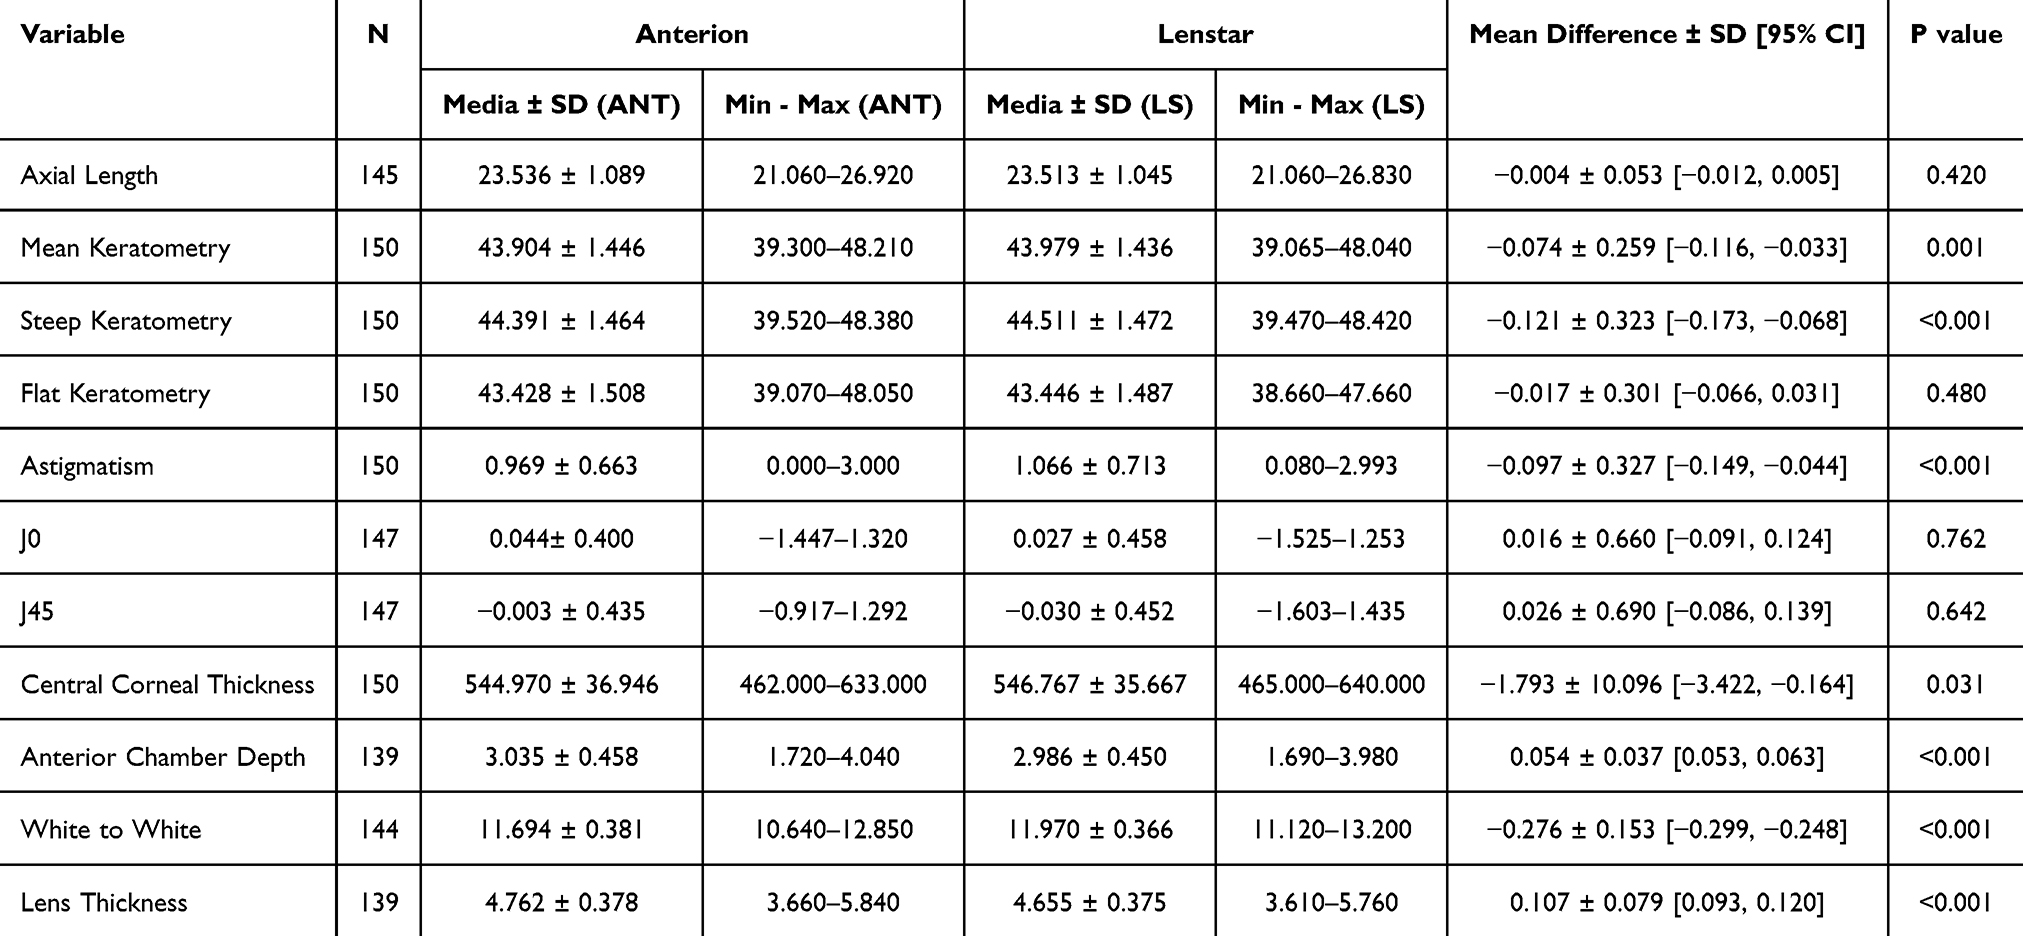 |
Table 1 Comparison of ocular biometric parameters obtained with the swept-source OCT biometer (Anterion) and the optical low-coherence reflectometry biometer (Lenstar) |
Keratometry
Mean keratometry for biometers A and B was 43.90 ± 1.45D (range 39.30–48.21D) and 43.98 ± 1.44D (range 39.07–48.04D), respectively. The mean arithmetic difference (Mean Biometer A – Mean Biometer B) was −0.07 ± 0.26D (95% LoA −0.12 to −0.03D). The difference between devices in mean keratometry measurements was statistically significant (P = 0.001) (Figure 1). For the steep meridian, the mean value was 44.39 ± 1.46D (range 39.52–48.38D) for biometer A and 44.51 ± 1.47D (range 39.47–48.42D) for biometer B, resulting in a mean arithmetic difference of −0.12 ± 0.32D (P < 0.001) (95% LoA −0.17 to −0.07D) (Figure 2). For the flat meridian, the mean value was 43.43 ± 1.51D (range 39.07–48.05D) and 43.45 ± 1.49D (range 38.66–47.66D) for Anterion and Lenstar, respectively (mean difference = −0.02 ± 0.30D (95% LoA −0.07 to 0.03D; P = 0.480)) (Figure 3). No correlation was found between the differences in mean keratometry or steep keratometry and corneal asphericity (correlation coefficients of 0.23 and 0.13; P = 0.23 and 0.87, respectively) (Supplementary material).
 |
Figure 1 Bland-Altman plot for evaluation of average keratometry (Biometer A Anterion, Biometer B = Lenstar LS900). Difference is measured in dioptres. The upper and lower lines are 95% limits of agreement. |
 |
Figure 2 Bland-Altman plot for evaluation of steep keratometry (Biometer A = Anterion, Biometer B = Lenstar LS900). Difference is measured in dioptres. The upper and lower lines are 95% limits of agreement. |
 |
Figure 3 Bland-Altman plot for evaluation of flat keratometry (Biometer A = Anterion, Biometer B = Lenstar LS900). Difference is measured in dioptres. The upper and lower lines are 95% limits of agreement. |
Vectorial Analysis
No statistically significant difference was found between J0 and J45 measured by both devices. The mean J0 for the SS-OCT biometer was 0.04 ± 0.40D, whereas for the OLCR biometer it was 0.03 ± 0.46D, resulting in a mean difference of 0.02 ± 0.66D (95% LoA −0.09 to 0.12D; P = 0.762). The mean J45 for biometer A was −0.00 ± 0.44D, while for biometer B it was −0.03 ± 0.45D, with a mean difference of 0.03 ± 0.69D (95% LoA −0.09 to 0.14D; P = 0.642).
Central Corneal Thickness
The mean CCT was 544.97 ± 36.95 µm (range 462–633 µm) for Anterion and 546.77 ± 35.67 µm (range 465–640 µm) for Lenstar. The mean difference was −1.79 ± 10.10 µm (95% LoA −3.42 to −0.16 µm), which was statistically significant (P = 0.031).
Anterior Chamber Depth and Lens Thickness
The mean ACD was 3.04 ± 0.46 mm (range 1.72–4.04 mm) for Anterion and 2.99 ± 0.45 mm (range 1.69–3.98 mm) for Lenstar. A statistically significant difference was found between the values of ACD measured by the biometers (P < 0.001) with a mean arithmetic difference between biometers for ACD of 0.05 ± 0.04 mm (95% LoA 0.05 to 0.06 mm) (Figure 4).
 |
Figure 4 Bland-Altman plot for evaluation of flat Anterior Chamber Depth in mm (Biometer A = Anterion, Biometer B = Lenstar LS900). Difference is measured in mm. The upper and lower lines are 95% limits of agreement. |
The mean LT was 4.76 ± 0.38 mm (range 3.66–5.84 mm) for the SS-OCT biometer and 4.66 ± 0.38 mm (range 3.61–5.76 mm) for the OLCR biometer. A statistically significant difference was found between the values of LT measured by the biometers (P < 0.001) with a mean arithmetic difference between biometers for LT of 0.11 ± 0.08 mm (95% LoA 0.09 to 0.12 mm). The Bland-Altman plot evaluating the LT measurements from both devices can be found in the Supplementary Materials.
Axial Length
The mean AL was 23.54 ± 1.09 mm (range 21.06–26.92 mm) for Anterion and 23.51 ± 1.05 mm (range 21.06–26.83 mm) for Lenstar. No statistically significant difference was found between the values of AL measured by the biometers (P = 0.420) with a mean arithmetic difference between biometers for AL of −0.00 ± 0.05 mm (95% LoA −0.01 to 0.01 mm) (Figure 5).
 |
Figure 5 Bland-Altman plot for evaluation of flat Axial Length (Biometer A = Anterion, Biometer B = Lenstar LS900). Difference is measured in mm. The upper and lower lines are 95% limits of agreement. |
IOL Power Calculation
A significant difference between devices of 0.15 ± 0.40D [0.08, 0.21] (p <0.001) in the estimated IOL power for emmetropia was found. The mean IOL power calculated with Anterion biometry was 21.12 ± 3.51D whereas for Lenstar was 20.98 ± 3.47 D. For this cohort, with a base A constant of 119.1, an addition of 0.169 (Updated A constant = 119.269) was required to equal the mean IOL power calculated for emmetropia between the two biometers.
Discussion
Various biometers available on the market employ diverse measurement technologies, many of which have been compared in recent studies. This study was delved to examine the difference in biometrical measurements provided by two biometers with two different technologies: SS-OCT (Anterion) and OLCR (Lenstar LS900). Previous studies focused on the repeatability of these two devices showing in general good repeatability of measurements.7–9,13
To the best of our knowledge, this is the largest study ever conducted analyzing the comparability of these two devices. We found no significant difference in axial length measurements between the two biometers. In our study, we found a statistically significant difference in anterior chamber depth (0.036 ± 0.113 mm [95% LoA 0.017–0.054 mm]; P < 0.001) and lens thickness (0.141 ± 0.198 mm [95% LoA 0.109–0.173 mm]; P < 0.001) measurements between the two biometers. Similarly, the study conducted by Fisus found that lens thickness was significantly larger when measured with Anterion compared to Lenstar (0.190 ± 0.435 mm).8 However, in the aforementioned study, ACD was found to be significantly shorter with Anterion compared to Lenstar (0.115 ± 0.399 mm).8 Cheng et al conducted a study comparing four different biometers, including Anterion and Lenstar. In that study no significant difference was found between ACD measurements between these two devices. Cooke et al found that in some patients, the Lenstar software misinterprets the OLCR spike used to identify the anterior and posterior capsular bag. By using a custom-made software called Spikefinder, Lenstar’s anterior chamber and lens thickness measurements could be enhanced.14 These findings could partially explain the differences in ACD and LT observed in our study.
Mean keratometry was significantly flatter by 0.074 ± 0.259D (95% LoA −0.116 to −0.033D) in Anterion compared with Lenstar. This difference was primarily attributed to the steep keratometry, which was 0.121 ± 0.323D (P < 0.001) less steep in Anterion, while no significant differences were found in the flat keratometry (−0.017 ± 0.301D, P = 0.480). Cheng et al performed a comparison in steep and flat keratometry measured with Anterion and Lenstar. Although keratometric measurements tend to be less powerful with Anterion, there was no significant statistical difference between devices in corneal measurements.10 Fisus et al found a statistically significant mean difference of −0.150D in mean keratometry measurements obtained with Anterion compared to Lenstar.8
Given the impact that variations in keratometry can have on the accuracy of lens calculations, we aimed to analyze whether there was a correlation between the observed differences and corneal asphericity measured with Anterion. Corneal asphericity is a measure that describes the curvature of the cornea, specifically how that curvature changes from the center to the periphery. We considered analyzing this variable to be relevant since Lenstar uses reflective keratometry at 1.65 mm and 2.30 mm optical zones, while Anterion obtains keratometric values through a 65-radial scan in a 3-mm zone. Therefore, theoretically, higher corneal asphericities could induce greater differences between devices. However, we found no correlation between corneal asphericity and the differences in keratometry measurements between the devices. Thus, at least in normal corneas, corneal asphericity does not account for the discrepancies in keratometric readings provided by both biometers.
IOL power calculation has already been compared between both devices.9 In a previous cross-sectional study conducted by Shetty et al it was found that the mean IOL power for emmetropia calculated with Barrett Universal-II was 21.95D for Lenstar and 21.64D for Anterion. This results contrast with the results of our paper. We found that the IOL power calculated with Lenstar was 0.146 ± 0.398D [0.078, 0.213] (p < 0.001) lower than that calculated with Anterion. The fact that Shetty et al found that the mean IOL power for emmetropia was 0.31D lower for Anterion while it is described that Anterion obtained comparable axial length, lower mean keratometry by 0.26D and a larger mean ACD by 0.03 mm calls into question the consistency of these results.
In our paper, to equalize the mean IOL power for emmetropia between both biometers, the A-constant would need to be adjusted by approximately 0.16 for the sample in this study using the Barrett Universal II formula. Aristodemou et al found that the percentage of eyes within half a diopter of PE did not drop drastically with a difference of 0.16 in A-constant, making it possible to use non-optimized constants from one device to the other without a significant decrease in lens calculation accuracy. However, these results were obtained using third-generation formulas, where a higher standard deviation in predictive error might make them more tolerant of small errors in the lens constant. The effect of such small differences on the latest generation IOL power calculation formulas remains to be demonstrated. Therefore, although this difference have little effect on the final refractive outcome, to achieve the best possible outcomes, the constants should be optimized by lens model and biometer to maximize results. In this regard, IOLCon provides the option to search for optimized constants filtered by the lens and the biometer used for measurements. Future studies will be necessary to determine whether one biometer is superior to the other in terms of refractive outcome predictability.
In conclusion, this study demonstrates significant differences between SS-OCT (Anterion) and OLCR (Lenstar) in ACD, LT and keratometry measurements, particularly in steep keratometry. No significant differences were found in AL indicating acceptable comparability in this parameter. Although differences in mean IOL power calculated for emmetropia were observed, their clinical impact appears minimal, especially if properly adjusting the A-constant. Future studies are needed to determine whether one device offers superior refractive outcome predictability.
Funding
The authors did not receive financial support from private sources.
Disclosure
Dr Daniel Romero is a part of the speaker fees from Heidelberg Engineering. Dr David Cooke reports speaker fees from Heidelberg Engineering, licensing fees from Moptim, outside the submitted work. The authors report no other conflicts of interest in this work.
References
1. Norrby S. Sources of error in intraocular lens power calculation. J Cataract Refract Surg. 2008;34(3):368–376. doi:10.1016/j.jcrs.2007.10.031
2. Romero Valero D, Escolano Serrano J, Monera Lucas CE, Castilla Martínez G, Martínez Toldos JJ. Limits of the precision in refractive results after cataract surgery. Arch Soc Esp Oftalmol. 2022;97(7):370–375. doi:10.1016/j.oftal.2021.11.002
3. Cooke DL, Cooke TL. Comparison of 9 intraocular lens power calculation formulas. J Cataract Refract Surg. 2016;42(8):1157–1164. doi:10.1016/j.jcrs.2016.06.029
4. Melles RB, Holladay JT, Chang WJ. Accuracy of intraocular lens calculation formulas. Ophthalmology. 2018;125(2):169–178. doi:10.1016/j.ophtha.2017.08.027
5. Rajan MS, Keilhorn I, Bell JA. Partial coherence laser interferometry vs conventional ultrasound biometry in intraocular lens power calculations. Eye. 2002;16(5):552–556. doi:10.1038/sj.eye.6700157
6. Tañá-Rivero P, Aguilar-Córcoles S, Tañá-Sanz P, Tañá-Sanz S, Montés-Micó R. Axial length acquisition success rates and agreement of four optical biometers and one ultrasound biometer in eyes with dense cataracts. Eye Vision. 2023;10(1). doi:10.1186/s40662-023-00352-3
7. Monera Lucas CE, Escolano Serrano J, Tarazona Jaimes C, Romero Valero D, Moya Martínez A, Martínez Toldos JJ. Repeatability and comparability of a new swept-source optical coherence tomographer in optical biometry. Arch Soc Esp Oftalmol. 2022. doi:10.1016/j.oftal.2022.04.007
8. Fişuş AD, Hirnschall ND, Ruiss M, Pilwachs C, Georgiev S, Findl O. Repeatability of 2 swept-source OCT biometers and 1 optical low-coherence reflectometry biometer. J Cataract Refract Surg. 2021;47(10):1302–1307. doi:10.1097/j.jcrs.0000000000000633
9. Shetty N, Kaweri L, Koshy A, Shetty R, Nuijts RMMA, Sinha Roy A. Repeatability of biometry measured by three devices and its impact on predicted intraocular lens power. J Cataract Refract Surg. 2021;47(5):585–592. doi:10.1097/j.jcrs.0000000000000494
10. Cheng SM, Zhang JS, Shao X, et al. Repeatability of a new swept-source optical coherence tomographer and agreement with other three optical biometers. Graefes Arch Clin Exp Ophthalmol. 2022;260(7):2271–2281. doi:10.1007/s00417-022-05579-9
11. Thibos L. Power vectors: an application of Fourier analysis to the description and statistical analysis of refractive error. Optometry Vision Sci. 1997;74(6):367–375. doi:10.1097/00006324-199706000-00019
12. Gatinel D, Debellemanière G, Saad A, et al. A simplified method to minimize systematic bias of single-optimized intraocular lens power calculation formulas. Am J Ophthalmol. 2023;253:65–73. doi:10.1016/j.ajo.2023.05.005
13. Ruíz-Mesa R, Aguilar-Córcoles S, Montés-Micó R, Tañá-Rivero P. Ocular biometric repeatability using a new high-resolution swept-source optical coherence tomographer. Expert Rev Med Devices. 2020;17(6):591–597. doi:10.1080/17434440.2020.1772050
14. GitHub - timothylcooke/SpikeFinder: an open-source application that shows raw data from optical biometers. Available from: https://github.com/timothylcooke/SpikeFinder.
 © 2025 The Author(s). This work is published and licensed by Dove Medical Press Limited. The
full terms of this license are available at https://www.dovepress.com/terms.php
and incorporate the Creative Commons Attribution
- Non Commercial (unported, 4.0) License.
By accessing the work you hereby accept the Terms. Non-commercial uses of the work are permitted
without any further permission from Dove Medical Press Limited, provided the work is properly
attributed. For permission for commercial use of this work, please see paragraphs 4.2 and 5 of our Terms.
© 2025 The Author(s). This work is published and licensed by Dove Medical Press Limited. The
full terms of this license are available at https://www.dovepress.com/terms.php
and incorporate the Creative Commons Attribution
- Non Commercial (unported, 4.0) License.
By accessing the work you hereby accept the Terms. Non-commercial uses of the work are permitted
without any further permission from Dove Medical Press Limited, provided the work is properly
attributed. For permission for commercial use of this work, please see paragraphs 4.2 and 5 of our Terms.