")
Back to Journals » Clinical Ophthalmology » Volume 19
Comparison of Online Visual Acuity Testing with Dynamic Dyop and Static LogMAR Optotypes in Healthy Non-Presbyopic and Presbyopic Individuals
Authors Ifrah R , Paritzky D
Received 29 January 2025
Accepted for publication 7 April 2025
Published 13 April 2025 Volume 2025:19 Pages 1289—1297
DOI https://doi.org/10.2147/OPTH.S519947
Checked for plagiarism Yes
Review by Single anonymous peer review
Peer reviewer comments 2
Editor who approved publication: Dr Scott Fraser
Reut Ifrah, Dinah Paritzky
Department of Optometry, Jerusalem Multidisciplinary College, Jerusalem, Israel
Correspondence: Reut Ifrah, Department of Optometry, Jerusalem Multidisciplinary College, 37 haneviim St, Jerusalem, 9101001, Israel, Email [email protected]
Introduction: Visual acuity (VA) is typically measured using stationary optotypes, though real-world visual experiences involve dynamic targets. The Dyop (dynamic optotype) VA test is a computerized motion perception assessment designed to simulate daily visual experiences. With the rise of telemedicine, this study examined the feasibility and agreement between virtual online VA testing using Dyop compared to standard LogMAR optotypes in non-presbyopic and presbyopic participants.
Methods: After an initial online Zoom® meeting verifying inclusion criteria and technical feasibility, participants accessed the examiner’s computer using the “Anydesk” application enabling them to view the “Chart 2020” program. Monocular right eye VA was measured three consecutive times using Dyop and LogMAR optotypes in a counter-balanced design. Participants aged 18– 39 yrs were considered non-presbyopic, and those 40– 60 yrs were considered presbyopic. VA measurements were analyzed using the Mann–Whitney U-test, Spearman correlation coefficients, intraclass correlation coefficients (ICC), and non-parametric Bland-Altman analysis, which examined median differences and limits of agreement (LoA).
Results: Of the 110 participants, (70% females, mean age: 32.5 ± 13.0, range: 18– 60), 73 (66%) were considered non-presbyopic (mean age: 24.1 ± 4.9, range: 18– 39), and 37 (34%) were presbyopic (mean age: 49.0 ± 6.4, range: 40– 60). The mean VA measured with the Dyop and LogMAR charts for the entire cohort (0.09 and 0.08), for the non-presbyopic (0.09 and 0.07) and the presbyopic (0.10 and 0.09) sub-groups was significantly positively correlated (r = 0.80, p < 0.001, r = 0.82, p < 0.001 and r = 0.72, p < 0.001, respectively), with a small mean difference (− 0.01 ± 0.08, − 0.02 ± 0.08, − 0.01 ± 0.09 log units), for the entire cohort, the non-presbyopic, and the presbyopic, respectively. There were no significant differences between the two tests for the whole cohort (p = 0.80), for group 1 (p = 0.98) and for group 2 (p = 0.62).
Conclusion: This study demonstrated the feasibility of online VA measurements and that online VA measurements using Dyop and LogMAR optotypes are interchangeable in healthy non-presbyopic and presbyopic participants.
Keywords: dynamic visual acuity, Dyop, LogMAR, visual acuity, online vision testing, online visual acuity, teleoptometry
Introduction
The visual world includes both static and dynamic elements, and the visual system has evolved to respond to a diverse range of stimuli.1 The most commonly used measure of visual function is visual acuity (VA), which refers to the eye’s ability to distinguish fine detail in an image.2 Clinically, VA is typically assessed using charts with static optotypes, including letters, numbers, Tumbling E, and Landolt C.1,3,4 The LogMAR (logarithm of the minimum angle of resolution) acuity chart is a static measure of VA that provides the benefit of standardizing letter sizes on each line and ensuring a consistent geometric progression of optotype sizes between lines.5,6 It is widely considered accurate and reliable.6
While basic static acuity measurements can identify many visual disorders, VA is, in fact, a dynamic process rather than a static process.7 The dynamic optotype (Dyop, Shemesh Health Solutions, Johannesburg, South Africa, https://chart2020.com/) is a novel method of measuring dynamic VA.8 It uses a rotating and segmented visual stimulus, consisting of eight black and eight white alternating segments of equal size on a neutral grey background,7 that rotates at constant velocity.9 The image diameter is adjusted by the angular arc width and calibrated with the viewing distance to determine the acuity threshold.4 The measurement begins by presenting large spinning Dyop targets to the subject. Observers are asked to identify which of the two Dyops is spinning and determine the direction of rotation (clockwise or counter-clockwise).3 The target diameter is progressively reduced until the subject can no longer detect the direction of motion.9 The acuity endpoint is defined by the smallest stimulus area where the subject can perceive the motion of the Dyop segments.3 As such, Dyop provides an alternative method for measuring VA that is not influenced by culture, literacy, or language.4
Static VA is believed to remain almost constant until around the age of 40, after which it gradually declines.10 However, dynamic VA remains stable until the age of 50, after which it begins to decline.11
Previous studies have demonstrated a significant correlation between VA assessed with the Dyop target and traditional measurements obtained using Sloan9 and Tumbling E optotypes12 in adults, as well as Lea symbols in children.8 However, a recent study examining the validity, inter- and intra-session repeatability of the Dyop versus static optotypes (letter, Landolt C, and Tumbling E charts) found that the Dyop and letter charts differed significantly in their mean values with wide limits of agreement.3
Telemedicine refers to the use of telecommunications technology to deliver medical services and information.13 In recent years, there has been a rise in the use of telemedicine for optometry services.14 Teleoptometry refers to delivering optometric care through telemedicine.14 This growth is driven by innovative approaches to eye care, supported by high-speed internet and ongoing advancements in software and equipment within the eye care field.14,15 This approach is of great importance for vulnerable populations, including those living in remote areas,16 individuals with disabilities, and the elderly.17 Wisse et al18 found a correlation between an online test (Easee Web-based VA test)19 and a clinical test (Early Treatment Diabetic Retinopathy Study VA chart) conducted by an optometrist for VA and refractive error, which may indicate that web-based eye testing is a valid method for measuring VA.
This study examined the feasibility and agreement of virtual online VA testing using Dyop compared to standard LogMAR optotypes in healthy non-presbyopic and presbyopic participants.
Methods
The study conformed to the ethical principles of the Declaration of Helsinki and was approved by the internal ethics committee of Jerusalem Multidisciplinary College, Israel (JMC, formerly Hadassah Academic College, approval number 85).
Subjects
Healthy volunteers between the ages of 18–60 years were recruited from ads posted on social media. Participants were divided into two sub-groups, participants between the ages of 18–39 yrs were considered non-presbyopic, and those ≥40 yrs were considered presbyopic.10 Participants with corrected VA worse than 6/60, ocular pathology that may affect visual acuity (eg, keratoconus and cataract), a systemic disease that may affect visual acuity (eg, multiple sclerosis), those taking medications with known ocular side effects, those who have had ocular surgery, those who have dry eyes, epilepsy or pregnant women (determined based on the health history question form) were not included in the study. Participants with vision problems such as: amblyopia, strabismus, ocular motor dysfunction and nystagmus were excluded from the study. Participants meeting these inclusion criteria were considered healthy individuals. Inclusion criteria included access to a desktop or laptop computer and an internet connection.
Procedures
All examinations were conducted online, with participants situated at home and connected via desktop or laptop computers.
The study included two online sessions using the Zoom® platform. During the first session, participants were given a detailed explanation of the study and were asked to sign an online statement of informed consent using a Google form. They also completed a questionnaire on ocular and general health, administered via Google Forms. During this session, the examiners confirmed technical feasibility of the study such as internet connection, ability to download the “Any desk” application (a remote desktop application, https://anydesk.com/en/downloads), the distance at which the participant sat from the display screen, and the display settings necessary to run the program (display lighting set to 100%, the display is set to a 90-degree angle, meaning it is vertical to the surface on which the computer is placed, and at the same height as the subject). In addition, each participant was asked to set the testing distance within the range of 1–3 meters and measure a line of known dimensions that was presented on the screen, in order to calibrate the optotype size. At the conclusion of the first session, the participant was fully prepared to undergo VA measurements using the Chart 2020 application via the “Any desk” program, and the subsequent session was scheduled.
Participants were asked to wear their habitual distance correction to the second session and to run Chart 2020 software via “Any desk” program. They were asked to cover their left eye, and their monocular right eye (only) VA was measured three consecutive times using the LogMAR and Dyop optotypes, in random order. Half of the participants were first measured using the LogMAR optotypes, while the other half were first measured using the Dyop optotypes. The standard LogMAR number-based chart VA measurement employed a traditional procedure, in which the participants were tasked with reading from the letter chart, and identifying the smallest discernable line.20,21 The Dyop VA was measured by displaying two Dyop optotypes, one stationary and one rotating at a constant speed of 40 rotations per minute (RPM).22 Participants were asked to detect the rotating optotype and describe the direction of the rotation (clockwise and counterclockwise). If the correct optotype and direction of rotation were detected, the optotypes were reduced in size. Acuity threshold was determined when participants were unable to detect the direction of motion.
Statistical Analysis
Using G-Power software (version 3.1.9.7; Heinrich-HeineUniversität Düsseldorf, psychologie.hhu.de/arbeitsgruppen/allgemeine-psychologie-und-arbeitspsychologie/gpower)23 the minimum sample size required when measuring VA by two different charts, for a power (1 − β) of 84%, error probability of 5% (α error 0.05) and an effect size (d) of 0.55, was 108 participants.
Demographic data were evaluated using descriptive statistics. The mean and standard deviation of the VA with the Dyop and LogMAR from the participants’ right eyes were calculated.
The normality of the outcome measures was assessed using the Kolmogorov–Smirnov test. Data were analyzed for the entire sample and for non-presbyopic and presbyopic subgroups separately. Differences between the subgroups were examined for significance using a Mann–Whitney U-test that was applied due to a data set that was not normally distributed.
The correlation between the mean of the VA measurements obtained with the Dyop and LogMAR was examined using the Spearman test. If data were significantly correlated, then they were assessed for interchangeability using non-parametric Bland-Altman plots.24 Test–retest (TRT) agreement was evaluated using intraclass correlation coefficients (ICC) and the 95% confidence intervals (CI) for the ICC. The non-parametric Bland-Altman analysis depicted the median difference and 2.5% and 97.5% quartiles, which constituted the limits of agreement.24 The median difference that represents the bias, should be close to zero in interchangeable methods.25
Differences were considered statistically significant when p < 0.05. Statistical analysis was performed with Microsoft Office Excel (microsoft.com) and IBM SPSS Statistics (version.27, ibm.com, SPSS Inc., Chicago, Ill, USA), and R version 3.5 (The R Foundation for Statistical Computing, Vienna, Austria).
Results
This study included 110 participants (110 right eyes), aged 18–60 years, with a mean age of 32.51 ± 13.00 years, whose demographic data is shown in Table 1. Seventy-three participants were considered non-presbyopic (aged 18–39), and thirty-seven participants were considered presbyopic (aged 40–60). Ten participants (9.1%) were defined as having a visual impairment (LogMAR >0.3),17 either with the LogMAR and/or Dyop optotypes. Five participants (4.5%) were defined as having a visual impairment based on their LogMAR optotype VA, and eight (7.3%) were defined as having visual impairment based on their Dyop optotype VA. The sensitivity and specificity for detecting visual impairment were 60% and 95%, respectively.
 |
Table 1 Demographic Data (Number of Participants, % Females, Mean Age± SD, Median Age [IQ1, IQ3], Age Range, Number and Percentage of Participants Who Wear Visual Correction) of All Participants and of the Non-Presbyopic and Presbyopic Groups |
The mean LogMAR and Dyop VA measurements are shown in Table 2. The mean LogMAR VA of all participants and of the non-presbyopic and presbyopic groups was 0.08 ± 0.09, 0.07 ± 0.09, and 0.09 ± 0.10, respectively, while the mean Dyop VA of all participants and of the non-presbyopic and presbyopic groups was 0.09 ± 0.12, 0.09 ± 0.12, and 0.10 ± 0.12, respectively (Table 2).
 |
Table 2 LogMAR and Dyop Visual Acuity Outcome Measures. The Means, Standard Deviations of the Mean, Median, First and Third Interquartiles, and Range (Minimum to Maximum) of Visual Acuity Measured by LogMAR and Dyop Charts |
Test–retest (TRT) agreement was evaluated using intraclass correlation coefficients (ICC) and the 95% confidence intervals (CI) for the ICC. For the three measurements performed using the LogMAR chart and the Dyop chart, the ICC and the 95% CI were 0.88 (95% CI: 0.84–0.91) and 0.90 (95% CI: 0.86–0.93), respectively, both p <0.001.
The mean and median differences, including the 1st and 3rd percentiles, correlations and Mann–Whitney U-tests comparing between the measurement methods are shown in Table 3. The VA measurements of the two optotypes were significantly positively correlated for the entire cohort, the non-presbyopic, and presbyopic sub-groups, respectively. The measurements of the two optotypes were also not significantly different for the entire cohort (Mann–Whitney U-test, p = 0.80), the non-presbyopic (Mann–Whitney U-test, p = 0.98), and presbyopic sub-groups (Mann–Whitney U-test, p = 0.62), respectively.
 |
Table 3 Mean Difference (with Standard Deviations of the Mean), Median Difference (with 1st and 3rd Percentiles) Between LogMAR and Dyop Visual Acuity Measurements, and the Results of the Mann–Whitney and Spearman Correlation Tests That Were Applied |
Non- parametric Bland-Altman analysis demonstrated interchangeability between the optotypes for the entire cohort and the sub-groups (Figure 1A–C). Two observations (2%) fell outside the confidence interval.
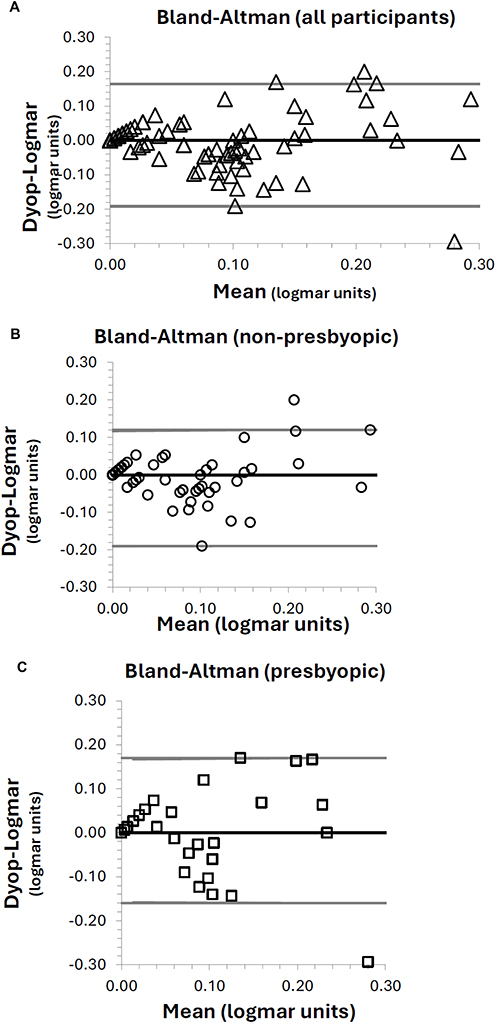 |
Figure 1 Non parametric Bland-Altman Plot of the difference between the Dyop and LogMAR VA measurements, for the entire cohort (A), for non-presbyopic (B), and presbyopic (C) sub-groups. The central line represents the median difference between the measurements, with the upper and lower gray lines representing the first (2.5%) and third (97.5%) quartiles. The median difference between LogMAR and Dyop optotyps was 0.00 for all sub-groups. The first and third percentiles ranged between a maximum to −0.19 to 0.17. Two observations (2%) fell outside this range. |
A scatter plot (Figure 2) illustrated the relationship between the two measurements, categorized by age groups: non-presbyopes (<40 years) and presbyopes (≥40 years). Both groups demonstrated a linear trend with increasing dispersion of data points (widening confidence intervals) for higher LogMAR values. The dispersion of data points increased as mean LogMAR values rose, as reflected by the widening confidence intervals. This pattern suggests heteroscedasticity of the data, indicating that the variance of residuals is not constant across the range of mean LogMAR, implying greater inconsistency between the methods in patients with reduced VA.
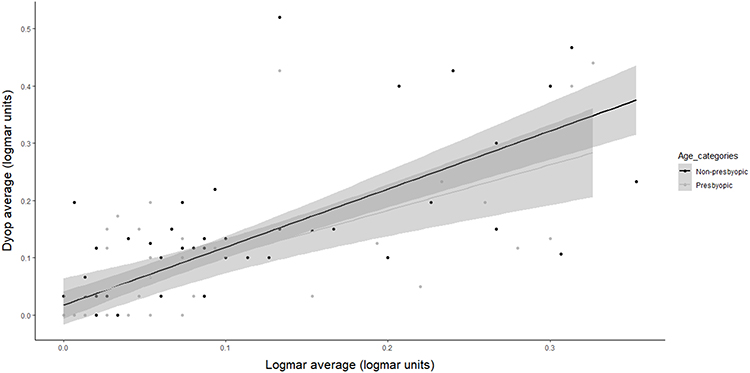 |
Figure 2 Heteroscedasticity in the relationship between Dyop and LogMAR Visual Acuity Measurements. The scatter plot illustrates the relationship between Dyop and LogMAR visual acuity measurements, stratified by age categories: non-presbyopes (<40) and presbyopes (≥40). A linear trend was observed in both groups, with black and gray dots representing individual participants in the non-presbyopic and presbyopic groups, respectively. The shaded gray surrounding each line indicates the confidence intervals, which are based on the standard error of the mean for the upper and lower reference lines. As mean LogMAR values increased (lower VA), the dispersion of data points widened, as reflected by the broadening confidence intervals. This pattern suggests the presence of heteroscedasticity, implying that the variance of residuals is not constant across the range of mean LogMAR values. |
Discussion
Visual impairment is a condition that affects eye function due to disease or disorder, making it challenging to perform daily tasks and significantly impacting one’s ability to function independently.26 The combination of population growth and longer life expectancy is expected to cause a rapid rise in the global prevalence of blindness, which could have significant socioeconomic impacts.27,28 Using effective screening methods to detect the at-risk population followed by a comprehensive eye examination would be an appropriate way to reduce preventable blindness.29 As such, an online VA measurement could serve as a valuable tool for identifying at-risk populations with refractive errors and sight-threatening eye conditions like diabetic retinopathy and macular degeneration.30
This study examined the agreement between Dyop and LogMAR VA measurements conducted online in non-presbyopic and presbyopic participants. The VA measurements with the two optotypes were found to be insignificantly different, highly correlated and interchangeable based on Bland- Altman analysis. The mean difference between the measurements of the two charts was 0.01, 0.02, and 0.01 LogMAR for the entire cohort, non-presbyopic, and presbyopic subgroups, respectively. Each optotype on LogMAR charts is equivalent to 0.02.31 Therefore, these mean differences correspond to approximately one optotype, which is not considered clinically meaningful. Based on the results of the present investigation in healthy non-presbyopic and presbyopic participants up to the age of 60, online LogMAR and Dyop VA measurements using the Chart 2020 application are interchangeable.
The present results are similar to those of a previous study30 which determined the effectiveness of a remotely operated computer-based logarithmic (LogMAR) VA chart in 52 subjects (mean age: 23±6.1, 18–51, 67.3% women). VA was assessed using a laptop or computer-based LogMAR chart (COMPlog) with either the optometrist present or not present and testing conducted remotely. Remote access was obtained via the internet, utilizing TeamViewer software to control the system linked to COMPlog with instructions provided over the telephone. That study found that VA measurements measured remotely were comparable (p = 0.648 with limits of agreement ranging from +0.26 to −0.26 LogMAR) to those performed in person by an optometrist within a university population. In the current study, the limits of agreement were similar and narrower, ranging between −0.19 to 0.16, −0.19 to 0.12, and −0.16 to 0.17 in the entire cohort, non-presbyopic, and presbyopic subgroups, respectively.
Similarly, a previous study17 evaluated the efficacy of a web-based VA assessment tool (“PocDoc”) compared with conventional VA testing among 353 participants (mean age 52.2 ± 20.6 years, 59.2% males). The PocDoc tool showed a moderate positive correlation with conventional testing (rho = 0.50, p < 0.001) across various ages and conditions, although the mean LogMAR was statistically different between both tests. In the present study, the correlation between the two VA tests was higher (rho > 0.72) and the measurements of the two optotypes were not significantly different, despite the fact it compared static and dynamic optotypes, whereas the previous study compared two static optotypes.
The VA data in the present study demonstrated a heteroscedasticity effect, indicating a lower agreement between the VA testing of the two optotypes for participants with reduced VA. These findings have been previously reported for another web-based VA test,17 which could be due to the remote testing nature of the test, or a characteristic of VA tests in general. In any case, VA measurements in patients with impaired vision should be carefully interpreted and further researched.
The results of the present study are also in-line with other studies that examined the interchangeability between VA measurements of the Dyop and other optotypes measured in the traditional setting (not online). One study9 examined validation of the Dyop acuity test among 162 subjects and found a strong linear correlation between Sloan and Dyop acuity measurements (r = 0.94; p < 0.001). Sum and Woo6 investigated whether the Dyop dynamic optotype is comparable to the conventional LogMAR E optotype in 150 participants (mean age: 58.7 ± 14.3). Based on the mean difference of 0.05 ± 0.07 LogMAR, and 95% limits of agreement ranging between −0.09 and 0.19 LogMAR, they concluded that the two optotype measurements are interchangeable. In the current study, the limits of agreement were similar, with lower mean differences between the VA measurements.
Another study8 conducted in 160 children (mean age: 8.4 ± 2.9 years, range: 4–17) found a strong, positive linear correlation of 0.88 and a mean difference of 0.03 ± 0.08 LogMAR between Dyop Chart 2020 VA measurement and a standard Lea chart measurement. This mean difference is similar, though higher than the current study.
In addition to the insights of this study, some limitations should be noted.
The study was conducted in the participant’s homes on their home computers, leading to potential variation in measurement conditions including; room lighting, screen size, and measurement distance. Despite efforts to standardize these parameters, unavoidable inconsistencies may have introduced inaccuracies, affecting the results. Additionally, glare reflecting off the computer could have impacted VA measurements, potentially leading to an artificial decline in patients’ performance.17 Further, the refractive error of the participants was unknown due to online testing without an in-office refractive examination. In the current experimental setting, each participant served as their own control and the varying conditions are not expected to have influenced the results of this study. However, the varying testing conditions could be a limitation for tele-optometry that should be taken into consideration by the examiner.
Additionally, this study included healthy non-presbyopic and presbyopic participants up to the age of 60. Future studies should expand the investigation to older ages and diseased populations.
Another limitation of the study is that it analyzed the mean data of three consecutive measurements, whereas clinical measurements are typically performed only once. Therefore, the results may not fully reflect clinical measurements. Given the high level of agreement between consecutive measurements as indicated by the high ICC values, this is not expected to be a major limitation.
In the present study, only ten participants were defined as having a visual impairment, and the data demonstrated more variability between measurements for these VA values.17 Future studies should include larger cohorts of populations with visual impairment to validate the feasibility and agreement of virtual online VA testing in this population.
In conclusion, based on the results of the present investigation in healthy non-presbyopic and presbyopic participants up to the age of 60, online LogMAR and Dyop VA measurements using the Chart 2020 application are interchangeable. This method holds promise for teleoptometry, particularly in remote or underserved areas.
Acknowledgments
The authors would like to thank Asala Abu Hasnah, Yasmeen Al-Azzeh, Areen Al-Essawy and Yara Awad for their assistance with various aspects of data collection. The authors also wish to thank Dr Liat Gantz for her helpful insights on the manuscript, and Mrs Halit Kantor for her guidance with statistical analysis.
Disclosure
The authors report no conflicts of interest in this work.
References
1. Lewis P, Rosén R, Unsbo P, Gustafsson J. Resolution of static and dynamic stimuli in the peripheral visual field. Vision Res. 2011;51:1829–1834. doi:10.1016/j.visres.2011.06.011
2. Ríos HA, Lövestam-Adrian M, Plainis S, et al. Additional measures of macular function beyond visual acuity. Graefes Arch Clin Exp Ophthalmol. 2024;262:1723–1736. doi:10.1007/s00417-023-06272-1
3. Gantz L, Paritzky D, Wunch I, et al. Validation of the DYOP visual acuity test. J Optom. 2023;16:268–276. doi:10.1016/j.optom.2022.09.006
4. Sum RW, Woo GC. Subjective refractions determined by Dyop® and LogMAR chart as fixation targets. Ann Eye Sci. 2022;7:34. doi:10.21037/aes-22-17
5. Oduntan OA, Mashige KP, Raliavhegwa-Makhado M. A comparison of two methods of logMAR visual acuity data scoring for statistical analysis. Afr Vision Eye Health. 2009;68:155–163.
6. Sum WMR, Woo G. Comparison of distance visual acuity measurement between dynamic optotype and LogMAR E charts. Zhonghua Shiyan Yanke Zazhi/Chin J Exp Ophthalmol. 2021;39:534–537.
7. Gordon P. Visual acuity-DYOP® versus Snellen acuity charts: a review. J Clin Ophthalmol. 2021:500–503.
8. Barnett-Itzhaki G, Barnett-Itzhaki Z, Ela-Dalman N. The dynamic optotype (Dyop): a novel visual acuity test for use in children. J AAPOS. 2021;25:285.e1–285.e5. doi:10.1016/j.jaapos.2021.04.009
9. Harris PA, Keim E. Validation of the DyopTM visual acuity test. Invest Ophthalmol Vis Sci. 2015;56:3888.
10. Ishigaki H, Miyao M. Implications for dynamic visual acuity with changes in aged and sex. Percept Mot Skills. 1994;78:363–369. doi:10.2466/pms.1994.78.2.363
11. Chen G, Zhang J, Qiao Q, et al. Advances in dynamic visual acuity test research. Front Neurol. 2023:13. doi:10.3389/fneur.2022.1047876
12. Sum R, Woo GC. Comparison of subjective refraction findings with Dyop acuity chart and LogMAR E chart. In
13. Massie J, Block SS, Morjaria P. The role of optometry in the delivery of eye care via Telehealth: a systematic literature review. Telemed E-Health. 2022;28:1753–1763. doi:10.1089/tmj.2021.0537
14. Mair F. Systematic review of studies of patient satisfaction with telemedicine. BMJ. 2000;320:1517–1520. doi:10.1136/bmj.320.7248.1517
15. Sommer AC, Blumenthal EZ. Telemedicine in ophthalmology in view of the emerging COVID-19 outbreak. Graefes Arch Clin Exp Ophthalmol. 2020;258:2341–2352. doi:10.1007/s00417-020-04879-2
16. Sah S, Liu R, Lai H, et al. Improving access to eye care in rural communities: PocDoc’s web-based visual acuity screening tool. Telemed J E Health. 2024;30:763–770. doi:10.1089/tmj.2023.0234
17. Boon J, Goh JS, Rojas-Carabali W, et al. Web-based vs. conventional: a comprehensive analysis of visual acuity assessment using the PocDoc tool in a tertiary eye care centre. Eye. 2024;38:3554–3561. doi:10.1038/s41433-024-03362-0
18. Wisse RPL, Muijzer MB, Cassano F, et al. Validation of an independent web-based tool for measuring visual acuity and refractive error (the manifest versus online refractive evaluation trial): prospective open-label noninferiority clinical trial. J Med Internet Res. 2019;21:e14808. doi:10.2196/14808
19. TeleVisus: remote visual acuity testing. Available from: https://www.easee.online/en/televisus-remote-visual-acuity-testing/.
20. Bailey IL, Lovie JE. New design principles for visual acuity letter charts. Optometry Vision Sci. 1976;53:740–745. doi:10.1097/00006324-197611000-00006
21. Thirunavukarasu AJ, Mullinger D, Rufus-Toye RM, Farrell S, Allen LE. Clinical validation of a novel web-application for remote assessment of distance visual acuity. Eye. 2021;36:2057. doi:10.1038/s41433-021-01760-2
22. Hayes J, Tai Y-C, Jang SO, Sheedy J. Visual acuity with a motion detection target compared to Landolt Rings. J Vis. 2011;11:748. doi:10.1167/11.11.748
23. Faul F, Erdfelder E, Lang A-G, Buchner A. G*Power 3: a flexible statistical power analysis program for the social, behavioral, and biomedical sciences. Behav Res Methods. 2007;39:175–191. doi:10.3758/BF03193146
24. Bland JM, Altman DG. Measuring agreement in method comparison studies. Stat Methods Med Res. 1999;8:135–160. doi:10.1177/096228029900800204
25. Giavarina D. Understanding Bland Altman analysis. Biochem Med. 2015;25:141–151. doi:10.11613/BM.2015.015
26. Getachew T, Mengistu M, Getahun F. Prevalence of visual impairment and associated factors among older adults in Southern Ethiopia, 2022. Clin Optom. 2024;16:1–16. doi:10.2147/OPTO.S440423
27. Frick KD, Foster A. The magnitude and cost of global blindness: an increasing problem that can be alleviated. Am J Ophthalmol. 2003;135:471–476. doi:10.1016/S0002-9394(02)02110-4
28. Bourne RRA, Briant PS, Flaxman SR, et al. Causes of blindness and vision impairment in 2020 and trends over 30 years, and prevalence of avoidable blindness in relation to VISION 2020: the right to sight: an analysis for the Global Burden of Disease Study. Lancet Glob Health. 2020;9:e144.
29. Uchino M, Kawashima M, Kaido M, et al. Evaluation of a paper-based visual acuity questionnaire. Clin Ophthalmol. 2017;11:1213–1217. doi:10.2147/OPTH.S138399
30. Srinivasan K, Ramesh SV, Babu N, et al. Efficacy of a remote based computerised visual acuity measurement. Br J Ophthalmol. 2012;96:987–990. doi:10.1136/bjophthalmol-2012-301751
31. Kaiser PK. Prospective evaluation of visual acuity assessment: a comparison of Snellen versus ETDRS charts in clinical practice (An AOS Thesis). Trans Am Ophthalmol Soc. 2009;107:311–324.
 © 2025 The Author(s). This work is published and licensed by Dove Medical Press Limited. The
full terms of this license are available at https://www.dovepress.com/terms.php
and incorporate the Creative Commons Attribution
- Non Commercial (unported, 4.0) License.
By accessing the work you hereby accept the Terms. Non-commercial uses of the work are permitted
without any further permission from Dove Medical Press Limited, provided the work is properly
attributed. For permission for commercial use of this work, please see paragraphs 4.2 and 5 of our Terms.
© 2025 The Author(s). This work is published and licensed by Dove Medical Press Limited. The
full terms of this license are available at https://www.dovepress.com/terms.php
and incorporate the Creative Commons Attribution
- Non Commercial (unported, 4.0) License.
By accessing the work you hereby accept the Terms. Non-commercial uses of the work are permitted
without any further permission from Dove Medical Press Limited, provided the work is properly
attributed. For permission for commercial use of this work, please see paragraphs 4.2 and 5 of our Terms.