")
Back to Journals » Journal of Inflammation Research » Volume 17
Comparison of Serum Vitamin D Levels in Obese Subjects with and without Type 2 Diabetes Mellitus
Authors Shen ZJ, Liu M, Zhang JX, Huang Y, Kong Y, Liu SG
Received 23 April 2024
Accepted for publication 20 July 2024
Published 2 September 2024 Volume 2024:17 Pages 5915—5922
DOI https://doi.org/10.2147/JIR.S475180
Checked for plagiarism Yes
Review by Single anonymous peer review
Peer reviewer comments 2
Editor who approved publication: Professor Ning Quan
Zhi-Jun Shen, Miao Liu, Jun-Xia Zhang, Yu Huang, Ying Kong, Shi-Guo Liu
Department of Clinical Laboratory, Hubei Third People´s Hospital Affiliated to Jianghan University, Wuhan, 430033, People’s Republic of China
Correspondence: Shi-Guo Liu, Department of Clinical Laboratory, Hubei Third People´s Hospital Affiliated to Jianghan University, No. 26, Zhongshan Road, Wuhan, Qiaokou District, People’s Republic of China, Email [email protected]
Background: Although observational studies have reported a correlation between vitamin D deficiency and type 2 diabetes mellitus (T2DM), epidemiological evidence on the risk of obese subjects suffering T2DM due to a vitamin D deficiency is limited. Therefore, we investigated the correlation between T2DM and serum vitamin D, lipids, blood pressure, insulin indexes in an obese population.
Methods: A total of 1440 participants including 450 healthy controls and 990 obese subjects, 470 without T2DM and 520 with T2DM. Serum vitamin D levels were measured, and the association between low levels and T2DM in obese subjects was examined using multinomial and linear regression analyses.
Results: Of the participants, 35% had deficient or insufficient vitamin D levels (ie, < 20 ng/mL). Compared with healthy controls, obese subjects, particularly those with T2DM had lower vitamin D levels. Multinomial logistic regression analysis showed that obese subjects with T2DM had a gradually increasing risk for desirable (RO = 1.41, 95% CI 1.06– 1.93, P = 0.027), insufficient (RO = 1.83, 95% CI 1.27– 2.84, P < 0.001), or deficient ((RO = 2.14, 95% CI 1.15– 3.75, P = 0.014) vitamin D levels. In obese subjects with T2DM, vitamin D levels correlated inversely with the risk indicators for diabetes, such as the levels of HbA1c (β = − 0.16, P = 0.002), fasting insulin (Fins; β = − 0.31, P = 0.008), and HOMA-IR (β = − 0.19, P < 0.001). In obese subjects without T2DM, vitamin D was associated negatively with the risk of having T2DM at five-year follow-up (relative risk = 0.93, 95% CI 0.79– 0.97, P = 0.037).
Conclusion: This study demonstrates that low vitamin D levels correlate with the presence of T2DM in the obese population. This finding indicates that hypovitaminosis D may be a potential biological vulnerability factor for the development of T2DM in obese subjects.
Keywords: vitamins, T2DM, obesity, biomarker
Introduction
Type 2 diabetes mellitus (T2DM) is a common metabolic disorder and its incidence is rising. It is well established that obesity is related to an increased risk of developing insulin resistance and subsequently T2DM.1 In an obese population, the levels of non-esterified fatty acids, glycerol, hormones, and inflammatory cytokines derived from adipose tissue are increased significantly and promote the development of insulin resistance.2 When insulin resistance is accompanied by functional beta-cell abnormalities this increases the risk of developing T2DM.2 The etiology and pathophysiology of T2DM in obese subjects have not yet been fully understood, although recent studies have reported the underlying roles of some common biological factors that may influence the development of T2DM in the obese population.
For example, vitamin D is increasingly thought to be associated with insulin resistance, the metabolic syndrome, and obesity and it has been reported that hypovitaminosis D may contribute to T2DM in obese people.3 Studies in humans have demonstrated the presence of vitamin D receptors (VDR) and 1α-hydroxylase, an enzyme that catalyzes the synthesis of 1.25-dihydroxyvitamin D within adipose tissue.4 Vitamin D also regulates blood glucose levels by controlling insulin secretion and sensitivity.5 In addition, adipose tissue is a major storage site of vitamin D and also secretes numerous adipocytokines involved in the inflammatory response, insulin resistance, obesity, and T2DM.6 Notably, there is evidence that vitamin D regulates hepatic lipid and glucose metabolism and counteracts diet-stimulated insulin resistance in skeletal muscle.7,8 Vitamin D also affects inflammatory cascades by inhibiting autoimmune pathways through VDR-mediated gene transcription, which in turn, is associated with insulin resistance.9
To date, epidemiological studies were performed to only explore the correlation between vitamin D and T2DM or obesity.10–13 However, the effect of hypovitaminosis D on the obese subjects with T2DM has not been reported. Therefore, the current study assessed the relationship between vitamin D levels and T2DM in a large obese population taking key confounding factors into account. Moreover, our findings highlight that hypovitaminosis D may be a potential biological vulnerability factor for the development of T2DM in obese subjects. The main aim of the study was to compare the serum levels of vitamin D in healthy controls and obese subjects with or without T2DM. The study also examined whether serum vitamin D levels in subjects with T2DM were related to specific clinical characteristics. We hypothesized that serum vitamin D levels would be lower in the obese population with or without T2DM than that in healthy controls, and that low vitamin D levels in obese subjects with T2DM would correlate with less favorable clinical features and subsequent health outcomes.
Materials and Methods
Study Participants
From January 2019 to December 2023, a total of 990 obese subjects with (n = 520) or without (n = 470) T2DM were enrolled in the study. According to the 1998 criteria of the World Health Organization, the definition of obesity was adopted as BMI ≥ 25 kg/m2. The study was approved by the local ethics committee, with informed, written consent provided by each participant. The subjects including 610 males and 380 females, aged 30–65 years (mean age 51.0 ± 11.4 years) were enrolled from our hospital. In addition, 450 age- and sex- matched healthy individuals aged 29–62 years were recruited as controls (269 males and 181 females; mean age 49.5 ± 13.5 years). T2DM was diagnosed based on the World Health Organization (WHO) criteria. Diabetes was diagnosed as a fasting plasma glucose level ≥ 7.0 mmol/L and 2-h post-load plasma glucose (2h PG) concentration ≥ 11.1 mmol/L. T2DM without ketosis and good β-cell reserve was defined by the results of the C-peptide assay (fasting ≥ 0.6 pmol/mL; induced ≥ 1.6 pmol/mL). To exclude the effect of drug therapy on the concentrations of serum markers, the participants with T2DM did not receive any drug therapy. Clinical data, including age, sex, education, exposure to sunlight in the previous 10 weeks, smoking status, alcohol use, physical activity, use of vitamin D supplements, body mass index (BMI), and blood pressure were collected from each individual. Participants in the control group with malignant tumors, renal or liver disorders, or other endocrinological disorders were excluded from the study. None of the control group were taking anti-hypertensive drugs, diabetes medications, estrogen supplements, or hypolipidemic drugs. The present study was approved by the ethics committee of Hubei Third People´s Hospital Affiliated to Jianghan University (No. 20180231).
Biochemical Analysis
Blood samples were collected from the subjects after an overnight fast. The serum levels of total cholesterol (TC), triglyceride (TG), high-density lipoprotein cholesterol (HDL-C), and low-density lipoprotein cholesterol (LDL-C) were measured using a Siemens biochemical analyzer, while the levels of serum fasting insulin (Fins) were analyzed by an electrochemiluminescence immunoassay (Roche Elecsys Insulin Assay, Roche Diagnostics, Mannheim, Germany). The homeostatic model assessment of insulin resistance (HOMA-IR) was calculated according to fasting insulin level (Fins, Mu/mL) × fasting blood glucose (FPG, mmol/L) / 22.5. Hemoglobin (HbA1c) levels were measured by high-performance chromatography. All the participants received computed tomography (CT) scanning at the L2-L3 and L4-L5 levels to assess the areas of abdominal visceral and subcutaneous fat. The mean visceral fat and the mean subcutaneous fat areas at the L2-L3 and L4-L5 levels were used in all the analyses.
Vitamin D levels were obtained by calculating the sum of D2 and D3, and the concentrations of vitamin D2 and D3 were determined by liquid chromatography with tandem mass spectrometry (LC-MS/MS). In brief, serum (20 μL) and acetonitrile with stable isotope-labeled internal standard (200 μL) were transferred into a polypropylene conical centrifuge tube, respectively. Then the tubes were mixed completely and centrifugated (12,000 g, 5 min at 4°C) for protein precipitation. Next, the tubes were moved to −20°C refrigerator for 20 min resulting in the separation of aqueous and organic phases. Finally, the upper organic phase (20 μL) was transferred into a 96-well plate and the diluent (acetonitrile/methanol, v/v=1:1) was added into each well for LC-MS/MS analysis. Participants in each group were divided into four groups based on their vitamin D levels, including deficient (< 10 ng/mL), insufficient (10 ~ 20 ng/mL), adequate (20 ~ 30 ng/mL), and desirable (> 30 ng/mL).
Statistical Analysis
The data were expressed as percentages or mean ± s.d. as appropriate. Differences in baseline variables grouped according to T2DM status were analyzed using the Chi-square test or analysis of variance as appropriate. The adjusted mean levels of vitamin D across T2DM status in the two obese groups were compared by analysis of covariance. To identify significant differences, post-hoc tests between the groups were carried out using Tukey’s test, with Cohen’s d calculated as a measure of effect size. To observe possible differences due to confounding factors, sunlight hours, smoking habits, alcohol use, physical activity, BMI, HbA1c, TC, TG, LDL-C, Fins, HOMA-IR, subcutaneous fat, and visceral fat were entered into totally adjusted models. The odds ratio for desirable, adequate, and insufficient versus deficient vitamin D levels across the T2DM status groups were compared using multinomial logistic regression. To evaluate whether specific clinical variables were related to vitamin D levels, linear regression analysis was performed for each variable within the obese population with T2DM. Multivariate analysis was used to assess whether serum vitamin D levels were a predictor of T2DM in the obese population after a five-year follow-up period. All data were analyzed by SPSS 22.0 (SPSS Inc., Chicago, IL).
Results
The clinical data of the healthy controls and the obese population are summarized in Table 1. The mean age of the participants was 50.5± 12.4 years with 61.0% being males. Obese participants without or with T2DM were exposed to less sunlight. Subjects with T2DM were more often smokers, carried out less physical activity, and had a higher BMI. In addition, the levels of HbA1c, TC, TG, LDL-C, Fins, HOMA-IR, subcutaneous fat, and visceral fat in obese individuals with T2DM were higher than that in obese subjects without T2DM and healthy controls. Only 9.93% of the participants used vitamin D supplements. These supplements were therefore not retained in the subsequent analysis due to their low prevalence and the lack of correlation with T2DM. The obese subjects with T2DM also had significantly lower levels of vitamin D. Interestingly, vitamin D levels were associated significantly with sunlight exposure (r = 0.38, P < 0.001), physical activity (r = 0.18, P = 0.016), BMI (r = −0.25, P < 0.001), and HOMA-IR BMI (r = −0.21, P < 0.001).
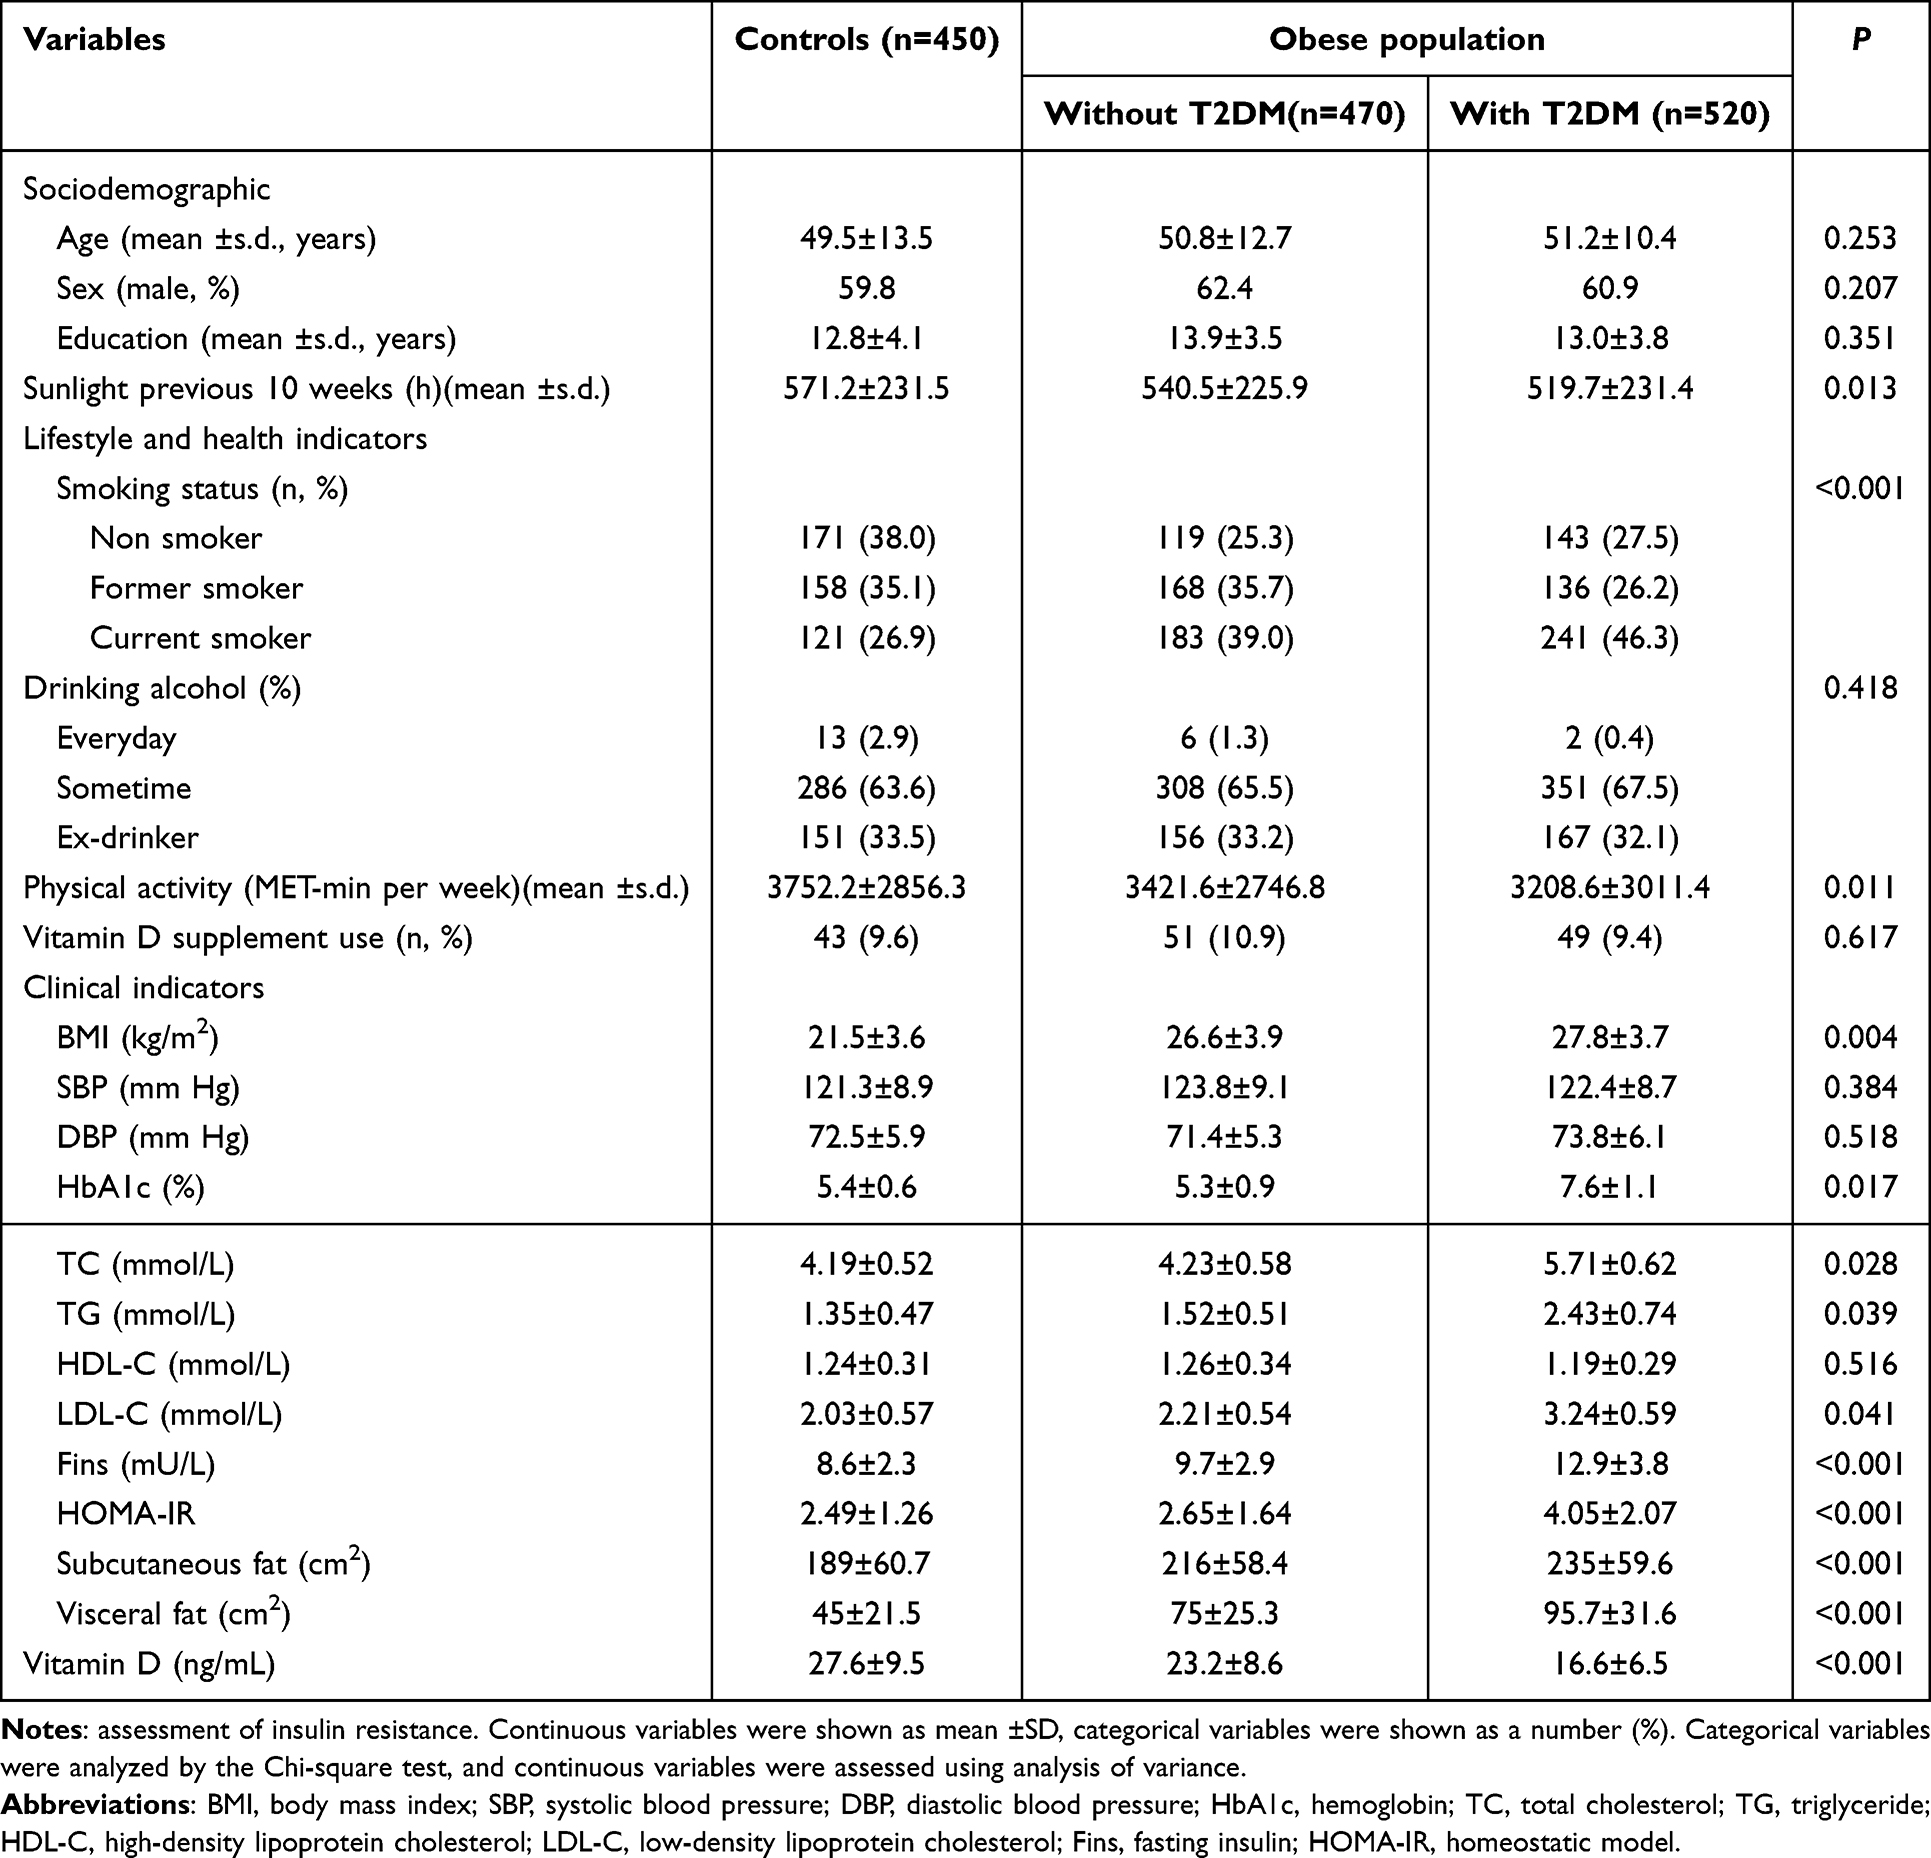 |
Table 1 Clinical and Biochemical Characteristics of the Study Population |
Table 2 shows the adjusted mean levels of vitamin D in the two obese groups. After adjustment for sunlight exposure, smoking habits, alcohol use, and physical activity, a visible (P < 0.001) and progressively lower vitamin D level was found in healthy controls to obese subjects without T2DM to obese subjects with T2DM. Compared with controls, obviously lower vitamin D levels were found in obese subjects without T2DM (P = 0.006) or with T2DM (P < 0.001). Further adjustment for clinical indicators did not change these correlations (P = 0.002), with differences between healthy controls and obese subjects without T2DM being decreased significantly (P = 0.054), but remaining significant for obese participants with T2DM (P = 0.002).
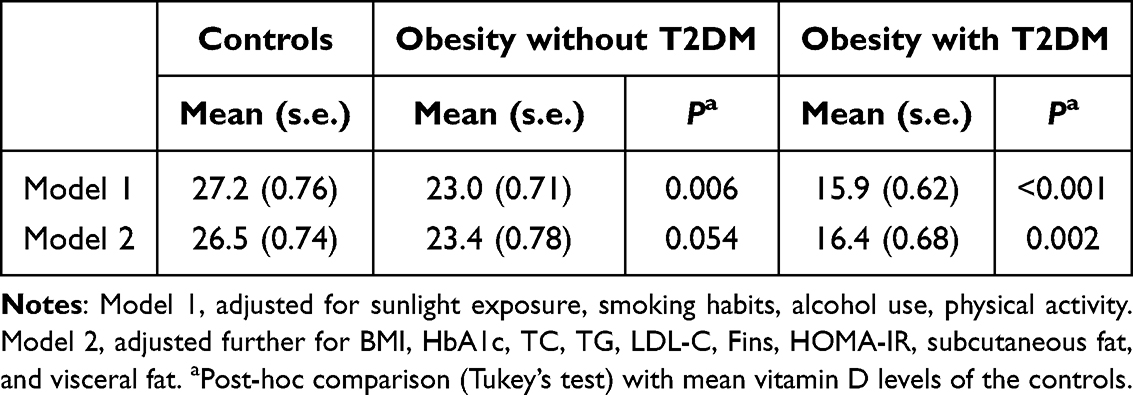 |
Table 2 Adjusted Means of Serum Vitamin D Levels Across the Obese Groups |
Of the participants, 28.4% had insufficient vitamin D levels (10 ~ 20 ng/mL) and 6.6% had deficient levels (< 10 ng/mL). The proportion of subjects with deficient vitamin D levels showed an increasing trend from the controls (3.7%) to the obese subjects without T2DM (6.4%) and to obese subjects with T2DM (9.2%) (Figure 1). Similarly, the proportion of subjects with adequate vitamin D levels showed a reducing trend from the controls (42.3%) to obese subjects without T2DM (23.6%) and to obese subjects with T2DM (19.7%).
 |
Figure 1 Clinical classification of serum vitamin D levels across the control and obese groups. Deficient, < 10 ng/mL; insufficient, 10 ~ 20 ng/mL; adequate, 20 ~ 30 ng/mL; desirable, > 30 ng/mL. |
Table 3 shows the odds ratios for deficient, insufficient, and desirable vitamin D levels analyzed by multinomial logistic regression in which adequate status (> 30 ng/mL) was set as the reference category. In the partially adjusted models, compared with controls, obese subjects with T2DM had a 1.44-fold (P = 0.025), 2.02-fold (P < 0.001), and 2.54-fold (P < 0.001) increased risk for desirable, insufficient, and deficient vitamin D levels, respectively. In the fully adjusted models, compared with controls, obese subjects with T2DM had a 1.41-fold (P = 0.027), 1.83-fold (P < 0.001), and 2.14-fold (P = 0.014) increased risk for desirable, insufficient, and deficient vitamin D levels, respectively. Compared with controls, obese subjects without T2DM had a 1.72-fold (P = 0.005) increased risk for deficient vitamin D levels and a non-significant increased risk for insufficient or desirable levels.
 |
Table 3 Adjusted Correlation Between T2DM Status and Clinical Classification of Serum Vitamin D Levels |
Linear regression models were used to determine the correlation between the specific clinical indicators of T2DM and vitamin D levels in obese subjects with T2DM (Table 4). After partial adjustment, HbA1c (β = −0.24, P < 0.001), TC (β = −0.35, P = 0.015), LDL-C (β = 3.41, P = 0.042), Fins (β = −0.39, P < 0.001), and HOMA-IR (β = −0.24, P < 0.001) were negatively and significantly correlated with vitamin D levels. After full adjustment, HbA1c (β = −0.16, P = 0.002), TC (β = −0.28, P = 0.047), Fins (β = −0.31, P = 0.008), and HOMA-IR (β = −0.19, P < 0.001) were negatively and significantly correlated with vitamin D levels. No correlations were observed in the fully adjusted models for TG, LDL-C, subcutaneous fat, and visceral fat.
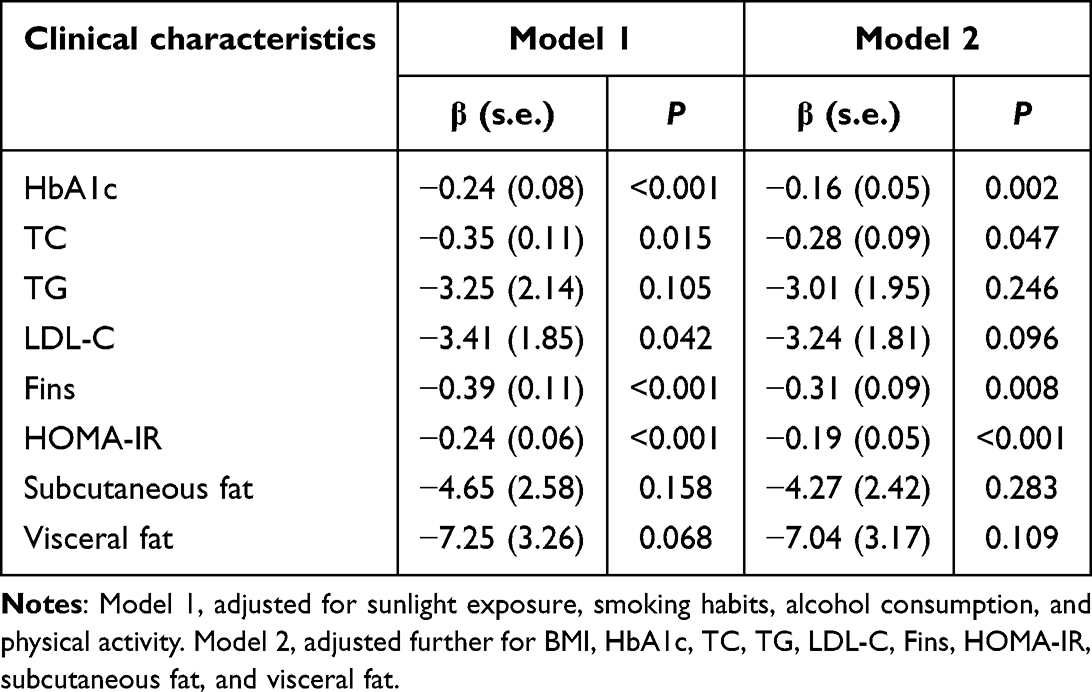 |
Table 4 Adjusted Correlations Between T2DM Characteristics and Serum Vitamin D Levels in Obese Subjects with T2DM |
We further assessed whether serum vitamin D levels predicted the development of T2DM in 378 (80.4%) obese subjects without T2DM and available data during the five-year follow-up period (Table 5). After adjustment for all confounding factors, each s.d. increase in vitamin D levels was related to a 7% reduced risk (P = 0.037) of having T2DM at follow-up (42.4% prevalence). Higher vitamin D levels also correlated with a lower time for having T2DM during the follow-up period (P = 0.021) and a decreased tendency of having T2DM for > 3.75 years (highest quartile) during the follow-up period (P = 0.001). Compared to subjects with adequate vitamin D levels, those with insufficient or deficient vitamin D levels had a 1.59 (95% CI, 1.10–2.53, P = 0.035) and 1.84 (95% CI, 1.09–2.69, P = 0.013) higher prevalence of having T2DM for > 3.75 years during the follow-up period.
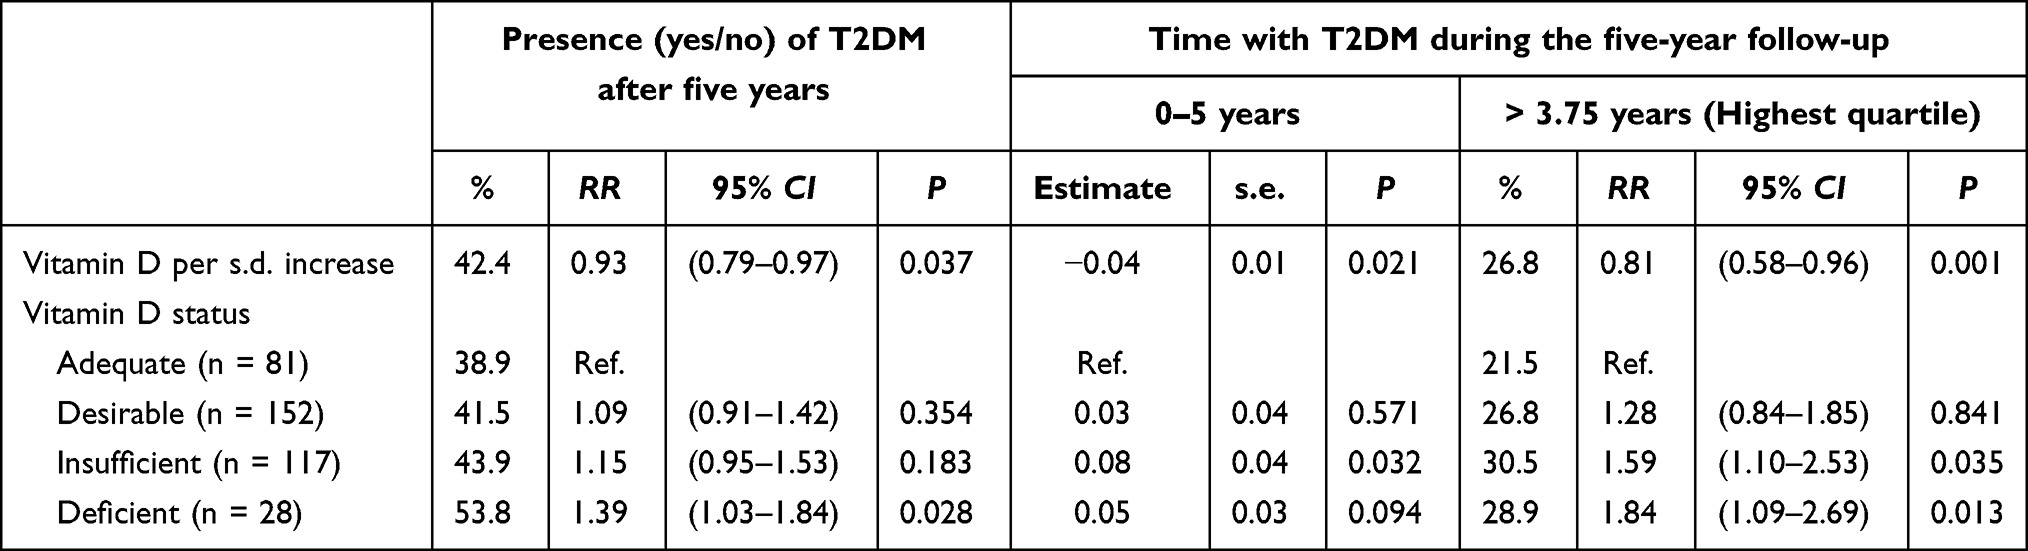 |
Table 5 Multivariate Analysis on Serum Vitamin D Level as a Predictor of T2DM in Subjects with Obesity During the Five-Year Follow-Up (n=378) |
Discussion
This study in a large cohort including obese subjects and healthy controls showed that after adjusting for many possible confounding factors, low serum levels of vitamin D correlated with obesity in T2DM subjects and also the development of the disorder in the obese population. Clinically insufficient and deficient levels of vitamin D were more likely to be found in obese individuals. Furthermore, in the obese population low serum vitamin D levels were associated with an increased risk for developing T2DM over a five-year follow-up period.
It has been reported recently that a major cause for the development of insulin resistance is an insufficient level of vitamin D.3 Some clinical studies have shown that vitamin D supplementation ameliorates major metabolic parameters associated with insulin resistance, such as LDL-C, TC, HbA1c, TG, and HOMA-IR.14,15 Barzegardi et al also reported a significant reduction in the serum levels of TG, LDL-C, and TC in patients with diabetic nephropathy following vitamin D supplementation.16 In addition, the status of insulin-resistant obesity has been shown to be related closely to low circulating levels of vitamin D.17 Some studies have also confirmed that vitamin D modulates fatty acid composition in subcutaneous adipose tissue by directly regulating the expression of Elovl3.18 Collectively, these investigations confirm that vitamin D ameliorates the metabolic abnormalities of diabetes. Moreover, our study also showed that vitamin D levels were negatively and significantly correlated with HbA1c, TC, Fins, and HOMA-IR after full adjustment for all other confounders.
However, some clinical studies have reported that vitamin D levels have no effect on insulin resistance and other abnormalities such as oxidative stress and inflammation. For example, several studies in patients with T2DM have shown that vitamin D supplementation has no effect on hs-CRP levels, oxidative stress markers, LDL, HDL, or HbA1c.19,20 However, these clinical studies had a small sample size and did not fully take confounding factors into account. Notably, our results provided strong confirmative evidence to the findings of these previous studies and were based mainly on a small sample size and vitamin D supplementation and analyzed the association between vitamin D and T2DM in obese subjects using direct measurement of serum vitamin D levels. Significantly, low serum levels of vitamin D were found in the obese population. Nevertheless, no definite conclusions regarding this correlation can be inferred from the current results. Hypovitaminosis D may also be a consequence of obesity, due to the fact obesity is known to affect health-associated lifestyle, including physical activity and diet, both of which have been reported to correlate with serum vitamin D levels.21,22 However, our findings should promote further longitudinal and experimental studies to clarify the presence of consistent time-sequenced correlations and explain the link between the causality of T2DM and vitamin D levels. Clarifying the role of vitamin D in the signaling pathways involved in the development of T2DM in the obese population may have important implications. Although hypovitaminosis D is common,23 underlying modified determinants of vitamin D status, including dietary habits, use of dietary supplements, or sun exposure provide new strategies to prevent T2DM in obese individuals.24
The current study had some limitations. The research design was mainly cross-sectional and therefore no inference on the directionality of the association between T2DM and vitamin D levels can be made. In addition, the dietary intake of vitamin D was not taken into account due to the unavailability of nutritional data. The study also had some strengths, such as a large sample size, a gold-standard method to measure vitamin D, and full adjustment for potential confounding factors in the statistical analyses.
Conclusion
In summary, our findings show that low vitamin D levels correlate with the presence of T2DM in an obese population. This suggests that hypovitaminosis D may represent a potential biological vulnerability for T2DM in the obese population. Our data allow us to confirm that normalization of vitamin D levels may become a potential future strategy to prevent T2DM and its complications in obese subjects.
Ethical Statement
Our study complies with the Declaration of Helsinki.
Acknowledgments
The authors would like to express their gratitude to EditSprings (https://www.editsprings.cn) for the expert linguistic services provided.
Disclosure
The authors declare that they have no conflicts of interest for this work.
References
1. Rexiati R, Tiantong L, Zou X, et al. Obesity and type 2 diabetes mellitus, connections in epidemiology, pathogenesis, and treatments. Front Endocrinol. 2023;14:1161521. doi:10.3389/fendo.2023.1161521
2. John I, Malone B, Hansen C. Does obesity cause type 2 diabetes mellitus (T2DM)? Or is it the opposite? Pediatr Diabetes. 2019;20(1):5–9. doi:10.1111/pedi.12787
3. Szymczak-Pajor I, Drzewoski J, Śliwińska A. The molecular mechanisms by which vitamin D prevents insulin resistance and associated disorders. Int J Mol Sci. 2020;21(18):6644. doi:10.3390/ijms21186644
4. Pramono A, Johan WE, Essers YP, Goossens GH, Blaak EE. Vitamin D and tissue-specific insulin sensitivity in humans with overweight/obesity. J Clin Endocrinol Metab. 2019;104(1):49–56. doi:10.1210/jc.2018-00995
5. Wimalawansa SJ. Associations of vitamin D with insulin resistance, obesity, type 2 diabetes, and metabolic syndrome. J Steroid Biochem Mol Biol. 2018;175:177–189. doi:10.1016/j.jsbmb.2016.09.017
6. Abbas MA. Physiological functions of Vitamin D in adipose tissue. J Steroid Biochem Mol Biol. 2017;165:369–381. doi:10.1016/j.jsbmb.2016.08.004
7. Leung PS. The potential protective action of vitamin D in hepatic insulin resistance and pancreatic islet dysfunction in type 2 diabetes mellitus. Nutrients. 2016;8:147. doi:10.3390/nu8030147
8. Benetti E, Mastrocola R, Chiazza F, et al. Effects of vitamin D on insulin resistance and myosteatosis in diet-induced obese mice. PLoS One. 2018;13:e0189707. doi:10.1371/journal.pone.0189707
9. Bizzaro G, Antico A, Fortunato A, Bizzaro N. Vitamin D and autoimmune diseases, is vitamin D receptor (VDR) polymorphism the culprit? Isr Med Assoc J. 2017;19(7):438–443.
10. Wenclewska S, Szymczak-Pajor I, Drzewoski J, Bunk M, Sliwinska A. Vitamin D supplementation reduces both oxidative DNA damage and insulin resistance in the elderly with metabolic disorders. Int J Mol Sci. 2019;20:2891. doi:10.3390/ijms20122891
11. Upreti V, Maitri V, Dhull P, Handa A, Prakash MS, Behl A. Effect of oral vitamin D supplementation on glycemic control in patients with type 2 diabetes mellitus with coexisting hypovitaminosis D, a parallel group placebo controlled randomized controlled pilot study. Diabetes Metab Syndr. 2018;12:509–512. doi:10.1016/j.dsx.2018.03.008
12. Lerchbaum E, Trummer C, Theiler-Schwetz V, et al. Effects of vitamin D supplementation on body composition and metabolic risk factors in men, a randomized controlled trial. Nutrients. 2019;11:1894. doi:10.3390/nu11081894
13. Forouhi NG, Menon RK, Sharp SJ, et al. Effects of vitamin D2 or D3 supplementation on glycaemic control and cardiometabolic risk among people at risk of type 2 diabetes, results of a randomized double-blind placebo-controlled trial. Diabetes Obes Metab. 2016;18:392–400. doi:10.1111/dom.12625
14. Rasouli N, Brodsky IG, Chatterjee R, et al. D2d Research Group. Effects of vitamin D supplementation on insulin sensitivity and secretion in prediabetes. J Clin Endocrinol Metab. 2022;107(1):230–240. doi:10.1210/clinem/dgab649
15. Niroomand M, Fotouhi A, Irannejad N, Hosseinpanah F. Does high-dose vitamin D supplementation impact insulin resistance and risk of development of diabetes in patients with pre-diabetes? A double-blind randomized clinical trial. Diabet Res Clin Pract. 2019;148:1–9. doi:10.1016/j.diabres.2018.12.008
16. Barzegari M, Sarbakhsh P, Mobasseri M, et al. The effects of vitamin D supplementation on lipid profiles and oxidative indices among diabetic nephropathy patients with marginal vitamin D status. Diabetes Metab Syndr. 2019;13:542–547. doi:10.1016/j.dsx.2018.11.008
17. Goossens GH. The role of adipose tissue dysfunction in the pathogenesis of obesity-related insulin resistance. Physiol Behav. 2008;94:206–218. doi:10.1016/j.physbeh.2007.10.010
18. Lijuan J, Gupta M, Brian J. Vitamin D regulates fatty acid composition in subcutaneous adipose tissue through Elovl3. Endocrinology. 2016;157(1):91–97. doi:10.1210/en.2015-1674
19. Yiu YF, Yiu KH, Siu CW, et al. Randomized controlled trial of vitamin D supplement on endothelial function in patients with type 2 diabetes. Atherosclerosis. 2013;227:140–146. doi:10.1016/j.atherosclerosis.2012.12.013
20. Asemi Z, Hashemi T, Karamali M, Samimi M, Esmaillzadeh A. Effects of vitamin D supplementation on glucose metabolism, lipid concentrations, inflammation, and oxidative stress in gestational diabetes, a double-blind randomized controlled clinical trial. Am J Clin Nutr. 2013;98:1425–1432. doi:10.3945/ajcn.113.072785
21. de Azevedo FR, Caramelli B. Hypovitaminosis D and obesity - coincidence or consequence? Eur Endocrinol. 2013;9(2):128–131. doi:10.17925/EE.2013.09.02.128
22. Greco EA, Lenzi A, Migliaccio S. Role of hypovitaminosis D in the pathogenesis of obesity-induced insulin resistance. Nutrients. 2019;11(7):1506. doi:10.3390/nu11071506
23. Pelczyńska M, Grzelak T, Walczak M, Czyżewska K. Hypovitaminosis D and adipose tissue - cause and effect relationships in obesity. Ann Agric Environ Med. 2016;23(3):403–409. doi:10.5604/12321966.1219177
24. Putranto R, Setiati S, Nasrun MW, et al. Prevalence and factors related to hypovitaminosis D in type 2 diabetes mellitus patients with depression. Acta Med Indones. 55(2):150–157.
 © 2024 The Author(s). This work is published and licensed by Dove Medical Press Limited. The
full terms of this license are available at https://www.dovepress.com/terms.php
and incorporate the Creative Commons Attribution
- Non Commercial (unported, 3.0) License.
By accessing the work you hereby accept the Terms. Non-commercial uses of the work are permitted
without any further permission from Dove Medical Press Limited, provided the work is properly
attributed. For permission for commercial use of this work, please see paragraphs 4.2 and 5 of our Terms.
© 2024 The Author(s). This work is published and licensed by Dove Medical Press Limited. The
full terms of this license are available at https://www.dovepress.com/terms.php
and incorporate the Creative Commons Attribution
- Non Commercial (unported, 3.0) License.
By accessing the work you hereby accept the Terms. Non-commercial uses of the work are permitted
without any further permission from Dove Medical Press Limited, provided the work is properly
attributed. For permission for commercial use of this work, please see paragraphs 4.2 and 5 of our Terms.