")
Back to Journals » Journal of Inflammation Research » Volume 17
Consensus Clustering Analysis Identifies Ferroptosis-Related Patient Clusters and Predictive Signature Construction Based on Ferroptosis-Related Genes in Ischemic Cardiomyopathy
Authors Guo S, Gong Z , Sun X, Gao F, Li X, Zu X, Qu C, Zhang H , Gao H
Received 26 April 2024
Accepted for publication 13 September 2024
Published 30 September 2024 Volume 2024:17 Pages 6797—6814
DOI https://doi.org/10.2147/JIR.S475645
Checked for plagiarism Yes
Review by Single anonymous peer review
Peer reviewer comments 3
Editor who approved publication: Dr Tara Strutt
Shuai Guo,1,* Zhaoting Gong,1,* Xiaona Sun,2 Fei Gao,1 Xiang Li,1 Xiaolin Zu,1 Chao Qu,1 Hongliang Zhang,3 Hai Gao1
1Center for Coronary Artery Disease, Division of Cardiology, Beijing Anzhen Hospital, Capital Medical University, Beijing, People’s Republic of China; 2Department of Cardiology, Laizhou City People’s Hospital, Laizhou, People’s Republic of China; 3Department of Cardiology, Fuwai Hospital, National Center for Cardiovascular Disease, Chinese Academy of Medical Science and Peking Union Medical College, Beijing, People’s Republic of China
*These authors contributed equally to this work
Correspondence: Hai Gao, Center for Coronary Artery Disease, Division of Cardiology, Beijing Anzhen Hospital, Capital Medical University, Beijing, People’s Republic of China, Email [email protected] Hongliang Zhang, Department of Cardiology, Fuwai Hospital, National Center for Cardiovascular Disease, Chinese Academy of Medical Science and Peking Union Medical College, Beijing, 100037, People’s Republic of China, Email [email protected]
Background: Ischemic cardiomyopathy (ICM) significantly contributes to global disease burden, while the role of ferroptosis in ICM remains underexplored.
Methods: We identified differentially expressed ferroptosis-related genes (DEFRGs) by analyzing the GSE57338 dataset and cross-referencing with FerrDb. Consensus clustering was then used to identify ferroptosis-associated clusters within the ICM samples. A ferroptosis-specific predictive signature was developed using the least absolute shrinkage and selection operator (LASSO) method and validated with the GSE5406 dataset. Additionally, quantitative real-time PCR (qRT-PCR) experiments were performed to validate the 11 feature genes in a rat ICM model.
Results: We identified 15 DEFRGs in GSE57338, which distinguished two patient clusters with distinct ferroptosis gene expression, pathway enrichment profiles, and metabolic characteristics. All DEFRGs were upregulated in cluster 2. Potential therapeutic targets were also identified for different ICM patient clusters. The 11-gene predictive signature (TXNRD1, STEAP3, STAT3, SCL2A1, PLIN2, NQO1, NNMT, IL33, ENPP2, ARRDC3, ALOX5) showed robust predictive power in both training and validation sets. High-risk patients exhibited increased infiltration of CD8+ T cells, CD4+ naïve T cells, M0/M1 macrophages, and resting mast cells, along with significant enrichment in epithelial mesenchymal transition and interferon responses. Low-risk patients had higher infiltration of regulatory T cells and monocytes. Results of qPCR analysis confirmed the bioinformatic analysis, validating the expression of the 11 feature genes in the rat ICM model.
Conclusion: We identified two ferroptosis-related clusters in ICM patients and developed a predictive signature based on ferroptosis-related genes. Our findings highlight the importance of ferroptosis in ICM and offer new insights for its diagnosis and treatment.
Keywords: ischemic cardiomyopathy, ferroptosis, bioinformatics analysis, predictive signature
Introduction
Heart disease is the leading cause of death worldwide. Ischemic cardiomyopathy (ICM), primarily attributed to coronary artery disease, stands as the most prevalent form of heart disease.1 Recent advancements in the management of cardiovascular risk factors and acute coronary syndromes have led to improved survival rates among patients with coronary artery disease. Nevertheless, this has also resulted in a substantial number of individuals, specifically 15.5 million patients in the United States, being affected by ICM. Ischemic cardiomyopathy (ICM) is a disease characterized by high risk and fatality, exhibiting a mortality rate of approximately 62.5% after a follow-up period of 9.8 years, despite the implementation of guideline-directed optimal medical therapy.2 The depletion of terminally differentiated, fully functional cardiomyocytes plays a pivotal role in the progression of this cardiomyopathy, which is associated with a grim prognosis. Extensive research has been conducted to investigate the intricate involvement of various forms of regulated cell death including apoptosis, necroptosis, pyroptosis, and autophagy in the pathogenesis of ischemic cardiomyopathy.3 Nevertheless, the role of ferroptosis in ischemic cardiomyopathy is underrecognized, and its importance is underestimated, requiring further exploration.
Ferroptosis is a newly identified iron-dependent regulated cell death that can be provoked by iron overload. Trivalent iron produced by the Fenton reaction initiates lipoxygenase, or the inhibition of System x- by extracellular glutamate overload inhibits GPX4, ultimately leading to the failure of lipid peroxidation inhibition.4 Recent studies provide evidence for the significant role of ferroptosis in both the ischemic and reperfusion stages of myocardial injury.5,6 Iron, possessing redox properties that contribute to the generation of free radicals, serves as a crucial molecular and metabolic catalyst for ferroptosis. Iron deposition in the peri-infarct myocardium of STEMI patients is a risk factor for post-infarction inflammatory response and adverse left ventricular remodeling. Currently, the most effective approach to address ischemic injury of the myocardium involves restoring blood flow, a process commonly referred to as reperfusion. However, it is worth noting that reperfusion itself can give rise to ischemia/reperfusion injury, which contributes to approximately 50% of the final myocardial infarct area.7 During ischemia and the initial stages of reperfusion, there is an elevation in iron deposition and reactive oxygen species (ROS) within cardiomyocytes located in close proximity to the infarcted region. This indicates that ferroptosis takes a significant part in the loss of cardiomyocytes during this process. Ferroptosis inhibitors, such as ferrostatin-1 and iron chelation, ameliorate heart failure induced by acute and chronic I/R in mice.8
As previously discussed, due to the substantial influence of ferroptosis in different phases of myocardial ischemia, the manipulation of ferroptosis process has the potential to function as a comprehensive approach for hindering or slowing down the initiation and advancement of ischemic cardiomyopathy (ICM).
The objective of this study was to delineate distinct functional clusters in patients diagnosed with ischemic cardiomyopathy (ICM) and to establish a predictive signature through an extensive analysis of ferroptosis-related genes (FRGs). We conducted a comprehensive examination of differentially expressed FRGs (DEFRGs) in ICM patients utilizing both FerrDb and GEO databases. By utilizing consensus clustering analysis based on DEFRGs, we successfully categorized ICM patients into two distinct clusters with unique molecular profiles. Furthermore, we developed a robust predictive model for ICM using DEFRGs, which was subsequently validated externally. Noteworthy is the fact that this study represents the first instance of patient classification and predictive signature construction for ICM based on FRG expression profiles.
Materials and Methods
Data Acquisition and Differential Expression Analysis
Datasets from the Gene Expression Omnibus (GEO) database (http://www.ncbi.nlm.nih.gov/geo) that contain human ICM and controlled myocardial sample expression profiles were retrieved. The two largest datasets, GSE57338 and GSE5406, were selected as the training and validation sets, respectively, with GSE57338 encompassing 95 ICM and 136 control samples, and GSE5406 comprising 108 ICM and 16 control samples.9,10 Gene probes were converted into gene symbols based on annotation data from GPL11532 and GPL96, respectively.
CEL files for GSE57338 were obtained from the GEO database and then subjected to background correction, quantile normalization, and summarization using the robust multi-chip average (RMA) function in the oligo package.11 Batch effects between samples were corrected using the Combat function in the SVA package, and the correction results were verified using principal component analysis.12 The limma algorithm was employed to analyze differentially expressed genes (DEGs) with | log(fold change) | ≥ 0.5 and FDR-adjusted p < 0.05.13 A total of 259 FRGs, including drivers, suppressors, and markers, were sourced from the FerrDb database, which is the world’s first comprehensive repository dedicated to FRGs.14 DEFRGs were defined as the intersection between DEGs and FRGs.
Functional Enrichment Analysis
We used the “clusterProfiler” R package to conduct functional enrichment analyses of Gene Ontology (GO) and Kyoto Encyclopedia of Genes and Genomes (KEGG) to elucidate the functions of DEFRGs.15 GO enrichment analysis of the DEFRGs was carried out to identify and categorize enriched biological processes (BP), cellular components (CC), and molecular functions (MF). Prediction of involved signaling pathways was carried out using KEGG enrichment analysis. Determination of significance for enrichment was based on a P-value < 0.05. Scatter plots and chord diagrams were accomplished using the ggplot2 package (version 3.3.6) in the R software.
Construction of Transcription Factor Network and LncRNA-miRNA-mRNA Network
The downstream targets or upstream regulatory factors in DEFRG, along with their regulatory directions, were obtained from the TRRUST database. The visualization of the regulatory network was accomplished using Cytoscape software (version 3.9.1). The ceRNA regulatory network can unveil the crosstalk between protein-coding transcripts and non-coding transcripts, revealing novel therapeutic targets. Based on DEFRG, miRNAs of DEFRG were selected using the miRtarBase, miRDB, and StarBase databases. The intersection of predictions from these three databases served as potential candidate miRNAs. Furthermore, candidate miRNAs were intersected with data from the StarBase and LncACTdb databases to filter potential candidate lncRNAs. Finally, the lncRNA-miRNA-mRNA regulatory network was constructed.
Consensus Clustering Analysis
Firstly, we extracted the DEFRGs from the transcriptome data of GSE57338. Subsequently, we performed consensus clustering analysis using the ConsensusClusterPlus package in R. The analysis involved 1000 repetitions with the Euclidean distance metric and the PAM (Partitioning Around Medoids) clustering algorithm. To determine the optimal number of clusters, we meticulously examined the Cumulative Distribution Function (CDF) curve generated by ConsensusClusterPlus, aiming to identify the most suitable grouping for disease samples. Next, we applied the clustering results to the samples, segregating them into distinct groups. To further validate the clustering effectiveness, we conducted Principal Component Analysis (PCA) on the sample data for dimensionality reduction. We then created a scatter plot to visually demonstrate the consistency of the clustering results. This analytical approach allowed us to identify sample groups with similar expression patterns of DEFRG in ICM samples. Following this, we categorized the samples based on clusters and subsequently analyzed the differential expression of FRGs between these clusters. We set the threshold criteria as a log2-fold change greater than 0.5 and an adjusted p-value less than 0.05. We generated a differential expression heatmap for the FRGs, providing a visual representation of their expression patterns across clusters. Additionally, we created box plots to further illustrate the distribution of FRG expression levels within each cluster. This comprehensive analysis allowed us to discern significant expression differences among the clusters, shedding light on potential molecular mechanisms underlying this phenomenon.
Differential Gene Expression and Enrichment Analysis Between Clusters
To assess the correlation between clusters and specific biological processes, we conducted differential gene expression analysis by utilizing the R package limma with threshold |log2FC| > 0.5 and adjusted p < 0.05. Subsequently, an interaction network of GO terms and KEGG terms was constructed using the Cytoscape ClueGO plugin. To evaluate the metabolic characteristics between ferroptosis subtypes, the R package GSVA was utilized to evaluate enrichment scores for metabolism-related biological processes or pathways.
Construction and Verification of Predictive Signature for ICM
Based on the DEFRGs between disease and normal samples, the ICM predictive signature was constructed using the least absolute shrinkage and selection operator (LASSO) regression analysis implemented in the “glmnet” package. The risk score of the ICM predictive signature was calculated based on the coefficients (β) as follows:

The risk score for each sample was computed, and all samples were stratified into high-risk and low-risk groups based on the median risk score. Differential expression of DEFRGs between high- and low-risk groups was compared and visualized using a heatmap. Receiver Operating Characteristic (ROC) curves were generated based on the risk scores of patients in the GSE57338 dataset, and the area under the curve (AUC) was calculated to evaluate predictive performance. To further validate the robustness of the model, the GSE5406 dataset was employed for external validation, assessing the model’s ability to discriminate between normal and ICM patients based on risk scores.
Differential Gene Expression and GSEA Enrichment Analysis Between High- and Low-Risk Subgroups
Differential gene expression analysis between high- and low-risk groups, including ferroptosis-related genes, was conducted using the “limma” package with threshold |log2FC| > 0.5 and adj.p < 0.05. Subsequently, GSEA (Gene Set Enrichment Analysis) was employed to investigate the distinct biological processes and signaling pathways between these groups. The results were visualized using either the “gseaplot2” package or the GSEA software.
Estimation of Immune Infiltration
CIBERSORT facilitates the estimation of immune cell infiltrations, providing a valuable means to comprehensively assess the cellular composition of complex tissues. This method has been validated through in silico simulations and cytometry immunophenotyping. In our study, CIBERSORT was applied to the dataset to estimate the proportions of infiltrated cells. Subsequently, we conducted an analysis to discern differences in infiltrated cells between high-risk and low-risk groups. Notably, cells exhibiting a p-value < 0.05 were considered statistically significant in our investigation.
Rat ICM Model Establishment and Validation
In accordance with NIH Guidelines for the Care and Use of Experimental Animals, all animal studies were approved by Fuwai Hospital’s Experimental Animal Ethics Committee. Animals were randomly assigned to two groups: the Sham group and the ICM group. Anesthesia was induced by injecting pentobarbital sodium (50 mg/kg) intraperitoneally into male SD rats weighing 200–220 g before surgery. As previously mentioned, the left anterior descending coronary artery was ligated to induce ICM.16 Sham rats underwent identical procedures except they were not ligated at the left anterior descending coronary artery. Postoperative analgesia was provided with ibuprofen for a week following the surgery.17
The Vevo 2200 system was used to perform transthoracic two-dimensional M-mode echocardiography to evaluate cardiac function at the baseline (3 days after MI) and at endpoint (8 weeks after MI). Left ventricular wall thickness and left ventricular inner diameter were measured in systole and diastole. Left ventricular ejection fraction (LVEF), fractional shortening (FS), left ventricular end-diastolic volume (LVEDV), and left ventricular end-systolic volume (LVESV) at baseline and endpoint were calculated. Rats with left ventricular ejection fraction (LVEF) above 60% at 3 days after AMI were excluded from the study.
Histological Analysis
After endpoint echocardiography measurements were recorded, animals were anesthetized with isoflurane for heart harvesting. After 48 hours of fixing in 4% paraformaldehyde, the hearts were embedded in paraffin, and serially cut into 5 μm-thick sections. Infarct size and collagen area in left ventricle was quantified using Masson’s Trichrome stain and Sirius Red stain.
Quantitative Real-Time-Polymerase Chain Reaction (qRT-PCR)
Trizol reagent (Life Technologies) was utilized to extract total RNA from heart tissues. Reverse transcription of mRNAs was performed using the PrimeScript™ 1st Strand cDNA Synthesis Kit from Takara. PowerUp™ SYBR™ Green Master Mix (Applied Biosystem) was used for conducting all quantitative real-time PCR tests on a QuantStudio 3 Real-Time PCR system (Applied Biosystem). The mRNA level of the gene was normalized to GAPDH using the comparative 2−ΔΔCt methods. Sangon Biotech synthesized all mRNA primer sequences and all sequences were listed in Supplementary Table 1.
Results
Identification and Functional Annotation of DEFRGs in ICM
Figure 1 displays the depicted flow chart for this study. To identify differentially expressed genes (DEGs) of ischemic cardiomyopathy, we performed differential expression analysis in GSE57338 gene set which comprising of 95 failing hearts (ischemic cardiomyopathy group) and 136 normal cardiac tissues (control group). Afterward, we discovered 412 differentially expressed genes (DEGs) with |log(fold change) | ≥ 0.5, FDR adjusted p < 0.05 (Supplementary Table 2). The FerrDb database yielded a total of 259 FRGs, with 237 FRGs being present in the microarray data of GSE57338. DEFRGs were determined as the genes shared by both DEGs and FRGs. As a result, we discovered a total of 15 DEFRGs, with 4 upregulation and 11 downregulation (Figure 2A and B). The upregulated genes include ARRDC3, IL33, ENPP2, and RGS4, while the downregulated genes include PLIN2, TXNRD1, ARNTL, LPCAT3, STAT3, STEAP3, SLC2A1, NQO1, NNMT, CYBB, and ALOX5 (Figure 2A and B). In order to explore the possibly significant roles of DEFRGs, BP, and KEGG pathway analysis was performed. The GO analyses showed that DEFRGs were linked to cellular reactions to chemical stress, regulation of angiogenesis, and control of blood vessel development (Figure 2C). Furthermore, DEFRGs were significantly enriched in the HIF-1 signaling pathway, cellular necroptosis, and the adipocytokine signaling pathway according to the KEGG analysis (Figure 2D).
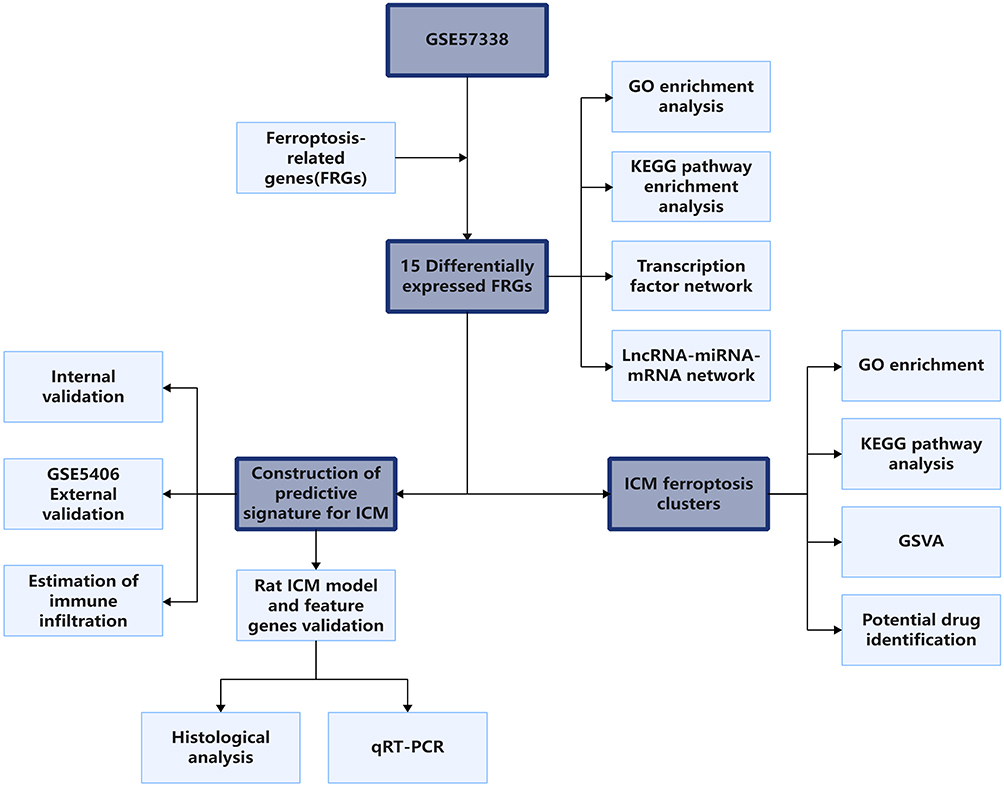 |
Figure 1 The schematic workflow of this study. |
 |
Figure 2 Differential expression analysis and functional enrichment analysis of DEFRGs. (A) The volcano plot illustrating the log2 (fold change) and adjusted P values of differentially expressed FRGs (DEFRGs), with labeled gene symbols. (B) The heatmap displaying the expression levels of DEFRGs between the ICM group and the control group. (C) GO enrichment analysis revealing the biological processes associated with DEFRGs. (D) The chord diagram presenting the KEGG pathway analysis for DEFRGs. |
DERG Transcription Factor Regulatory Network and LncRNA-miRNA-mRNA Network
Dysfunction in transcription regulators and their corresponding targets can result in diseases, and exploring the interactions between transcription regulators and targets can aid in comprehending the regulatory connections underlying the intricate characteristics of ischemic cardiomyopathy. Hence, we aimed to study the regulatory network of transcription factors in DEFRGs. The TRRUST database is a compilation of transcription factor regulatory networks supported by experimental evidence.18 In the transcription factor regulatory network of DEFRGs predicted by the TRRUST database, the orange nodes represent DEFRGs, while the blue nodes represent transcription factors that interact with DEFRGs (Figure 3A). Evidence of interactions between DEFRGs and transcription factors was also demonstrated (activation or repression or unknown) (Figure 3A). We also construct the LncRNA-miRNA-mRNA (DEFRG) regulatory network in order to explore the interaction between protein coding transcripts and non-coding transcripts and then identify potential therapeutic targets. As shown in Figure 3B, the LncRNA-miRNA-mRNA network contains 14 lncRNA, 49 miRNA, and 14 mRNA.
 |
Figure 3 Establishment of the transcription factor regulatory network and the lncRNA-miRNA-mRNA network using 15 identified DEFRGs. (A) The transcription factor regulatory network of DEFRGs was constructed using data sourced from the TRRUST database. Interactions between transcription factors and their targets were depicted using green lines (representing repression) or purple lines (representing activation) or gray lines (representing unknown). (B) The Sankey diagram depicting the lncRNA-miRNA-mRNA network. |
Identification of Patient Clusters Based on Heterogeneously Expressed FRGs
Next, we performed consensus clustering of ischemic cardiomyopathy samples based on the DEFRGs in the GSE57338. Results shown that the clustering had the best stability when k = 2 (Figure 4A and B). With k equal to 2, the cumulative distribution function plot showed the least amount of variation (Figure 4B), while the consensus matrix heatmap revealed well-defined boundaries (Figure 4A). Therefore, we classified the ischemic cardiomyopathy samples into two clusters. The clusters exhibited notable differences in the expression patterns, as revealed by the principal component analysis (PCA) (Figure 4C). Heatmap of gene expression revealed the differential expression characteristics of ferroptosis-related genes between clusters (Figure 4D). As shown in Figure 4D, all differentially expressed genes were significantly up-regulated in cluster 2.
 |
Figure 4 Consensus clustering analysis stratified patients into two clusters based on DEFRGs (A) Consensus matrix of ICM samples when k = 2. (B) Consensus CDF curve when k = 2–5. (C) Principal component analysis (PCA) showing distinct expression patterns of these two clusters. (D) Heatmap showing FRGs expression level between 2 clusters. ****p < 0.0001. ***p < 0.001. **p < 0.01. |
Functional Enrichment Analysis of Clusters
Next, we investigated whether each cluster exhibited distinct functional features. Based on all significantly differentially expressed genes among two clusters (Supplementary Table 3), GO and KEGG enrichment analysis were carried out using the ClueGO plugin of Cytoscape software. GO results showed that these genes were closely associated with icosanoid biosynthetic process, cardiac muscle tissue growth, regulation of chemokine production, and so on (Figure 5A). As for KEGG analysis, major pathways in which differentially expressed genes enriched were arachidonic acid metabolism, NF-kappa B signaling pathway, ECM-receptor interactions signaling pathways (Figure 5B).
 |
Figure 5 Functional enrichment analysis based on differential expressed genes between 2 clusters. (A and B) GO and KEGG enrichment analysis using the ClueGO plugin of Cytoscape software. (C) Gene Set Variation Analysis (GSVA) in terms of metabolic signaling signatures between 2 clusters. The color bar showed the GSVA score in each sample. ****p < 0.0001. ***p < 0.001. **p < 0.01. *p < 0.05. |
Next, we analyzed the enriched metabolic-related KEGG pathways utilizing the “GSVA” R package, and the results indicated that these two clusters exhibited distinct metabolism signatures. Purine metabolism, pyrimidine metabolism, tryptophan metabolism, fatty acid metabolism, and glycerophospholipid metabolism were upregulated in cluster 1, while cluster 2 had a higher score in the metabolism of xenobiotics by cytochrome P450 pathway, ether lipid metabolism, arachidonic and metabolism, and linoleic acid metabolism (Figure 5C).
Identification of Pivotal Candidate Drugs
Differential expressed genes between clusters were filtered using the “limma” package with criteria of |log2FC| > 0.5 and adj.p < 0.05. Interactions between differential expressed genes were analyzed using the STRING database (Figure 6A). Subsequently, the top 10 interacting genes were obtained using the MCC algorithm in the CytoHubba plugin in Cytoscape (Figure 6B). Then, the top 10 genes were utilized to find potential drugs based on gene-drug interactions in the DGldb database. Among the top 10 genes, C3AR3, CD86, CSF1R, CYBB, ITGB2, PTPRC, and TLR4 had interactions with drugs in the DGldb database, and the remaining three genes had no interactions with drugs in the database (Figure 6C). These drugs are likely to be potential target therapeutic methods for the two patient clusters.
 |
Figure 6 Hub gene selection and interactions between hub genes and drugs. (A) PPI network of all differential expressed genes between clusters. (B) PPI network of top 10 genes obtained by MCC algorithm in CytoHubba plugin in Cytoscape. (C) Interactions between top 10 genes and drugs. |
Construction and Validation of the ICM Predictive Signature
Aforementioned results demonstrated that there was a strong correlation between ferroptosis and ICM. Based on the DEFRGs between the ICM group and the control group, we attempted to develop a robust predictive signature for the ICM. The LASSO regression analysis screened TXNRD1, STEAP3, STAT3, SCL2A1, PLIN2, NQO1, NNMT, IL33, ENPP2, ARRDC3, and ALOX5 as candidate genes of the ICM predictive signature, with the coefficients of −0.8187, −2.2434, −1.649, −0.1579, −0.9917, −0.5021, −0.7222, 0.487, 0.8844, 3.6806, and −0.3952, respectively (Figure 7A–C). Next, the risk score of each patient was calculated using this ICM predictive signature, and patients were divided into high-risk or low-risk groups based on the median risk score. Using receiver operating characteristic (ROC) curves, the signature was evaluated for predictive efficiency, and we found that the AUC of ROC curve in the training set were 0.9937 (Figure 7D–F). To further validate the robustness, we utilized the GSE5406 as the validation set and the AUC in the validation set was 0.9282 (Figure 7G–I). Thus, a ferroptosis-based ICM predictive signature was successfully developed.
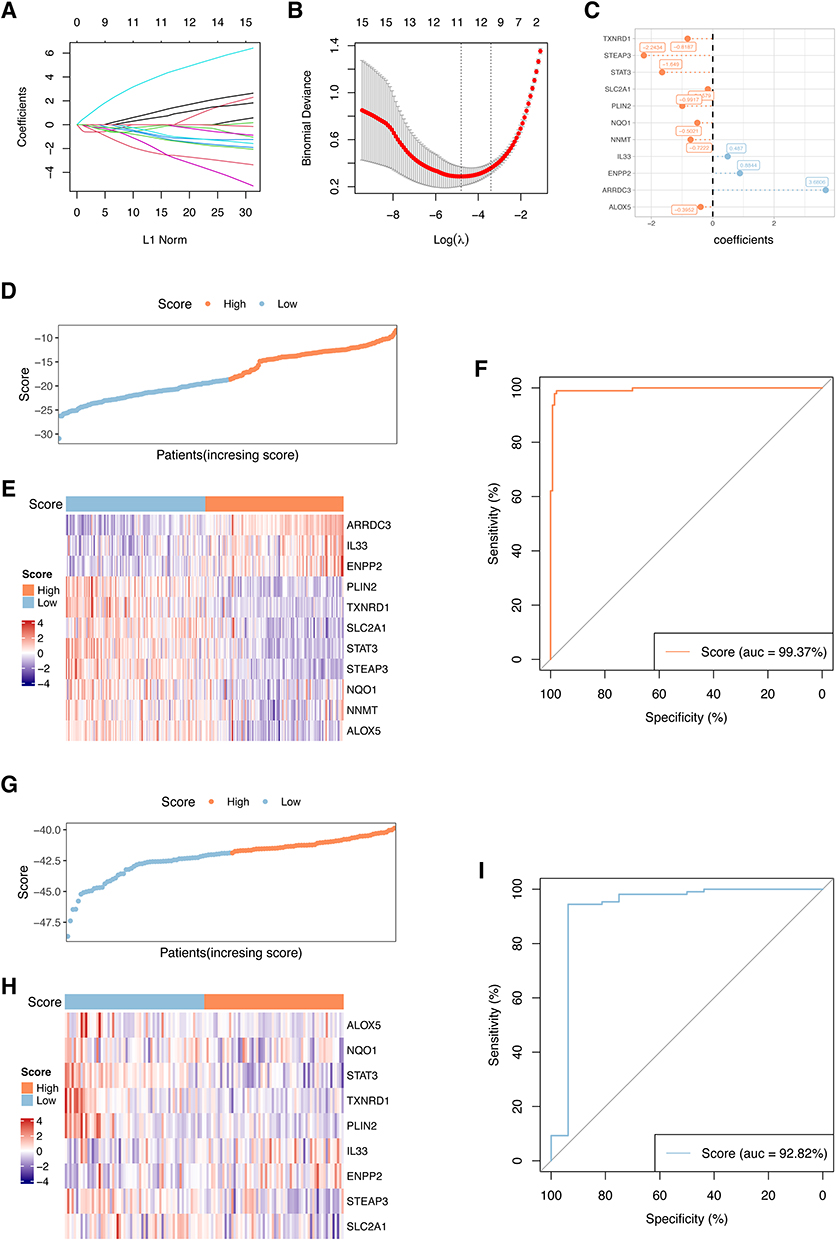 |
Figure 7 Establishment and validation of the ICM predictive signature. (A and B) ICM predictive signature was established base on 11 DEFRGs. The lambda.min was selected as the best lambda value of the model. (C) LASSO coefficients of candidate genes in ICM predictive signature. (D–F) Evaluating the performance of the signature in the training set, (G–I) Evaluating the performance of the signature in the validation set (GSE5406). The heatmaps showing gene expression of 11 genes in the predictive signature. Patients’ distribution based on the median risk score. ROC curves presenting the efficacy of the signature for predicting ICM in patients. Area under the ROC curve (AUC) was calculated and compared. |
Functional Annotation and Correlation of the Signature with Ferroptosis
By exploring differences between signaling pathways or biological process in high-risk and low-risk groups, we can find crucial signaling pathways correlated to the ICM and uncover potential targeted therapeutic approaches. Results of the GO analysis showed that extracellular matrix organization, collagen-containing extracellular matrix, and extracellular matrix structural constituent were enriched in high-risk groups (Figure 8A–C). In addition, there are also distinct differences in signaling pathways between the high-risk and low-risk groups. The epithelial mesenchymal transition, interferon alpha response, and interferon gamma response were found to be enriched in high-risk samples (Figure 8E). The infiltration percentages of 22 subpopulations of immune cells in the high-risk and low-risk groups were examined using the CIBERSORT algorithm. Furthermore, as depicted in Figure 9A, there were notable variations in the relative ratios of seven immune cell subcategories between the two groups. CD8+ T cells (p = 0.002), CD4+ naïve T cells (p = 0.027), M0 macrophages (p = 0.009), M1 macrophages (p = 0.00006), and resting mast cells (p = 0.000056) were upregulated in high-risk group, while regulatory T cells (p = 0.026), monocytes (p = 0.022) were upregulated in low-risk groups (Figure 9A). Furthermore, we found that the expression of FRGs was significantly different between the high-risk and low-risk groups. Compared to low-risk group, LPACT3, STAT3, STEAP3, PLIN2, TXNRD1, SLC2A1, ALOX5, RGS4, CDKN1A, ARNTL were downregulated in high-risk groups, while ARRDC3, SLC40A1, ENPP2, IL33, CXCL2 were upregulated (Figure 9B).
 |
Figure 8 Association of the model with involved function. (A–D) GSEA showing the involved function of high-risk and low-risk groups in terms of the biological processes (A), cellular components (B) and molecular functions (C) and Hallmark signaling pathway (D). Terms with p < 0.05 and FDR q < 0.25 were considered statistically significant. |
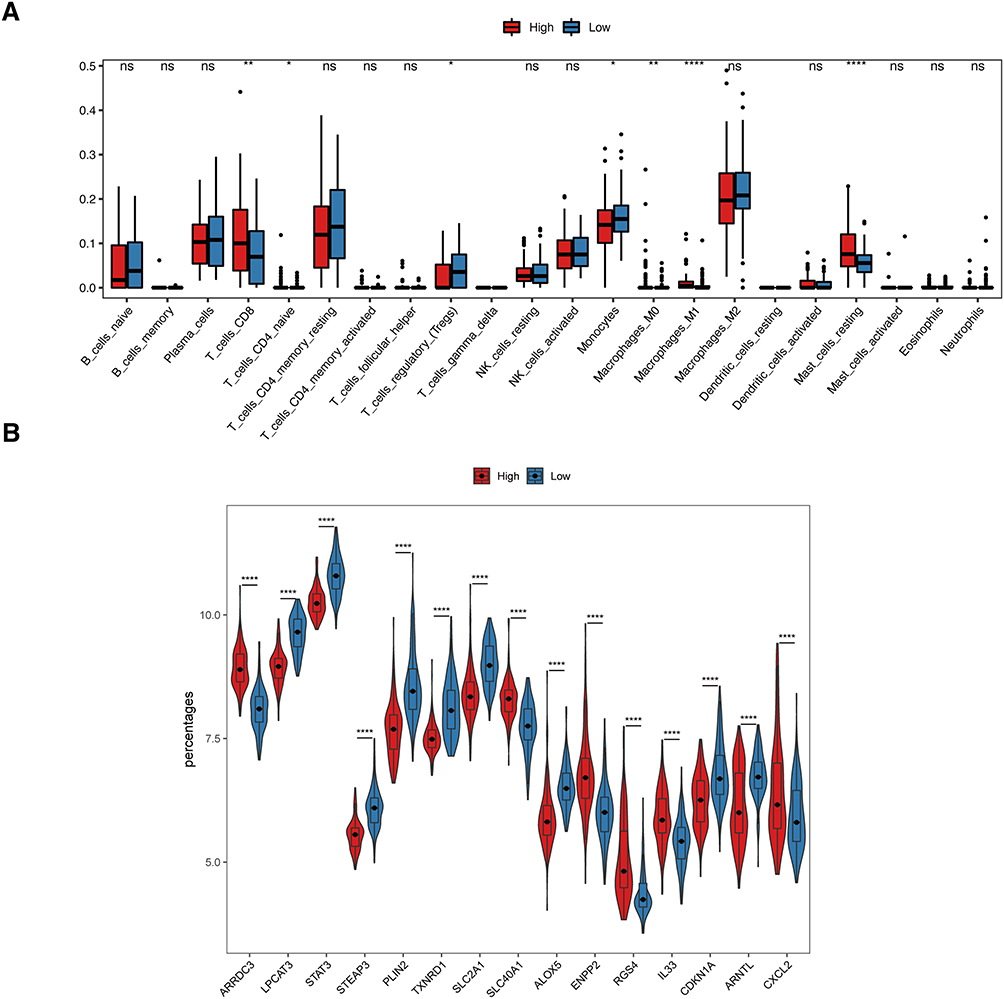 |
Figure 9 Association of the model with immune cell infiltration and ferroptosis. (A) Differences of immune cell infiltration between low-risk and high-risk groups, estimated by the CIBERSORT algorithm. (B) Gene expression of ferroptosis related genes between low-risk and high-risk groups. ****p < 0.0001. **p < 0.01. *p < 0.05. |
ICM Rat Model Construction and Feature Genes Validation
In the ICM and sham groups, LVEF, LVFS, LVEDV, and LVESV were determined by M-mode ultrasonography following surgery. The ICM group had significantly lower LVFS and LVEF as well as higher LVEDV and LVESV as compared to the sham group (Figure 10A and B, Supplementary Table 4). In addition, histological analysis showed that the infarct size and collagen area were markedly higher in the ICM group (Figure 10C–F and Supplementary Table 4), indicating the successful establishment of an ICM rat model. mRNA expression levels of genes of ICM predictive signature were validated in ICM hearts. Results shown that TXNRD1, STEAP3, STAT3, SCL2A1, PLIN2, NQO1, NNMT, and ALOX5 were significantly down-regulated in the ICM group, while ARRDC3, ENPP2, and IL33 were notably upregulated (Figure 10G and Supplementary Table 5).
 |
Figure 10 ICM rat model construction and feature genes validation. (A) Representative echocardiography images of sham group and ICM group 8 weeks after the cardiac surgery. (B) Comparison of LVEF, LVFS, LVEDV and LVESV in the two groups (n=7). (C and E) Representative images of heart cross-sections stained with Masson’s trichrome staining (C) and Sirius Red staining (E) 8 weeks after MI. Scale bar = 2000 μm. (D and F) Quantification of infarct size in (C and D) and collagen area in (E and F) (n=7). (G) mRNA expression levels of 11 feature genes of ICM predictive signature in cardiac tissues (n=6). All data are presented as mean±SEM. Statistical analysis was performed with using Student’s t test. ****p < 0.0001. ***p < 0.001. **p < 0.01. *p < 0.05. |
Discussion
Heart failure (HF) is a global disease with increasing morbidity that poses a significant threat to human health.19 Ischemic heart disease is the most common cause of HF with decreased ejection fraction as well as the most important factor leading to the increasing global incidence rate of HF.20,21 The mechanism of ischemic heart disease leading to heart failure is the development of left ventricular systolic dysfunction, usually caused by previous acute myocardial infarction, or a hidden process of gradual decline in systolic function in the absence of acute coronary syndrome. Ischemic cardiomyopathy (ICM) is commonly employed to describe the condition of heart failure caused by the combination of notable impairment in left ventricular systolic function and severe coronary artery disease.22,23 Despite the continuous innovation and improvement of effective treatment methods, the prognosis of heart failure remains unsatisfactory.24,25 The high energy metabolism and iron dependence of the heart make heart tissue more vulnerable to ferroptosis.26 It has been reported that chronic heart failure was commonly associated with iron deficiency.27,28 In the development and occurrence of heart failure due to several conditions, such as myocardial infarction or cardiomyopathy, ferritin deposition is thought to play an important pathophysiology role.3 Therefore, the understanding of mechanisms of ferroptosis is essential to exploration of treatments for heart failure.
Ferroptosis was recognized as an iron-dependent form of cell death, which differs from other forms of regulated cell death, such as necrosis, apoptosis, or autophagy and has distinct morphology, biochemistry, genetics, and immunology.29,30 Both increased lipid reactive oxygen species (ROS) and iron accumulation are crucial for controlling the ferroptosis process.30 We found that all DEFRGs in ischemic cardiomyopathy significantly enriched in positive regulation of inflammatory factor production, regulation of angiogenesis, and HIF-1 signaling pathways. HIF-1 participates in the regulation of angiogenesis and plays a critical protective role in the pathophysiology of ischemic heart disease.31 Regulation of angiogenesis in ischemic myocardium is a critical process of post-ischemic cardiac repair.32 It was reported that HIF-1 signaling pathways played a role in ferroptosis under hypoxia conditions.33 Angiogenesis also correlated to inhibition of ferroptosis.34–36 These results imply that DEFRGs participate in the progression of ischemic cardiomyopathy. Furthermore, several ncRNAs, including miRNAs and lncRNAs, have been shown to be key regulators of ferroptosis.37 As a result, they play a role in ferroptosis by regulating the metabolisms of iron, ROS, and ferroptosis-related amino acids.38 Thus, the transcription factor regulatory network and lncRNA-miRNA-mRNA network which we constructed providing potential candidate biomarkers related to ischemic cardiomyopathy.
Consensus clustering is an unsupervised approach to identify subtypes based on gene expression profiles.39 In this study, to identify clusters of ischemic cardiomyopathy associated with the ferroptosis process, we established two clusters of ischemic cardiomyopathy based on ferroptosis gene expression. We explored the ferroptosis gene expression profile, functional characteristics, and metabolism features of each cluster. The results showed that each cluster exhibited specific ferroptosis and metabolism features. There is a significant difference in the expression of FRG between the two clusters. And differentially expressed FRGs were all highly-expressed in cluster 2. Most of these genes and their role in ferroptosis or cardiovascular disease have been reported in previous studies. Higher levels of TLR4, NOX4, ALOX5, SAT1, PTGS2, CYBB have been reported related to induction and promotion of ferroptosis.40–47 Elevated levels of TGFBR1 can promote cardiac fibrosis after myocardial infarction.48 NCF2 were higher in STEMI patients than that in stable CAD patients, suggesting that NCF2 may be associated with more severe disease states as well as higher levels of inflammation.49 RGS4 were also found to be involved in cardiac fibrosis.50 Inhibition of CYBB may be involved in the reduction of myocardial infarct size as well as restoration of cardiac function after myocardial ischemia-reperfusion injury,51 implying higher level of CYBB may be associated with worse outcomes. Elevated AKR1C3 suggests possible acute myocardial infarction and may be a diagnostic marker for acute myocardial infarction.52 It seems that most of the FRG highly expressed in cluster 2 are associated with higher levels of ferroptosis as well as malignant progression of heart disease. Furthermore, GSVA results showed that differential expression genes between two clusters are enriched in the NF-kB pathway, indicating that there may be distinct discrepancy in inflammation levels between clusters.
In light of the close association between ischemic cardiomyopathy and ferroptosis, we developed a ferroptosis-related model for predicting ischemic cardiomyopathy. The model demonstrated resilience in forecasting ischemic cardiomyopathy in both the training and validation sets. In high-risk patients, our findings indicated enriched inflammatory signaling pathway such as interferon alpha response and interferon gamma response. For immune cell infiltration analysis, we found increased infiltration of M0 macrophages, M1 macrophages, CD8+ T lymphocytes, CD4+ T naive cells, and resting mast cells, while lower infiltration of Treg cells and monocytes were exhibited in high-risk patients. Previous studies have reported that the aggravation of CD8+T cell infiltration may contribute to adverse left ventricular remodeling after myocardial infarction.53 Myocardial infarction patients with elevated cytotoxic CD8+CD57+ T cells have poor prognoses.54 Also, CD4+ T-cells were reported to be participating in aggravating ischemia-reperfusion injury.55 Higher levels of M1 macrophages infiltration were identified to be associated with ventricular dysfunction.56 Previous studies have reported that MI patients were related to lower levels of Treg cells and decreased circulating Treg cells were associated with a higher MI risk.57,58 Thus, our findings of immune cell infiltration indicated that individuals with elevated risks of ischemic cardiomyopathy might encounter increased inflammation infiltration and exhibit poorer prognosis.
Limitations
There are several noteworthy limitations to consider in this study. Firstly, while the predictive model based on ferroptosis-related genes showed promising results, its application in a clinical setting would benefit from integrating gene signatures with clinical factors such as patient demographics, comorbidities, and other biomarkers. This integration would likely enhance the model’s predictive accuracy and clinical utility. Secondly, the model requires further validation using more datasets and clinical samples to assess its robustness and ensure its applicability across different patient populations.
Conclusion
In the present study, a total of 15 differentially expressed functional regulatory genes (DEFRGs) were identified in the context of ischemic cardiomyopathy. Also, a transcription factor regulatory network and a lncRNA-miRNA-mRNA network were constructed based on these DEFRGs. Additionally, we stratified ICM patients into two clusters based on DEFRGs with distinct expression patterns and explored corresponding potential drug. In addition, through the utilization of bioinformatics analysis, we constructed an ICM predictive signature containing 11 DEFRGs and ROC curve effectively illustrated their strong efficacy. Furthermore, the validation in an ICM rat model confirmed the 11 feature genes, supporting their potential as predictive signature for ICM diagnosis. Thus, these results provided an insight into characterization of ferroptosis in the ICM.
Ethics Approval and Consent to Participate
This study was conducted in accordance with the principles of the Declaration of Helsinki. The study was also reviewed and approved by the Ethics Committee of Fuwai Hospital. The research utilized publicly available data from the GEO database, which includes patient data with informed consent. Additionally, all animal experiments were conducted in accordance with the ethical standards and were approved by the Experimental Animals Ethics Committee of Fuwai Hospital (FW-2022-0032).
Funding
This project was supported by grants from the Capital’s Funds for Health Improvement and Research (CFH 2022-1-2062).
Disclosure
The authors declare that they have no competing interests.
References
1. Anderson JL, Morrow DA. Acute myocardial infarction. N Engl J Med. 2017;376(21):2053–2064. doi:10.1056/NEJMra1606915
2. Velazquez EJ, Lee KL, Jones RH, et al. Coronary-artery bypass surgery in patients with ischemic cardiomyopathy. N Engl J Med. 2016;374(16):1511–1520. doi:10.1056/NEJMoa1602001
3. Del Re DP, Amgalan D, Linkermann A, Liu Q, Kitsis RN. Fundamental mechanisms of regulated cell death and implications for heart disease. Physiol Rev. 2019;99(4):1765–1817. doi:10.1152/physrev.00022.2018
4. Li D, Pi W, Sun Z, Liu X, Jiang J. Ferroptosis and its role in cardiomyopathy. Biomed Pharmacother. 2022;153:113279. doi:10.1016/j.biopha.2022.113279
5. Ma XH, Liu JH, Liu CY, et al. ALOX15-launched PUFA-phospholipids peroxidation increases the susceptibility of ferroptosis in ischemia-induced myocardial damage. Signal Transduct Target Ther. 2022;7(1):288. doi:10.1038/s41392-022-01090-z
6. Park TJ, Park JH, Lee GS, et al. Quantitative proteomic analyses reveal that GPX4 downregulation during myocardial infarction contributes to ferroptosis in cardiomyocytes. Cell Death Dis. 2019;10(11):835. doi:10.1038/s41419-019-2061-8
7. Fan X, Li A, Yan Z, et al. From iron metabolism to ferroptosis: Pathologic changes in coronary heart disease. Oxid Med Cell Longev. 2022;2022:6291889. doi:10.1155/2022/6291889
8. Fang X, Wang H, Han D, et al. Ferroptosis as a target for protection against cardiomyopathy. Proc Natl Acad Sci U S A. 2019;116(7):2672–2680. doi:10.1073/pnas.1821022116
9. Hannenhalli S, Putt ME, Gilmore JM, et al. Transcriptional genomics associates FOX transcription factors with human heart failure. Circulation. 2006;114(12):1269–1276. doi:10.1161/CIRCULATIONAHA.106.632430
10. Liu Y, Morley M, Brandimarto J, et al. RNA-Seq identifies novel myocardial gene expression signatures of heart failure. Genomics. 2015;105(2):83–89. doi:10.1016/j.ygeno.2014.12.002
11. Carvalho BS, Irizarry RA. A framework for oligonucleotide microarray preprocessing. Bioinfo. 2010;26(19):2363–2367. doi:10.1093/bioinformatics/btq431
12. Leek J. sva: Surrogate variable analysis. R package version 3.26. 0. Bioconductor. 2019;9
13. Ritchie ME, Phipson B, Wu D, et al. limma powers differential expression analyses for RNA-sequencing and microarray studies. Nucleic Acids Res. 2015;43(7):e47–e. doi:10.1093/nar/gkv007
14. Zhou N, Yuan X, Du Q, et al. FerrDb V2: Update of the manually curated database of ferroptosis regulators and ferroptosis-disease associations. Nucleic Acids Res. 2023;51(D1):D571–D82. doi:10.1093/nar/gkac935
15. Yu G, Wang LG, Han Y, He QY. clusterProfiler: An R package for comparing biological themes among gene clusters. Omics. 2012;16(5):284–287. doi:10.1089/omi.2011.0118
16. Xiong Y, Tang R, Xu J, et al. Tongxinluo-pretreated mesenchymal stem cells facilitate cardiac repair via exosomal transfer of miR-146a-5p targeting IRAK1/NF-κB p65 pathway. Stem Cell Res Ther. 2022;13(1):289. doi:10.1186/s13287-022-02969-y
17. Tang R, Wang K, Xiong Y, Meng J, Yang Y. A fluorescence assay for evaluating the permeability of a cardiac microvascular endothelial barrier in a rat model of ischemia/reperfusion. J Vis Exp. 2021;172:e62746.
18. Han H, Cho JW, Lee S, et al. TRRUST v2: An expanded reference database of human and mouse transcriptional regulatory interactions. Nucleic Acids Res. 2018;46(D1):D380–d6. doi:10.1093/nar/gkx1013
19. Conrad N, Judge A, Tran J, et al. Temporal trends and patterns in heart failure incidence: A population-based study of 4 million individuals. Lancet. 2018;391(10120):572–580. doi:10.1016/S0140-6736(17)32520-5
20. Gheorghiade M, Sopko G, De Luca L, et al. Navigating the crossroads of coronary artery disease and heart failure. Circulation. 2006;114(11):1202–1213. doi:10.1161/CIRCULATIONAHA.106.623199
21. Moran AE, Forouzanfar MH, Roth GA, et al. The global burden of ischemic heart disease in 1990 and 2010: The global burden of disease 2010 study. Circulation. 2014;129(14):1493–1501. doi:10.1161/CIRCULATIONAHA.113.004046
22. Cabac-Pogorevici I, Muk B, Rustamova Y, Kalogeropoulos A, Tzeis S, Vardas P. Ischaemic cardiomyopathy. Pathophysiological insights, diagnostic management and the roles of revascularisation and device treatment. Gaps and dilemmas in the era of advanced technology. Eur J Heart Fail. 2020;22(5):789–799. doi:10.1002/ejhf.1747
23. Felker GM, Shaw LK, O’Connor CM. A standardized definition of ischemic cardiomyopathy for use in clinical research. J Am Coll Cardiol. 2002;39(2):210–218. doi:10.1016/S0735-1097(01)01738-7
24. Bui AL, Horwich TB, Fonarow GC. Epidemiology and risk profile of heart failure. Nat Rev Cardiol. 2011;8(1):30–41. doi:10.1038/nrcardio.2010.165
25. Johnson NB, Hayes LD, Brown K, Hoo EC, Ethier KA. CDC national health report: Leading causes of morbidity and mortality and associated behavioral risk and protective factors--United States, 2005–2013. MMWR Suppl. 2014;63(4):3–27.
26. Linder MC, Goode CA, Gonzalez R, Gottschling C, Gray J, Nagel GM. Heart tissue contains small and large aggregates of ferritin subunits. Arch Biochem Biophys. 1989;273(1):34–41. doi:10.1016/0003-9861(89)90159-8
27. Miñana G, Cardells I, Palau P, et al. Changes in myocardial iron content following administration of intravenous iron (myocardial-IRON): Study design. Clin Cardiol. 2018;41(6):729–735. doi:10.1002/clc.22956
28. Kozłowska B, Sochanowicz B, Kraj L, et al. Expression of iron metabolism proteins in patients with chronic heart failure. J Clin Med. 2022;11(3):837. doi:10.3390/jcm11030837
29. Stockwell BR, Friedmann Angeli JP, Bayir H, et al. Ferroptosis: A regulated cell death nexus linking metabolism, redox biology, and disease. Cell. 2017;171(2):273–285. doi:10.1016/j.cell.2017.09.021
30. Dixon SJ, Lemberg KM, Lamprecht MR, et al. Ferroptosis: An iron-dependent form of nonapoptotic cell death. Cell. 2012;149(5):1060–1072. doi:10.1016/j.cell.2012.03.042
31. Semenza GL. Hypoxia-inducible factor 1 and cardiovascular disease. Annu Rev Physiol. 2014;76:39–56. doi:10.1146/annurev-physiol-021113-170322
32. Sun J, Ge Y, Chao T, Bai R, Wang C. The role of miRNA in the regulation of angiogenesis in ischemic heart disease. Curr Probl Cardiol. 2023;48(6):101637. doi:10.1016/j.cpcardiol.2023.101637
33. Gao X, Hu W, Qian D, et al. The mechanisms of ferroptosis under hypoxia. Cell Mol Neurobiol. 2023;43(7):3329–3341. doi:10.1007/s10571-023-01388-8
34. Wang Y, Han J, Luo L, Kasim V, Wu S. Salidroside facilitates therapeutic angiogenesis in diabetic hindlimb ischemia by inhibiting ferroptosis. Biomed Pharmacother. 2023;159:114245. doi:10.1016/j.biopha.2023.114245
35. Liu CQ, Liu XY, Ouyang PW, et al. Ferrostatin-1 attenuates pathological angiogenesis in oxygen-induced retinopathy via inhibition of ferroptosis. Exp Eye Res. 2023;226:109347. doi:10.1016/j.exer.2022.109347
36. Wang J, Zhang Q, Chen E, Zhao P, Xu Y. Elabela promotes the retinal angiogenesis by inhibiting ferroptosis during the vaso-obliteration phase in mouse oxygen-induced retinopathy model. FASEB j. 2022;36(5):e22257. doi:10.1096/fj.202101785RRR
37. Zuo YB, Zhang YF, Zhang R, et al. Ferroptosis in cancer progression: Role of noncoding RNAs. Int J Biol Sci. 2022;18(5):1829–1843. doi:10.7150/ijbs.66917
38. Liu Y, Ding W, Wang J, Ao X, Xue J. Non-coding RNA-mediated modulation of ferroptosis in cardiovascular diseases. Biomed Pharmacother. 2023;164:114993. doi:10.1016/j.biopha.2023.114993
39. Wilkerson MD, Hayes DN. ConsensusClusterPlus: A class discovery tool with confidence assessments and item tracking. Bioinfo. 2010;26(12):1572–1573. doi:10.1093/bioinformatics/btq170
40. Wu L, Jia M, Xiao L, et al. TRIM-containing 44 aggravates cardiac hypertrophy via TLR4/NOX4-induced ferroptosis. J Mol Med. 2023;101(6):685–697. doi:10.1007/s00109-023-02318-3
41. Wu Z, Bai Y, Qi Y, et al. Metformin ameliorates ferroptosis in cardiac ischemia and reperfusion by reducing NOX4 expression via promoting AMPKα. Pharm Biol. 2023;61(1):886–896. doi:10.1080/13880209.2023.2212700
42. Park MW, Cha HW, Kim J, et al. NOX4 promotes ferroptosis of astrocytes by oxidative stress-induced lipid peroxidation via the impairment of mitochondrial metabolism in alzheimer’s diseases. Redox Biol. 2021;41:101947. doi:10.1016/j.redox.2021.101947
43. Song S, Su Z, Kon N, et al. ALOX5-mediated ferroptosis acts as a distinct cell death pathway upon oxidative stress in huntington’s disease. Genes Dev. 2023;37(5–6):204–217. doi:10.1101/gad.350211.122
44. Ou Y, Wang SJ, Li D, Chu B, Gu W. Activation of SAT1 engages polyamine metabolism with p53-mediated ferroptotic responses. Proc Natl Acad Sci U S A. 2016;113(44):E6806–e12. doi:10.1073/pnas.1607152113
45. Zhang T, Yang F, Dai X, et al. Role of caveolin-1 on the molybdenum and cadmium exposure induces pulmonary ferroptosis and fibrosis in the sheep. Environ Pollut. 2023;334:122207. doi:10.1016/j.envpol.2023.122207
46. Tang Q, Li J, Wang Y, Sun Q. Identification and verification of hub genes associated with ferroptosis in ischemia and reperfusion injury during renal transplantation. Int Immunopharmacol. 2023;120:110393. doi:10.1016/j.intimp.2023.110393
47. Deng W, Ai J, Zhang W, et al. Arginine methylation of HSPA8 by PRMT9 inhibits ferroptosis to accelerate hepatitis B virus-associated hepatocellular carcinoma progression. J Transl Med. 2023;21(1):625. doi:10.1186/s12967-023-04408-9
48. Chen G, Xu H, Xu T, et al. Calycosin reduces myocardial fibrosis and improves cardiac function in post-myocardial infarction mice by suppressing TGFBR1 signaling pathways. Phytomed. 2022;104:154277. doi:10.1016/j.phymed.2022.154277
49. Mo XG, Liu W, Yang Y, et al. NCF2, MYO1F, S1PR4, and FCN1 as potential noninvasive diagnostic biomarkers in patients with obstructive coronary artery: A weighted gene co-expression network analysis. J Cell Biochem. 2019;120(10):18219–18235. doi:10.1002/jcb.29128
50. Guo J, Hang P, Yu J, et al. The association between RGS4 and choline in cardiac fibrosis. Cell Commun Signal. 2021;19(1):46. doi:10.1186/s12964-020-00682-y
51. Gul-Kahraman K, Yilmaz-Bozoglan M, Sahna E. Physiological and pharmacological effects of melatonin on remote ischemic perconditioning after myocardial ischemia-reperfusion injury in rats: Role of Cybb, Fas, NfκB, Irisin signaling pathway. J Pineal Res. 2019;67(2):e12589. doi:10.1111/jpi.12589
52. Liang J, Cao Y, He M, et al. AKR1C3 and its transcription factor HOXB4 are promising diagnostic biomarkers for acute myocardial infarction. Front Cardiovasc Med. 2021;8:694238. doi:10.3389/fcvm.2021.694238
53. Zaidi Y, Corker A, Vasileva VY, et al. Chronic porphyromonas gingivalis lipopolysaccharide induces adverse myocardial infarction wound healing through activation of CD8(+) T cells. Am J Physiol Heart Circ Physiol. 2021;321(5):H948–h62. doi:10.1152/ajpheart.00082.2021
54. Yu H T, Youn JC, Lee J, et al. Characterization of CD8(+)CD57(+) T cells in patients with acute myocardial infarction. Cell Mol Immunol. 2015;12(4):466–473. doi:10.1038/cmi.2014.74
55. Yang Z, Day YJ, Toufektsian MC, et al. Myocardial infarct-sparing effect of adenosine A2A receptor activation is due to its action on CD4+ T lymphocytes. Circulation. 2006;114(19):2056–2064. doi:10.1161/CIRCULATIONAHA.106.649244
56. Peet C, Ivetic A, Bromage DI, Shah AM. Cardiac monocytes and macrophages after myocardial infarction. Cardiovasc Res. 2020;116(6):1101–1112. doi:10.1093/cvr/cvz336
57. Ghourbani Gazar S, Andalib A, Hashemi M, Rezaei A. CD4+Foxp3+ TREG and its ICOS+ subsets in patients with myocardial infarction. Iran J Immunol. 2012;9(1):53–60.
58. Wigren M, Björkbacka H, Andersson L, et al. Low levels of circulating CD4+FoxP3+ T cells are associated with an increased risk for development of myocardial infarction but not for stroke. Arterioscler Thromb Vasc Biol. 2012;32(8):2000–2004. doi:10.1161/ATVBAHA.112.251579
 © 2024 The Author(s). This work is published and licensed by Dove Medical Press Limited. The
full terms of this license are available at https://www.dovepress.com/terms.php
and incorporate the Creative Commons Attribution
- Non Commercial (unported, 3.0) License.
By accessing the work you hereby accept the Terms. Non-commercial uses of the work are permitted
without any further permission from Dove Medical Press Limited, provided the work is properly
attributed. For permission for commercial use of this work, please see paragraphs 4.2 and 5 of our Terms.
© 2024 The Author(s). This work is published and licensed by Dove Medical Press Limited. The
full terms of this license are available at https://www.dovepress.com/terms.php
and incorporate the Creative Commons Attribution
- Non Commercial (unported, 3.0) License.
By accessing the work you hereby accept the Terms. Non-commercial uses of the work are permitted
without any further permission from Dove Medical Press Limited, provided the work is properly
attributed. For permission for commercial use of this work, please see paragraphs 4.2 and 5 of our Terms.