")
Back to Journals » Clinical Ophthalmology » Volume 19
Corneal Epithelial Thickness Mapping in Healthy Population Corneas Using MS-39 Anterior Segment Optical Coherence Tomography
Authors AlTurki HS, Alsubhi SS , Alhazmi A, Alhadlag A , Albalawi NS, Alzoman MA, Aljasir M, Alsubaie M, Aljindan M, Alsomali A
Received 6 November 2024
Accepted for publication 4 January 2025
Published 22 January 2025 Volume 2025:19 Pages 249—259
DOI https://doi.org/10.2147/OPTH.S503195
Checked for plagiarism Yes
Review by Single anonymous peer review
Peer reviewer comments 2
Editor who approved publication: Dr Scott Fraser
Hissah Saleh AlTurki,1 Shahad Salah Alsubhi,1 Asma Alhazmi,1 Abdulrahman Alhadlag,2 Nada Saleh Albalawi,3 Musab Abdulaziz Alzoman,1 Mohammed Aljasir,1 Majed Alsubaie,1 Mohanna Aljindan,4 Abdulaziz Alsomali5
1Ophthalmology Department, Dhahran Eye Specialist Hospital, Dhahran, Saudi Arabia; 2Surgery Department, College of Medicine, Shaqra University, Riyadh, Saudi Arabia; 3Ophthalmology Department, King Salman Armed Forces Hospital, Tabuk, Saudi Arabia; 4Ophthalmology Department, College of Medicine, Imam Abdulrahman Bin Faisal University, Dammam, Saudi Arabia; 5Ophthalmology Department, College of Medicine, King Faisal University, Alahsa, Saudi Arabia
Correspondence: Shahad Salah Alsubhi, Ophthalmology Department, Dhahran Eye Specialist Hospital, 32413, Hassan Alaslami, Ash Shati Ash Sharqi District, Dhahran, Saudi Arabia, Email [email protected]
Purpose: The corneal epithelium is the outermost layer of the cornea. It plays a vital role in both normal and pathological conditions of the eye surface and serves as a protective layer. This study aimed to evaluate corneal epithelial thickness (ET) and create a normative database of corneal ET for pediatric and adult age groups using MS-39 AS-OCT.
Patients and Methods: This is a cross-sectional multi-center study conducted among the Saudi population.
Results: A total of 268 eyes of 268 patients were analyzed (male 50.7% vs female 49.3%). 53.8% were pediatric age group. Higher mean values of central, paracentral, and peripheral were associated with the adult age group except for superior paracentral, temporal peripheral, and nasal peripheral. Male patients had higher mean values of central, paracentral, and peripheral in each quadrant, except for inferior peripheral. There was a significant correlation between inferior, superior, nasal, and temporal in both paracentral and peripheral. No significant correlations were observed between the spherical equivalent and epithelial thickness map.
Conclusion: The study found sex differences, with females generally having lower ET values than males, and older age having higher values than children.
Keywords: corneal epithelial thickness, anterior segment, optical coherence tomography, Saudi Arabia
Introduction
The corneal epithelium is the outermost layer of the cornea. It plays a vital role in both normal and pathological conditions of the eye surface and serves as a protective layer. Besides the protective function of the eye, it plays an important role by contributing to the refractive power of the eye.1–3 It is composed of five to seven cell layers and has an optimal central thickness of approximately 50–52 μm. Basal corneal epithelial cells regenerate and maintain tissue balance during normal functioning.1 The thickness of the corneal epithelium is not uniformly distributed and tends to change its profile to compensate for curvatures and stromal irregularities to restore a regular and smooth ocular surface to hide the presence of an irregular stromal surface either partially or completely from the corneal topography.1,4 Changes in the epithelial thickness (ET) profile have been noted after refractive surgery, contact lens wear, and in many pathologies such as dry eye and keratoconus (KC).1
ET commonly varies across different regions of the cornea and can be influenced by various factors including age, sex, and ocular health.4–6 Several imaging techniques have been used to measure ET, including confocal microscopy, very-high-frequency (VHF) digital ultrasound, and Anterior segment optical coherence tomography (AS-OCT).1,2,5,7,8 Among these, AS-OCT stands out as a non-contact, high-resolution imaging modality ideal for ET analysis. The MS-39 integrates spectral-domain OCT with Placido-based topography providing detailed epithelial thickness mapping (ETM) that is valuable for detecting subclinical keratoconus.1,2,5,9,10
ET distribution aids in diagnosing forme fruste keratoconus which marked by cone thinning and peripheral thickening, typically progressing from puberty to the third decade.4–6 Therefore, early diagnosis is essential, and ETM can provide new and valuable information to improve early diagnosis. Moreover, a normative database is essential to understand and analyze the impact of the different disease entities or treatment modalities. However, there is a lack of a normative database for these measurements in our population. None of the few published studies has used the new MS-39 AS OCT machine to create normative databases for corneal ETM in pediatrics and adults. Therefore, this study aims to evaluate the corneal ET profile in healthy Saudi population corneas in order to create a normative database using this device.
Materials and Methods
This cross-sectional multicenter study was conducted among the Saudi population at the Dhahran Eye Specialist Hospital, King Fahad University Hospital, and Tadawi Hospital, Saudi Arabia. The inclusion criteria required the absence of corneal pathology, no history of ocular surgery or trauma, no contact lens wear in the past three months, normal corneal topography and tomographic parameters, and no family history of (KC). Data from both eyes were included in this study. Individuals with eyelid problems such as ptosis, blepharitis, or other eyelid malpositions were excluded from the study, as it might affect ETM.
Study Aims and Objectives
To Create a Normative Database of Corneal ETM for the Adult Age Group Using MS-39 as-OCT.
Secondary Objective
- To describe and correlate between the demographic data (age and gender) and corneal ETM profile in the pediatric and adult age group.
- To assess corneal ETM within different corneal zones and to compare it with the other eye.
- To study the correlation of epithelial thickness maps and refractive errors.
Sample Size
The sample size was calculated to ensure adequate power for detecting clinically relevant differences in epithelial thickness between the pediatric and adult groups. Using a standard deviation of 4.0 micrometers (based on prior literature) and a desired margin of error of 1.5 micrometers, a sample size of 120 participants per group was deemed sufficient to achieve 80% power with a significance level of alpha = 0.05. This study includes 268 participants, exceeding the minimum required sample size for robust statistical analysis.
Subject Preparation
Subjects were instructed to avoid wearing contact lenses for at least three months before the examination. Comprehensive ophthalmological evaluations were performed, including autorefractive measurements and determination of the spherical equivalent (SE).
Imaging Device
The MS-39 anterior segment optical coherence tomography (AS-OCT) device was used for all ET measurements. It combines spectral-domain OCT with Placido-based topography, providing high-resolution images of the corneal layers.
Measurement Zones
Epithelial thickness was measured in predefined concentric ring-shaped zones centered on the cornea. Specific regions included the central zone (0–3 mm), paracentral zone (3–6 mm), and peripheral zone (6–8 mm). Measurements were taken for superior, inferior, nasal, and temporal areas within these zones.
Ethical Considerations
This study was conducted by ethical standards and guidelines for research involving human subjects. Ethical approval was obtained from the appropriate institutional review boards (IRBs) from two of the participating centers. Informed consent was obtained from all adult participants and the parents or legal guardians of pediatric participants. The study adhered to the principles outlined in the Declaration of Helsinki, ensuring that participants’ rights, safety, and well-being were protected throughout the research process. Additionally, the study ensured the confidentiality and anonymity of participant data. No personal identifiers were used in the analysis, and data were stored securely in compliance with institutional data protection policies. Any potential conflicts of interest or funding sources that could influence the study’s outcomes have been transparently disclosed.
Procedure
Subjects were seated comfortably, and the head was positioned to ensure proper alignment with the imaging device. The subject’s eye was aligned with the device’s fixation target to obtain stable and accurate measurements. Multiple scans were taken to ensure reproducibility, and the best-quality images were selected for analysis.
Data Collection
The AS-OCT device automatically segmented the corneal layers and generated an epithelial thickness map. Measurements of epithelial thickness at the central, superior, inferior, nasal, and temporal regions were recorded.
Statistical Analysis
A randomization 1:1 scheme was applied to select only one eye of each patient. Descriptive statistics were given as numbers and percentages (%) for all categorical variables, while continuous variables were calculated and summarized as mean and standard deviation. A paired sample t-test was used to calculate the differences in central, nasal, temporal, superior, and Inferior Thickness Mapping in central, paracentral, and peripheral. Also, the association between central, nasal, temporal, superior, and Inferior Thickness Mapping in terms of gender and age has been conducted using an independent sample t-test. Further, the Pearson correlation coefficient was performed to determine the correlation between each quadrant, spherical equivalent, and epithelial thickness map, while the differences in the mean of epithelial and corneal thickness and, thinnest location, and thinnest corneal location have been calculated using one-way ANOVA test. The normality test (statistical collinearity) was performed using the Shapiro–Wilk test as well as the Kolmogorov–Smirnov test. Values were considered significant with a p-value of less than 0.05. The data were analyzed using the software program Statistical Packages for Software Sciences (SPSS) version 26 (Armonk, New York, IBM Corporation, USA).
Results
This study analyzed 268 eyes of 268 patients. As seen in Table 1, 53.4% were younger than 18 years. Male patients (50.7%) were slightly more than their female counterparts (49.3%). The differences in nasal, temporal superior, and inferior ETM were assessed using the paired sample t-test. The mean value of the Central area was 52.1 (SD 4.08) across the groups, while the mean value of paracentral was 50.8 ± 3.8 in Nasal ETM, 49.8 ± 4.18 in temporal ETM, 49.6 ± 3.71 in superior ETM, and 50.4 ± 6.14) in inferior ETM. The mean value of the peripheral area was 49.9 ± 4.17 in Nasal ETM, 49.3 ± 3.94) in temporal ETM, 46.6 ± 3.71) in superior ETM, and 49.3 ± 9.2 in inferior ETM. All comparisons revealed significant differences across the groups (p<0.05) (Table 2).
 |
Table 1 Demographic Characteristics of the Patients(n=268) |
 |
Table 2 Regional Mean Central, Nasal, Temporal, Superior, and Inferior Thickness Mapping (ETM) Associations (n=268) |
The mean difference between inferior and superior was 0.75 in the paracentral (p=0.023), while 2.71 in the peripheral (p<0.001). Further, the mean difference between nasal and temporal was 0.93 for paracentral (p<0.001) and 0.57 for peripheral (p=0.026) (Table 3). Figure 1 shows that the correlation between the spherical equivalent and epithelial thickness map did not reach statistical significance (p=0.051).
 |
Table 3 Correlation Between Each Quadrant (n=268) |
 |
Figure 1 Correlation between spherical equivalent and epithelial thickness map. |
In Table 4, using an independent sample t-test, we found that male patients were more associated with higher mean values of Central ETM (p=0.017), superior paracentral (p=0.002), temporal paracentral (p=0.026), inferior paracentral (p=0.049) and nasal paracentral (p=0.028). Also, male patients were more associated with increased mean values of superior peripheral (p=0.006), inferior peripheral (p=0.019), inferior peripheral (p<0.001), and epithelial thinnest location (p=0.014).
 |
Table 4 Differences in Epithelial and Corneal Thickness in Relation to Gender |
In Table 5, using an independent sample t-test, we observed that adult age groups were more associated with higher mean values in central ETM (p<0.001), temporal paracentral (p<0.001), inferior paracentral (p<0.001), nasal paracentral (p<0.001), superior peripheral (p=0.001) and inferior peripheral (p=0.007).
 |
Table 5 Differences in Epithelial and Corneal Thickness in Relation to Age |
Figure 2 shows that the central area of male patients has a mean value of 52.7 ± 3.8, while female patient’s mean value was 51.5 ± 4.3. There were obvious differences in the mean values in each of the paracentral and peripheral quadrants between males and females (p<0.05), with males exhibiting higher mean values except for the temporal peripheral, where the gender comparison did not reach statistical significance (p=0.073) (see details in Table 5).
 |
Figure 2 Representative corneal epithelial thickness in males and females represented by mean ± SD. |
Among patients less than 18 years (Figure 3), the most notable results presented in Figure 3 were the significant difference in mean values between nasal peripheral in males (mean 50.4 ± 4.2) versus females (mean 48.5 ± 4.4) (p=0.015); between superior peripheral in males (mean 48.5 ± 5.1) versus females (mean 46.6 ± 4.4) (p=0.016). The central area has a mean value of 51.7 ± 3.8 in males and 50.8 ± 4.5 in females but without significant difference (p=0.203).
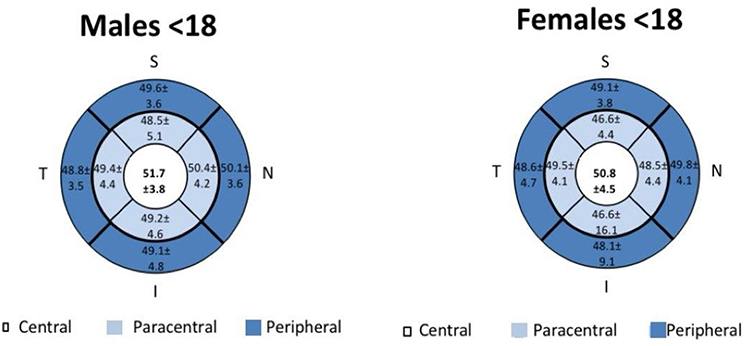 |
Figure 3 Representative corneal epithelial thickness in pediatrics represented by mean ± SD. |
Among adult patients (Figure 4), several quadrants show significant differences in gender pairwise comparison, including the central area in males (mean 53.8 ± 3.5) versus females (mean 52.3 ± 3.9) (p=0.039); nasal paracentral in males (mean 52.5 ± 3.2) versus females (mean 50.7 ± 3.7) (p=0.005); nasal peripheral in males (mean 51.5 ± 3.9) versus females (mean 48.9 ± 3.5) (p<0.001); temporal paracentral in males (mean 51.9 ± 3.0) versus females (mean 48.1 ± 3.8) (p=0.001); temporal peripheral in males (mean 50.1 ± 3.3) versus females (mean 48.1 ± 3.8) (p=0.002); superior paracentral in males (mean 51.1 ± 3.6) versus females (48.7 ± 3.5) (p<0.001); inferior paracentral in males (mean 53.2 ± 3.4) versus females (mean 51.5 ± 3.6) (p=0.008); and inferior peripheral in males (52.1 ± 3.3) versus females (mean 49.7 ± 3.5) (p<0.001). (Figure 5) represents a corneal epithelial map illustration.
 |
Figure 4 Representative corneal epithelial thickness in adults represented by mean ± SD. |
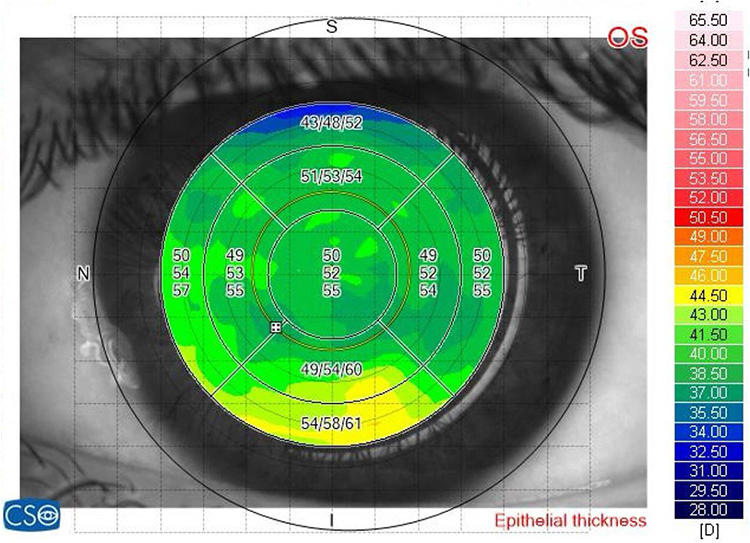 |
Figure 5 Corneal epithelial map illustration. |
In Table 6, using the one-way ANOVA test, we found that patients with compound myopia showed significantly higher mean values in the inferior paracentral (p<0.001), while patients with mixed astigmatism showed significantly higher mean values in the nasal paracentral (p=0.004), and patients with simple myopia showed significantly higher mean values in epithelial thinnest location (p=0.001). In contrast, patients with hyperopia showed significantly lower mean values in the central area (p<0.001) and temporal paracentral (p<0.001).
 |
Table 6 Mean Differences in Epithelial and Corneal Thickness in Relation to Refractive Error Type |
Discussion
This study aimed to assess the corneal ET profile in a healthy Saudi population including children and adults. The corneal ET distribution followed a non-homogenous pattern. The central epithelial zone and the nasal paracentral zone, the temporal paracentral zone were the thickest, respectively, whereas the superior peripheral zone was the thinnest. Nasal ET has been consistently found to be thicker than temporal ET in both adults and children. This difference is due to the nasal cornea being better protected from rubbing by the tarsus and from eye rubbing.11–13 In our paper, there’s a significant difference between these quadrants, nasal ET was thicker than temporal ET in the paracentral and peripheral zones. The result of a previous study was aligned with our results but there was no significant difference.1 Moreover, ET was found to be decreased from the center to the peripheral. Other studies supported our results in children and adults.14–16 There were significant differences between the central and paracentral as well as paracentral and peripheral areas in all the corneal ET maps except the paracentral and peripheral temporal zone in this study. Other studies found no significant differences among the central, paracentral, and peripheral areas in the corneal ET.14–20
The study also found that males generally have thicker corneal epithelium compared to females. This difference may be attributable to hormonal factors, as suggested by previous research.17,18 Clinically, this implies that sex-specific reference values should be used when evaluating corneal health to avoid misinterpretation of thickness measurements. For example, what might be considered normal epithelial thickness in a male patient could be atypical in a female patient, potentially leading to misdiagnosis if sex differences are not accounted for. Previous studies have reported lower ET values in female sex, with variations ranging from 1 to 2 μm. In children and adults, we also found that females had lower ET values than males.13,21,22 In the current study, males had significantly higher ET values in the central, paracentral, and peripheral areas than females. ET was superior in the central, paracentral, and peripheral zones.
As the study demonstrates, older adults tend to have higher corneal epithelial thickness values across various regions of the cornea compared to younger individuals. This finding is clinically significant because it suggests that age-related changes in corneal epithelial thickness should be considered when diagnosing and managing corneal conditions such as keratoconus. For instance, the thicker epithelium in older patients might mask early signs of keratoconus, potentially delaying diagnosis. Therefore, age-specific normative data, as provided by this study, are essential for the accurate interpretation of corneal thickness measurements in clinical practice. Kanellopoulos et al23 reported that with age increasing, the readings became more variable and less reliable. Moreover, Ma et al17 indicated that ET increased with age in patients.
This study shows the overall central ET thickness is 52.1 μm in the Saudi population. Haque et al l14 reported that central ET 54 μm. Recently, Feng et al16 compared central with limbal epithelial thickness using the same OCT instrument as that used in this study. They reported a Central ET of 58 μm. A possible explanation for this difference may be due to different inter-operator methods of data processing of the raw data scans. In this current study, the corneal ET becomes progressively thicker from hyperopia to myopia, with significant change in the central nasal, temporal, and inferior paracentral areas. While a previous study showed ET decrease from hyperopia to myopia.24 To date, the information we have on the relationship between refractive errors and CET is limited.2,24–27 Previous studies showed high myopia is associated with thinner ET compared to mild-moderate myopia.24 In this study, we found ET was the thinnest in the hyperopic group. This finding might be attributed to age as the hyperopic group was from the pediatric group.
The sample size of 268 eyes in this study was determined to ensure sufficient power to detect clinically relevant differences in epithelial thickness across various regions of the cornea. Previous studies on corneal epithelial thickness have used sample sizes ranging from smaller cohorts to several hundred eyes, depending on the study’s objectives and the population being studied. Given the study’s focus on establishing normative data for a specific population (Saudi adults and children), a sample size of 268 eyes is adequate to capture the natural variability within this population while maintaining statistical power. This sample size was calculated to provide reliable estimates with a margin of error that is acceptable for clinical application, ensuring that the findings can be generalized to the broader Saudi population. The clinical significance of the findings from this study is considerable, particularly in the context of early diagnosis and management of corneal diseases such as keratoconus. The normative data provided by this study can serve as a valuable reference for ophthalmologists and optometrists in Saudi Arabia and potentially in regions with similar demographic characteristics.
Early diagnosis of keratoconus is crucial for preventing disease progression and preserving vision. The epithelial thickness maps generated by this study can help identify subclinical keratoconus, which is often characterized by localized thinning of the epithelium. By comparing a patient’s epithelial thickness profile with the normative data established in this study, clinicians can detect early deviations from normal, allowing for timely intervention. The findings also have implications for refractive surgery, where precise knowledge of corneal epithelial thickness is essential for planning and assessing surgical outcomes. Variations in epithelial thickness can affect the accuracy of refractive corrections, and the normative data from this study can help surgeons better understand and predict these variations in their patients. The study’s inclusion of pediatric patients provides critical data for the early detection of corneal abnormalities in children. Since keratoconus often begins during adolescence, having normative data for this age group allows for better screening and monitoring of at-risk patients.
Conclusion
To our knowledge, this study is the first to examine the corneal epithelium in the Saudi population including children and adults offering valuable normative data for this group, highlighting lower ET in females and higher ET in adults compared to children. While this study provides valuable insights into corneal epithelial thickness mapping in a healthy Saudi population, several factors should be considered. While the cross-sectional design offers a snapshot, longitudinal studies are needed to assess changes over time. Moreover, the method used is the MS-39 AS-OCT which is a reliable, advanced device and provides high-resolution measurements, it has a within-subject standard deviation (Sw) of approximately 3.89 micrometers for corneal thickness measurements, as reported in prior studies (Schiano et al, 2020). This inherent variability was considered during data interpretation, and findings based on small mean differences were regarded as exploratory rather than conclusive. However, incorporating other imaging techniques like confocal microscopy or VHF digital ultrasound in future studies could offer additional validation and insights into corneal epithelial thickness conditions. Including both pediatric and adult populations is a key strength of this study. Future research focusing on pediatric populations could address unique challenges in corneal measurements. Such studies would enhance understanding of epithelial thickness and its impact on ocular health across different populations.
Abbreviations
ET, epithelial thickness; ETM, epithelial thickness mapping; AS-OCT, anterior segment optical coherence tomography; KC, keratoconus; VHF, very-high-frequency; IRBs, institutional review boards; SE, spherical equivalent.
Disclosure
All authors report no conflicts of interest in this work.
References
1. Oliveira Loureiro TD, Rodrigues-Barros S, Lopes D, et al. Corneal epithelial thickness profile in healthy Portuguese children by high-definition optical coherence tomography. Clin Ophthalmol. 2021;15:735.
2. Ozalp O, Atalay E. Biometric determinants of epithelial thickness profile across a wide range of refractive errors. Ophthalmol Ther. 2022;11(3):1089–1100. doi:10.1007/s40123-022-00489-9
3. Yang Y, Hong J, Deng SX, Xu J. Age-related changes in human corneal epithelial thickness measured with anterior segment optical coherence tomography. Invest Ophthalmol amp Vis Sci. 2014;55(8):5032–5038. doi:10.1167/iovs.13-13831
4. Reinstein DZ, TJJJors A, Gobbe M. Corneal epithelial thickness profile in the diagnosis of keratoconus. J Refrac Surg. 2009;25(7):604. doi:10.3928/1081597X-20090610-06
5. Kanellopoulos AJ, Aslanides IM, Asimellis G. Correlation between epithelial thickness in normal corneas, untreated ectatic corneas, and ectatic corneas previously treated with CXL; is overall epithelial thickness a very early ectasia prognostic factor? Clin Ophthalmol. 2012;6:789–800. doi:10.2147/OPTH.S31524
6. Silverman RH, Urs R, RoyChoudhury A, Archer TJ, Gobbe M, Reinstein DZ. Epithelial remodeling as basis for machine-based identification of keratoconus. Invest Ophthalmol Vis Sci. 2014;55(3):1580–1587. doi:10.1167/iovs.13-12578
7. Loureiro T, Rodrigues-Barros S, Carreira AR, et al. Corneal epithelium asymmetry in children with atopy: the effect of hand dominance. Clin Ophthalmol. 2022;16:2453–2461. doi:10.2147/OPTH.S375504
8. Heidari Z M. MS-39®. In: Diagnostics in Ocular Imaging. Springer; 2021:265–284.
9. Li Y, Meisler DM, Tang M, et al. Keratoconus diagnosis with optical coherence tomography pachymetry mapping. Ophthalmology. 2008;115(12):2159–2166. doi:10.1016/j.ophtha.2008.08.004
10. Li Y, Tang M, Zhang X, Salaroli CH, Ramos JL, Huang D. Pachymetric mapping with Fourier-domain optical coherence tomography. J Cataract Refract Surg. 2010;36(5):826–831. doi:10.1016/j.jcrs.2009.11.016
11. Samy MM, Shaaban YM, Badran TA. Age- and sex-related differences in corneal epithelial thickness measured with spectral domain anterior segment optical coherence tomography among Egyptians. Medicine. 2017;96(42):e8314. doi:10.1097/MD.0000000000008314
12. Baghdasaryan E, Tepelus TC, Marion KM, Bagherinia H, Sadda SR, Hsu HY. Evaluation of corneal epithelial thickness imaged by high definition optical coherence tomography in healthy eyes. Cornea. 2019;38(1):62–66. doi:10.1097/ICO.0000000000001745
13. Ma Y, Zhu X, He X, Lu L, Zhu J, Zou H. Corneal thickness profile and associations in Chinese children aged 7 to 15 years old. PLoS One. 2016;11(1):e0146847. doi:10.1371/journal.pone.0146847
14. Haque S, Jones L, Simpson T. Thickness mapping of the cornea and epithelium using optical coherence tomography. Optometry Vision Sci. 2008;85(10):E963–76. doi:10.1097/OPX.0b013e318188892c
15. Hashmani N, Hashmani S, Saad CM. Wide corneal epithelial mapping using an optical coherence tomography. Invest Ophthalmol Visual Sci. 2018;59(3):1652–1658. doi:10.1167/iovs.17-23717
16. Feng Y, Simpson TL. Corneal, limbal, and conjunctival epithelial thickness from optical coherence tomography. Optometry Vision Sci. 2008;85(9):E880–3. doi:10.1097/OPX.0b013e318185272d
17. Liu Z, Huang AJ, Pflugfelder SC. Evaluation of corneal thickness and topography in normal eyes using the Orbscan corneal topography system. Br J Ophthalmol. 1999;83(7):774–778. doi:10.1136/bjo.83.7.774
18. Hashemi H, Asgari S, Mehravaran S, Emamian MH, Shariati M, Fotouhi A. The distribution of corneal thickness in a 40- to 64-year-old population of Shahroud, Iran. Cornea. 2011;30(12):1409–1413. doi:10.1097/ICO.0b013e31822018dd
19. Wang X, Wu Q. Investigation of the human anterior segment in normal Chinese subjects using a dual Scheimpflug analyzer. Ophthalmology. 2013;120(4):703–708. doi:10.1016/j.ophtha.2012.09.034
20. Tao A, Shao Y, Jiang H, et al. Entire thickness profiles of the epithelium and contact lens in vivo imaged with high speed and high resolution optical coherence tomography. Eye Contact Lens. 2013;39(5):329–334. doi:10.1097/ICL.0b013e31829fae00
21. Giuffrè G, Di Rosa L, Fiorino F, Bubella DM, Lodato G. Variations in central corneal thickness during the menstrual cycle in women. Cornea. 2007;26(2):144–146. doi:10.1097/01.ico.0000244873.08127.3c
22. Gupta PD, Johar SK, Nagpal K, Vasavada AR. Sex hormone receptors in the human eye. Surv Ophthalmol. 2005;50(3):274–284. doi:10.1016/j.survophthal.2005.02.005
23. Kanellopoulos AJ, Asimellis G. In vivo three-dimensional corneal epithelium imaging in normal eyes by anterior-segment optical coherence tomography: a clinical reference study. Cornea. 2013;32(11):1493–1498. doi:10.1097/ICO.0b013e3182a15cee
24. Wu Y, Wang Y. Detailed distribution of corneal epithelial thickness and correlated characteristics measured with SD-OCT in myopic eyes. J Ophthalmol. 2017;2017:1018321. doi:10.1155/2017/1018321
25. Wang X, Dong J, Wu Q. Corneal thickness, epithelial thickness and axial length differences in normal and high myopia. Ophthalmol. 2015;15:49.
26. Kim BJ, Ryu IH, Lee JH, Kim SW. Correlation of sex and myopia with corneal epithelial and stromal thicknesses. Cornea. 2016;35(8):1078–1083. doi:10.1097/ICO.0000000000000850
27. Kim WK, Ryu IH, Yoo J, Kim SW. Effect of gender, age, and ocular and growth-related factors on corneal epithelial and stromal thickness in children. J Clin Med. 2020;9(12):3849.
 © 2025 The Author(s). This work is published and licensed by Dove Medical Press Limited. The
full terms of this license are available at https://www.dovepress.com/terms.php
and incorporate the Creative Commons Attribution
- Non Commercial (unported, 3.0) License.
By accessing the work you hereby accept the Terms. Non-commercial uses of the work are permitted
without any further permission from Dove Medical Press Limited, provided the work is properly
attributed. For permission for commercial use of this work, please see paragraphs 4.2 and 5 of our Terms.
© 2025 The Author(s). This work is published and licensed by Dove Medical Press Limited. The
full terms of this license are available at https://www.dovepress.com/terms.php
and incorporate the Creative Commons Attribution
- Non Commercial (unported, 3.0) License.
By accessing the work you hereby accept the Terms. Non-commercial uses of the work are permitted
without any further permission from Dove Medical Press Limited, provided the work is properly
attributed. For permission for commercial use of this work, please see paragraphs 4.2 and 5 of our Terms.