")
Back to Journals » Diabetes, Metabolic Syndrome and Obesity » Volume 18
Correlation Analysis between Serum Uric Acid Levels and Bone Mineral Density in Children with Obesity
Authors Wan N , Zhang Q , Zhang J , Zhang T , Shi W
Received 27 February 2025
Accepted for publication 29 May 2025
Published 2 June 2025 Volume 2025:18 Pages 1837—1847
DOI https://doi.org/10.2147/DMSO.S521357
Checked for plagiarism Yes
Review by Single anonymous peer review
Peer reviewer comments 3
Editor who approved publication: Professor Liang Wang
Naijun Wan, Qian Zhang, Jin Zhang, Tian Zhang, Weijia Shi
Department of Pediatrics, Beijing Jishuitan Hospital, Capital Medical University, Beijing, People’s Republic of China
Correspondence: Naijun Wan, Department of Pediatrics, Beijing Jishuitan Hospital, Capital Medical University, 68 huinanbei Road, Beijing, 100096, People’s Republic of China, Tel +86-010-58398102, Email [email protected]
Purpose: To investigate the relationship between serum uric acid (SUA) levels and bone mineral density (BMD) in children with obesity.
Methods: 229 children with obesity were included in the study, and their blood SUA, fasting plasma glucose (FPG), glycosylated hemoglobin (HbAlc), calcium (Ca), phosphorus (P), 25-hydroxyvitamin D (25(OH)D) and other indicators were measured. Distal forearm BMD was assessed at the radius and ulna. Differences in these indicators were compared across different genders and age groups.
Results: BMD showed significant differences between genders and age groups. The BMD Z-score in the 6– 9 years group was higher than that in the 10– 12 years group for both boys (− 0.13 ± 0.92 vs − 1.27 ± 0.62, p = 0.000) and girls (0.68 ± 0.96 vs − 0.03 ± 0.73, p = 0.001). Serum SUA levels in the 6– 9 years group were lower than those in the 10– 12 years group for both boys (345.9 ± 65.7 vs 415.39 ± 74.02, p = 0.000) and girls (338.33 ± 63.33 vs 368.61 ± 75.45, p = 0.047). SUA was negatively correlated with BMD in all age groups of boys and in the 6– 9 years group of girls (p< 0.05). Multiple linear regression analysis showed that after controlling for other factors affecting BMD, SUA remained significantly negatively correlated with BMD Z-scores (p < 0.001).
Conclusion: SUA is negatively correlated with BMD in children with obesity and is an independent factor affecting BMD. It may serve as a potential predictor of BMD in children with obesity.
Keywords: bone mineral density, child, obesity, serum uric acid
Introduction
In recent years, with the prevalence of childhood obesity increasing, obesity and its associated complications have become a major global public health challenge, which has attracted extensive attention from researchers and healthcare professionals.1,2 Studies have shown that obesity may have an impact on bone development in children, significantly increasing the risk of osteoporosis and fractures.3,4 In addition, studies in adults have revealed associations between metabolic markers and bone health, emphasizing the importance of monitoring these metabolic markers for early screening and intervention in high-risk groups, including obesity.5,6
Although previous studies have explored the relationship between obesity and bone mineral density (BMD), most have focused on conventional metabolic indicators such as body mass index (BMI), insulin resistance, and vitamin D levels. Notably, the prevalence of hyperuricemia (HUA) has been rising among Chinese children and adolescents, particularly in those with obesity.7–9 While adult studies have established a clear link between HUA and abnormal bone metabolism, the relationship between serum uric acid (SUA) levels and BMD in children with obesity remains unelucidated, especially in China.10,11 Building upon evidence from adult research, we hypothesize that BMD in children with obesity may correlate with SUA levels, and that HUA could serve as a predictive marker for abnormal bone density. This study therefore aims to elucidate the SUA-BMD relationship in children with obesity, with the goal of identifying early risk markers for compromised bone strength during childhood.
Subjects and Methods
Study Population
A total of 229 children with obesity aged 6–12 years who visited the pediatric department of Beijing Jishuitan Hospital, Capital Medical University, from December 2018 to December 2022 were included in this study. Among them, 132 were boys with a mean age of 9.68 ± 1.87 years, and 97 were girls with a mean age of 8.88 ± 1.68 years. Informed consent was obtained from the guardians of all participants, and the study was approved by the Ethics Committee of Beijing Jishuitan Hospital l, Capital Medical University (Approval No. 201808–03).
Inclusion Criteria: The inclusion criteria for obesity were based on the BMI cutoff points for screening overweight and obesity in children aged 2–18 years.12
Exclusion Criteria: 1) Children with liver or kidney dysfunction; 2) Children with endocrine or metabolic diseases, autoimmune diseases, or other conditions that may affect bone metabolism; 3) Children with a history of drug or toxin exposure; 4) Children with secondary obesity caused by other factors.
Clinical Data Collection
Basic Information
This included gender, age, height, weight, body mass index (BMI), and medical history.
Laboratory Testing
After fasting for 12 hours, 5 mL of venous blood was collected from each participant and analyzed by the Clinical Laboratory of Beijing Jishuitan Hospital, Capital Medical University. SUA, fasting plasma blood glucose (FPG), calcium (Ca), phosphorus (P), total cholesterol (TC), triglycerides (TG), low-density lipoprotein cholesterol (LDL-C), and high-density lipoprotein cholesterol (HDL-C), alkaline phosphatase (ALP) were measured using the colorimetric method. Fasting insulin (FIN) was measured using a chemiluminescence assay on a Hitachi 7600 automated biochemical analyzer. 25-hydroxyvitamin D (25(OH)D) levels were determined using liquid chromatography-tandem mass spectrometry, with testing performed by Hehe Medical Diagnostics.
BMD Measurement
In this study, BMD was assessed using dual-energy X-ray absorptiometry (DXA). All measurements were performed independently by a single technician, with daily quality control procedures. BMD was measured by using an EXA-3000 X-ray densitometer (OsteoSys). DXA measurements can be influenced by factors such as body fat content and positioning artifacts.13 For example, conventional lumbar spine measurements may produce falsely elevated BMD values due to abdominal fat attenuation, and mechanical loading adaptations may obscure underlying metabolic bone abnormalities, limiting their applicability in children with obesity. In contrast, the distal radius and ulna offer several advantages: minimal soft tissue interference, lower dependency on positioning, and greater sensitivity to early metabolic changes due to their high trabecular bone content.14,15 Therefore, the distal forearm (radius and ulna) was selected as the site for BMD measurement in this study. The obtained BMD values were compared with age- and sex-matched reference data from healthy children to derive BMD Z-scores.
Methods
Considering the developmental differences in children of different genders and ages during the school-age period, this study adopted a stratified analysis to explore the relationship between metabolic indicators and bone health in different subgroups:
- Participants were first grouped by gender to analyze differences in metabolic indicators, BMD, and other bone turnover markers between boys and girls.
- Correlations between metabolic indicators, BMD, and other bone turnover markers were evaluated.
- The distribution of metabolic indicators across different genders and ages was analyzed, and the relationship between these indicators and BMD in different subgroups was explored.
- Finally, multivariate linear regression models were used to assess the effects of SUA on BMD.
Sample Size Calculation
The sample size for this study was calculated using G*Power 3.1.9.7. Given that the primary objective was to evaluate the independent predictive effect of SUA on BMD, a multiple linear regression model was selected as the basis for the calculation. The parameters were set as follows: medium effect size (f2 = 0.15), significance level (α) of 0.05, and statistical power (1–β) of 0.80. Based on these settings, the minimum required sample size was determined to be 77 participants.
Statistical Analysis
Statistical analysis was performed using SPSS 26.0, and GraphPad Prism 10.1.2 was used for plotting. Continuous variables were expressed as mean ± standard deviation ( ). Normality was assessed using P-P plots, and homogeneity of variance was tested. Differences between two groups were analyzed using t-tests. Pearson correlation analysis was applied for normally distributed data, while Spearman correlation analysis was used for non-normally distributed data. Multivariate linear regression was conducted to determine the relationship between uric acid and BMD. A P-value < 0.05 was considered statistically significant.
Result
Comparison of Metabolic and Bone Health Indicators between Boys and Girls
Boys had significantly higher levels of BMI, SUA and ALP compared to girls (P < 0.05). The bone density Z-scores were significantly lower in boys than girls (P < 0.05). No significant differences were observed in other indicators between boys and girls (Table 1).
 |
Table 1 Comparison of Metabolic Indicators and Bone Health-Related Parameters Between Obese Boys and Girls |
Correlation between Metabolic Indicators and Bone Health Indicators
In boys, SUA, BMI, HbA1c, FIN, and TG were negatively correlated with Z scores, with statistically significant results (P < 0.05). HDL-C showed a positive correlation with Z scores, which was also statistically significant (P < 0.05). In girls, only SUA and BMI were negatively correlated with Z scores with statistical significance (P < 0.05). The details show in Table 2.
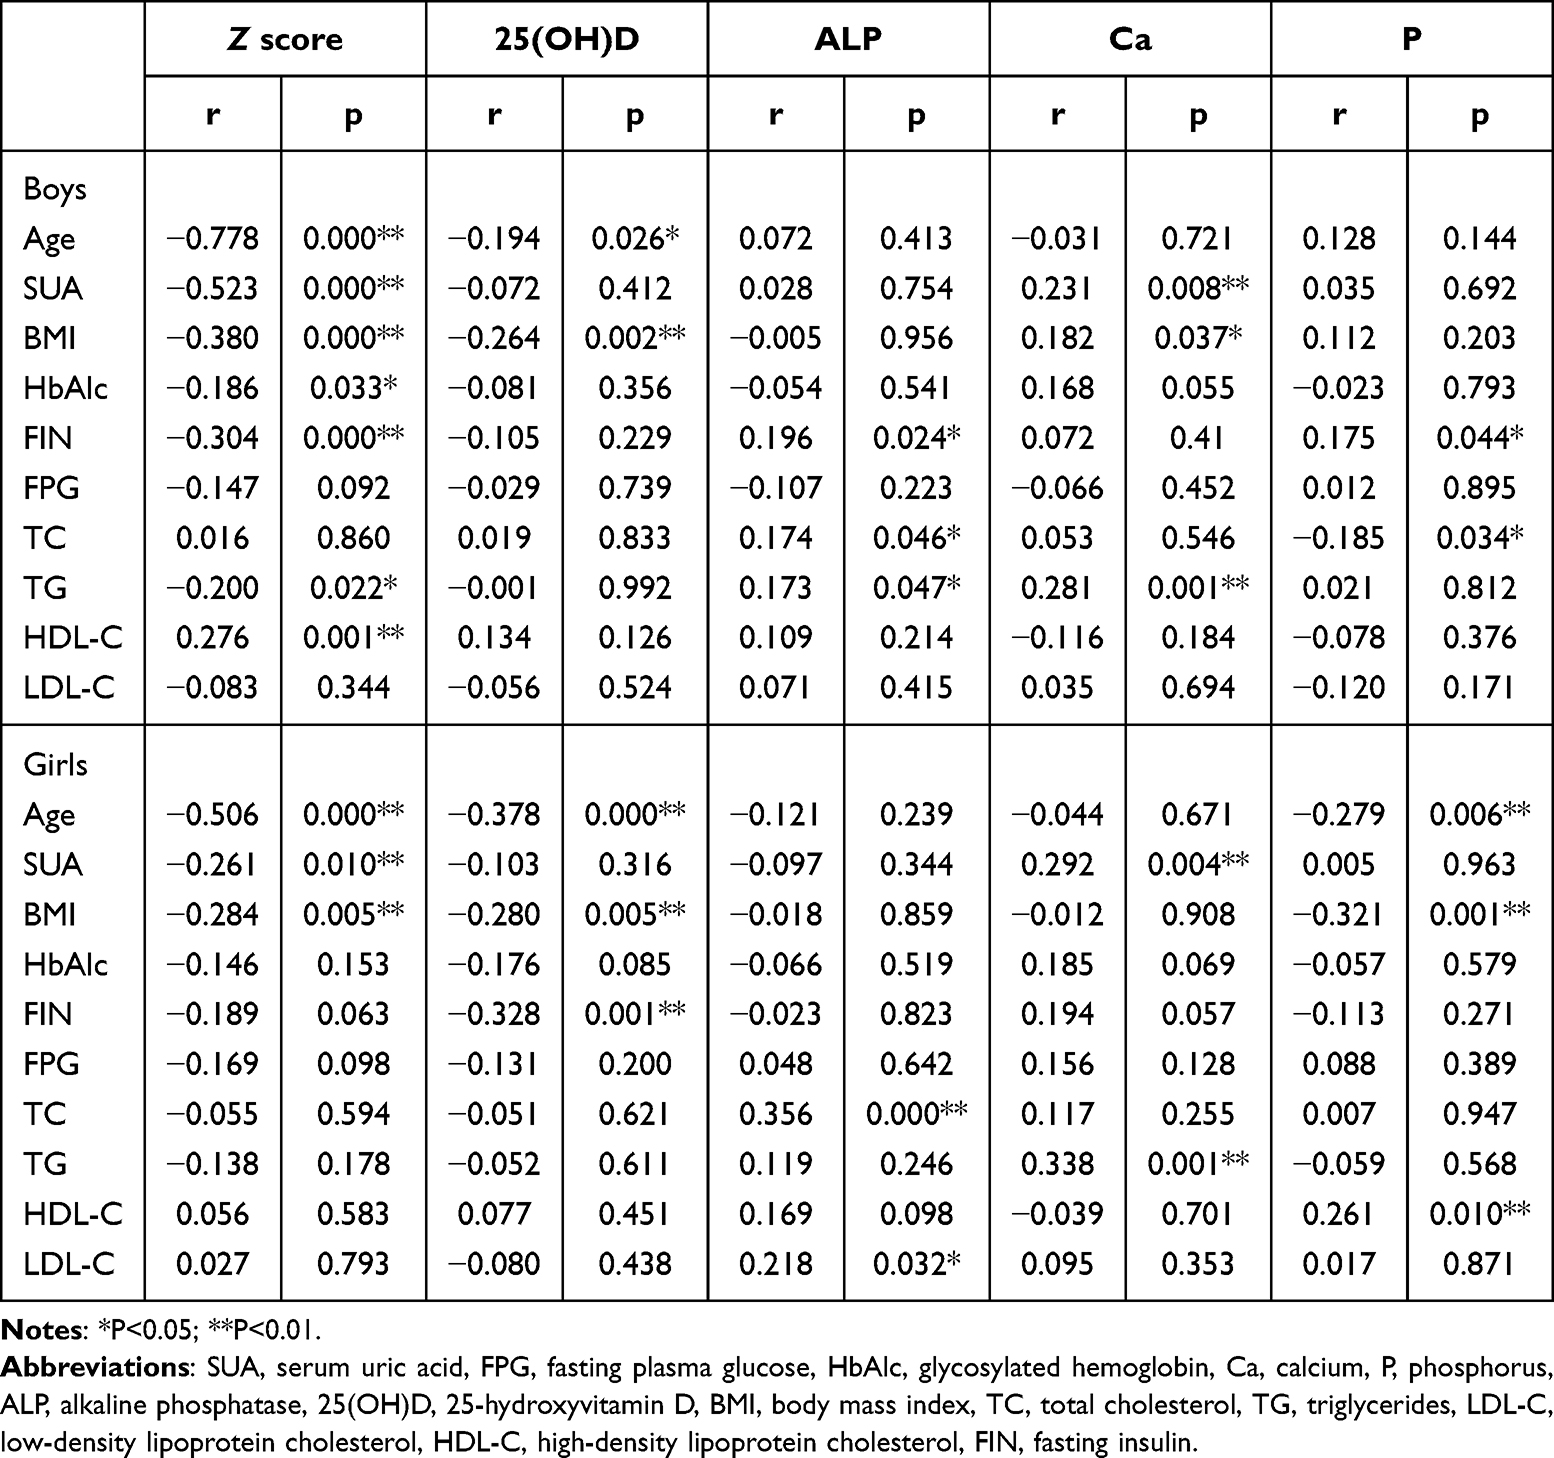 |
Table 2 Correlation Analysis of Metabolic Indicators with Bone Health-Related Parameters in Children with Obesity by Gender |
In boys, BMI, FIN, and TG were correlated with three bone health related indicators, showing more correlations than other metabolic indicators. In girls, BMI and age were correlated with three bone health related indicators, while SUA was correlated with two bone health related indicators, showing more correlations than other indicators. The details show in Table 2.
Age Differences in Metabolic and Bone Health Indicators
Based on developmental characteristics, the participants were divided into two age groups: 6–9 years group with 73 boys and 69 girls, and 10–12 years group with 59 boys and 28 girls. There were statistically significant differences in the distribution of gender and age groups (χ² = 5.948, p = 0.015).
In the 6–9 years group, Z score was significantly higher than in the 10–12 years group for both boys (−0.13 ± 0.92 vs −1.27 ± 0.62, p = 0.000) and girls (0.68 ± 0.96 vs −0.03 ± 0.73, p = 0.001). Conversely, SUA showed an opposite trend, with lower levels in the 6–9 years group compared to the 10–12 years group for both boys (345.9 ± 65.7 vs 415.39 ± 74.02, p = 0.000) and girls (338.33 ± 63.33 vs 368.61 ± 75.45, p = 0.047). See Figure 1 for details.
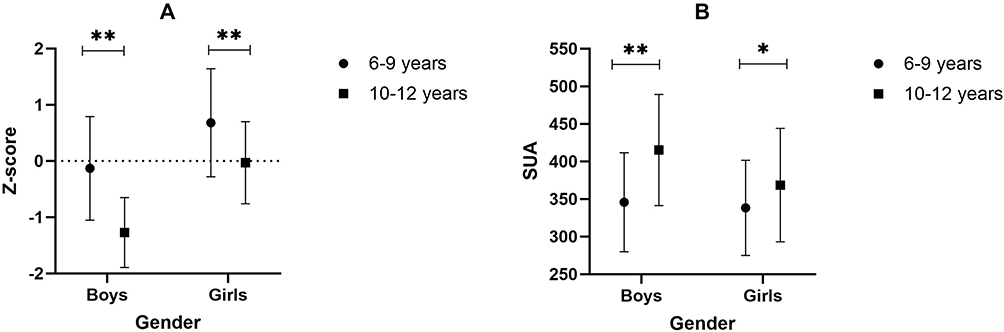 |
Figure 1 Differences in Bone Density and SUA at Different Ages. (A) Differences in BMD Z-scores. (B) Differences in SUA levels. Abbreviations: SUA, serum uric acid, BMD, bone mineral density. Notes: *P<0.05; **P<0.01. |
Metabolic indicators that showed correlation with bone density Z score in the one-way univariate analysis (P < 0. 1) were included in the analysis of age differences. Results showed that in boys, BMI and HDL-C had significant age differences (P < 0.05). In girls, BMI and FIN showed significant age differences (P < 0.05). Additionally, an age difference analysis of bone turnover markers revealed no significant differences in any markers for boys, while ALP and 25(OH) D levels showed significant differences between age groups in girls (P < 0.05). The details show in Table 3.
 |
Table 3 Comparison of Metabolic Indicators and Bone Turnover Markers in Children with Obesity Across Different Age Groups |
Based on the fact that there are age differences in bone density Z-values in children with obesity, we further analyzed the correlation between metabolic indicators with age differences and Z-scores across different age groups. Results showed that in boys, SUA was significantly correlated with Z-scores in both age groups (P < 0.05), BMI was only correlated with Z-scores in the 6–9 years group, and HDL-C showed no significant correlation with BMD after age stratification. In girls, SUA was significantly correlated with Z-scores in the 6–9 years group (P < 0.05), but no metabolic indicators showed significant correlations with Z-scores in the 10–12 years group (Table 4).
 |
Table 4 Correlation Analysis of Metabolic Indicators with Bone Mineral Density in Children with Obesity Across Different Age Groups |
Multivariate Linear Regression of SUA and Bone Density
In boys, Model 1 (unadjusted) showed a negative effect of SUA on bone density Z-scores, with an adjusted R2 of 0.268 (p < 0.001). After controlling for age and BMI in Model 2, the adjusted R2 increased to 0.622 (p < 0.001).
In girls, Model 1 (unadjusted) also indicated a negative effect of SUA on bone density Z-scores, with an adjusted R2 of 0.058 (p = 0.01). After controlling for age and BMI in Model 2, the adjusted R2 increased to 0.251 (p < 0.001). The details show in Table 5.
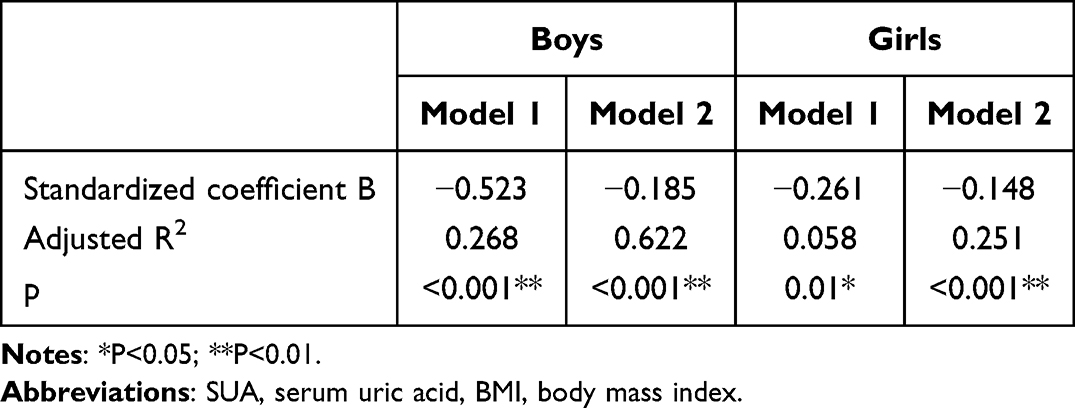 |
Table 5 Multivariate Linear Regression Analysis of BMD and SUA |
Discussion
Obesity has multiple and complex effects on bone health in children. Theoretically, obesity may increase bone density through increased mechanical loading. However, in practice, bone quality in children with obesity tends to exhibit poorer quality due to the adverse effects of endocrine and inflammatory factors. For example, obesity can interfere with normal bone remodeling processes through chronic inflammation, which in turn leads to an increased risk of osteoporosis.16,17 In addition, obesity can affect hormone levels in children, such as causing insulin resistance and reduced secretion of growth hormone, both of which are key regulators of bone metabolism.18–20 Ultimately, due to a series of pathological mechanisms, bone trabeculae in children with obesity become weak and the conversion of mesenchymal cells into osteoblasts is reduced, making them more susceptible to fractures and osteoporosis. Studies have shown that the risk of fractures in children with obesity is 25% higher than in children without obesity.21
Analysis of Age and Gender Characteristics of Bone Density
This study found significant differences in bone density among school-age children based on gender and age, consistent with previous research findings.22–24 Gender differences may be closely related to changes in hormone levels around puberty. Studies have shown that estrogen and testosterone play important roles in the maintenance of bone density and peak bone formation in females and males, respectively. Estrogen promotes bone formation and inhibits bone resorption, while testosterone exerts indirect effects on male bones through direct action or by converting into estrogen.25,26 In addition, factors such as physical activity, dietary habits, and genetic backgrounds of different genders may further exacerbate these differences.27–29 During the rapid bone growth phase, variations in bone formation and resorption rates can affect bone mineral accumulation, which may contribute to age-related differences in bone density.30 The mechanical loading effects of obesity and the regulation of the fat-bone axis may also interact with other factors to contribute to these differences.31,32 These findings suggest that when studying factors influencing bone density in school-age children, it is necessary to consider whether metabolic indicators exhibit similar gender and age-related differences. Incorporating gender and age stratification into the analysis allows for a more accurate assessment of the potential impact of metabolic indicators on bone density.
Association of SUA and Other Metabolic Indicators with Bone Mineral Density Under Gender Differences
In our study, SUA was found to be one of the few metabolic indicators that was significantly associated with BMD Z-scores in both boys and girls. In both genders, SUA was negatively correlated with bone density. The somewhat consistency of the correlation of SUA across genders compared to other metabolic indicators suggests that it may be an important underlying regulator.
BMI has been widely recognized as an important predictor of BMD.33,34 This study also showed that BMI was significantly negatively correlated with bone density in both boys and girls. The similarity in the association patterns between SUA and BMI with bone density further suggests that SUA may influence children’s bone health through its interaction with BMI and other key factors.
However, this study also found that the association between SUA and BMD was weaker in girls compared to boys, and the multiple linear regression model showed a lower degree of fit in the girl subgroup. This gender-specific difference may be attributed to several biological factors. First, testosterone has been shown to upregulate xanthine oxidase activity, thereby increasing SUA production. This mechanism may contribute to higher SUA levels in boys and a stronger negative correlation between SUA and BMD.35 In contrast, higher estrogen levels in girls may protect bone health by inhibiting RANKL expression, thereby reducing bone resorption and partially offsetting the detrimental effects of SUA.36 Second, the boys in this study were, on average, older than the girls (9.68 years vs 8.88 years), suggesting a longer exposure to elevated SUA levels during the critical window of bone mass accumulation, which may amplify the adverse impact of SUA on BMD. Third, gender-based differences in body fat distribution are common among children with obesity. Boys are more prone to accumulate visceral fat, which is associated with higher levels of systemic inflammation. This pro-inflammatory state may act synergistically with uric acid to suppress bone formation.37,38
Regulation of BMD by SUA Under Age Stratification
Children’s growth and development exhibit significant age-related characteristics, with differences in physical development, metabolic levels, and endocrine regulation across age groups.39,40 Therefore, we analyzed BMD and related metabolic indicators in children with obesity using age stratification (6–9 years and 10–12 years). The results showed significant differences in BMD Z-scores between genders and age groups.
In this context, SUA was one of the few metabolic indicators that maintained a relatively good correlation with BMD Z-values across gender and age, and these correlations were negative. This consistency suggests that SUA may be a universal BMD regulatory factor across ages.
Further multiple linear regression analyses showed that after controlling for the effects of age and BMI, SUA remained significantly negatively correlated with BMD Z-scores, suggesting an independent effect on BMD. In boys, the negative correlation of SUA on BMD was more significant, which may be related to the relatively higher SUA levels and the more prominent characteristics of obesity-related metabolic disorders. In girls, although the influence of SUA on bone density was relatively weaker, it remained statistically significant.
Potential Mechanisms and Clinical Implications of SUA in Bone Health of Children with Obesity
The negative association between SUA and BMD in children with obesity may be explained by several interconnected pathological mechanisms, including impaired vitamin D metabolism, activation of inflammatory pathways, and inhibition of osteoblast function. First, SUA can directly inhibit the activity of renal 1α-hydroxylase, thereby reducing the conversion of 25(OH)D to its active form, leading to vitamin D deficiency. This deficiency may induce secondary hyperparathyroidism and reduce intestinal calcium absorption, ultimately impairing bone mineralization.41 Second, HUA may promote bone loss by activating inflammatory responses and enhancing osteoclast activity. In a high-SUA environment, SUA interacts with NADPH oxidase to increase superoxide production and activate pro-inflammatory pathways such as NF-κB and the NLRP3 inflammasome. This process triggers the release of cytokines such as IL-1, IL-6, and TNF-α, which, through the RANKL–RANK signaling system, promote osteoclast differentiation, proliferation, and activation, accelerating bone resorption. Concurrently, SUA suppresses key regulators of osteoblast differentiation and bone matrix formation, such as Wnt3a, Runx2, Osterix, Ibsp, and Bglap, and increases osteoblast apoptosis, thereby significantly impairing osteoblast activity and mineralization capacity. These mechanisms jointly disrupt normal bone metabolism, contributing to decreased BMD and increased risk of osteoporosis.42,43
As a common metabolic abnormality in children with obesity, HUA was further shown in this study to be an independent predictor of BMD reduction. Moreover, elevated SUA has been recognized as a marker of metabolically unhealthy obesity.44,45 Therefore, SUA screening may serve as a practical and cost-effective tool not only for assessing bone health but also for identifying multiple obesity-related complications in children.
Beyond its predictive value, the observed negative association between SUA levels and BMD highlights the potential clinical benefit of early SUA-lowering interventions. Current strategies include dietary modifications, lifestyle changes, and pharmacologic therapies. Dietary approaches involve reducing purine-rich food intake, avoiding excessive fructose-containing beverages, moderating total caloric intake, and improving dietary composition.46,47 Additionally, increasing the intake of calcium, vitamin D, and antioxidant-rich foods may help reduce SUA levels while supporting bone health.48 Physical activity contributes to improved energy balance and metabolic function and may indirectly reduce SUA by lowering insulin resistance.49 Pharmacologically, urate-lowering agents such as allopurinol and febuxostat have proven effective in adults, but the safety and long-term efficacy of these medications in children remain to be further established.50 Taken together, controlling SUA levels through rational diet, exercise, and medication may contribute positively to bone health in obese pediatric populations.
Conclusion
BMD in children with obesity shows significant differences across genders and age groups, suggesting that age- and gender-specific factors influence bone health. SUA is negatively correlated with bone density in boys with obesity across all age groups and in younger girls (6–9 years). Multivariate analysis further indicates that SUA is an independent factor affecting bone density, highlighting its potential as a universal predictor of bone density in children with obesity.
Abbreviations
SUA, serum uric acid; BMD, bone mineral density; HUA, hyperuricemia; FPG, fasting plasma glucose; HbAlc, glycosylated hemoglobin; Ca, calcium; P, phosphorus; ALP, alkaline phosphatase; 25(OH)D, 25-hydroxyvitamin D; BMI, body mass index; TC, total cholesterol; TG, triglycerides; LDL-C, low-density lipoprotein cholesterol; HDL-C, high-density lipoprotein cholesterol; FIN, fasting insulin; DXA, dual-energy X-ray absorptiometry.
Data Sharing Statement
The datasets analysed during the current study are available from the corresponding author on reasonable request.
Ethics Approval and Consent to Participate
Ethical approval for this study was obtained from the Beijing Jishuitan Hospital, Capital Medical University, Beijing, China (approval number: 201808-03). Written informed consent was obtained from the legal guardians of all participating children prior to data collection. All data were handled in compliance with applicable data protection regulations, and confidentiality was strictly maintained throughout the study. This study complies with the ethical principles outlined in the Declaration of Helsinki.
Acknowledgments
Thanks all the participants for their involvement in the study.
Author Contributions
All authors made a significant contribution to the work reported, whether that is in the conception, study design, execution, acquisition of data, analysis and interpretation, or in all these areas; took part in drafting, revising or critically reviewing the article; gave final approval of the version to be published; have agreed on the journal to which the article has been submitted; and agree to be accountable for all aspects of the work.
Funding
Project supported by special fund of the pediatric medical coordinated development center of Beijing hospitals authority, Grant/Award Number: XTZD20180401.
Disclosure
The authors declare that they have no competing interests in this work.
References
1. Hong Y, Ullah R, Wang JB, et al. Trends of obesity and overweight among children and adolescents in China. World J Pediatr. 2023;19(12):1115–1126. doi:10.1007/s12519-023-00709-7
2. Leung A, Wong A, Hon KL. Childhood Obesity: an Updated Review. Curr Pediatr Rev. 2024;20(1):2–26. doi:10.2174/1573396318666220801093225
3. Korkmaz HA, Ozkan B. Impact of obesity on bone metabolism in children. J Pediatr Endocrinol Metab. 2022;35(5):557–565. doi:10.1515/jpem-2021-0714
4. Firman N, Wilk M, Harper G, et al. Are children with obesity at school entry more likely to have a diagnosis of a musculoskeletal condition? Findings from a systematic review. BMJ Paediatr Open. 2022;6(1):e001528. doi:10.1136/bmjpo-2022-001528
5. Zhan H, Liu X, Piao S, et al. Association between triglyceride-glucose index and bone mineral density in US adults: a cross sectional study. J Orthop Surg Res. 2023;18(1):810. doi:10.1186/s13018-023-04275-6
6. Xie R, Huang X, Liu Q, et al. Positive association between high-density lipoprotein cholesterol and bone mineral density in U.S. adults: the NHANES 2011-2018. J Orthop Surg Res. 2022;17(1):92. doi:10.1186/s13018-022-02986-w
7. Qian Y, Kong YW, Wan NJ, et al. Associations between body mass index in different childhood age periods and hyperuricemia in young adulthood: the China health and nutrition survey cohort study. World J Pediatr. 2022;18(10):680–686. doi:10.1007/s12519-022-00573-x
8. Rao J, Ye P, Lu J, et al. Prevalence and related factors of hyperuricaemia in Chinese children and adolescents: a pooled analysis of 11 population-based studies. Ann Med. 2022;54(1):1608–1615. doi:10.1080/07853890.2022.2083670
9. Liu M, Cao B, Luo Q, et al. A gender-, age-, and weight status-specific analysis of the high prevalence of hyperuricemia among Chinese children and adolescents with obesity. Diabetes Metab Syndr Obes. 2024;17:381–391. doi:10.2147/DMSO.S448638
10. Yang K, Li J, Tao L. Purine metabolism in the development of osteoporosis. Biomed Pharmacother. 2022;155:113784. doi:10.1016/j.biopha.2022.113784
11. Shen L, Meng F, Jiang Q, et al. Association of serum uric acid level with bone mineral density and the risk of osteoporosis: a dose-response meta-analYSis. Int J Rheum Dis. 2025;28(1):e70013. doi:10.1111/1756-185X.70013
12. Li H, Ji CY, Zong XN, et al. Body mass index growth curves for Chinese children and adolescents aged 0 to 18 years. Zhonghua Er Ke Za Zhi. 2009;47(7):493–498.
13. Yu EW, Thomas BJ, Brown JK, et al. Simulated increases in body fat and errors in bone mineral density measurements by DXA and QCT. J Bone Miner Res. 2012;27(1):119–124. doi:10.1002/jbmr.506
14. Weber DR, Boyce A, Gordon C, et al. The utility of DXA assessment at the forearm, proximal femur, and lateral distal femur, and vertebral fracture assessment in the pediatric population: 2019 iscd official position. J Clin Densitom. 2019;22(4):567–589. doi:10.1016/j.jocd.2019.07.002
15. Kindler JM, Kalkwarf HJ, Lappe JM, et al. Pediatric reference ranges for ultradistal radius bone density: results from the bone mineral density in childhood study. J Clin Endocrinol Metab. 2020;105(10):e3529–e3539. doi:10.1210/clinem/dgaa380
16. Benova A, Tencerova M. Obesity-induced changes in bone marrow homeostasis. Front Endocrinol. 2020;11:294. doi:10.3389/fendo.2020.00294
17. Fintini D, Cianfarani S, Cofini M, et al. The bones of children with obesity. Front Endocrinol. 2020;11:200. doi:10.3389/fendo.2020.00200
18. Shawar RS, Puyau M, Shypailo R, et al. Adiposity, insulin resistance, cardiorespiratory fitness, and bone health in Hispanic children. J Clin Endocrinol Metab. 2022;107(9):e3797–e3804. doi:10.1210/clinem/dgac344
19. Szydlowska-Gladysz J, Gorecka AE, Stepien J, et al. IGF-1 and IGF-2 as molecules linked to causes and consequences of obesity from fetal life to adulthood: a systematic review. Int J Mol Sci. 2024;25(7):3966. doi:10.3390/ijms25073966
20. Huang Z, Huang L, Waters MJ, Chen C. Insulin and growth hormone balance: implications for obesity. Trends Endocrinol Metab. 2020;31(9):642–654. doi:10.1016/j.tem.2020.04.005
21. Dimitri P. The impact of childhood obesity on skeletal health and development. J Obes Metab Syndr. 2019;28(1):4–17. doi:10.7570/jomes.2019.28.1.4
22. Gallego SC, Singer BH, Gebremariam A, et al. The relationship between adiposity and bone density in U.S. children and adolescents. PLoS One. 2017;12(7):e181587.
23. Farr JN, Khosla S. Skeletal changes through the lifespan--from growth to senescence. Nat Rev Endocrinol. 2015;11(9):513–521. doi:10.1038/nrendo.2015.89
24. Lim JS, Hwang JS, Lee JA, et al. Bone mineral density according to age, bone age, and pubertal stages in Korean children and adolescents. J Clin Densitom. 2010;13(1):68–76. doi:10.1016/j.jocd.2009.09.006
25. Khosla S, Monroe DG. Regulation of bone metabolism by sex steroids. Cold Spring Harb Perspect Med. 2018;8(1):a031211. doi:10.1101/cshperspect.a031211
26. Xu K, Fu Y, Cao B, et al. Association of sex hormones and sex hormone-binding globulin levels with bone mineral density in adolescents aged 12-19 years. Front Endocrinol. 2022;13:891217. doi:10.3389/fendo.2022.891217
27. Mateo-Orcajada A, Abenza-Cano L, Cano-Martinez A, et al. The importance of healthy habits to compensate for differences between adolescent males and females in anthropometric, psychological and physical fitness variables. Children. 2022;9(12):1926. doi:10.3390/children9121926
28. Rodrick E, Kindler JM. Bone mass accrual in children. Curr Opin Endocrinol Diabetes Obes. 2024;31(1):53–59. doi:10.1097/MED.0000000000000849
29. Baxter-Jones A, Jackowski SA. Sex differences in bone mineral content and bone geometry accrual: a review of the paediatric bone mineral accural study (1991-2017). Ann Hum Biol. 2021;48(6):503–516. doi:10.1080/03014460.2021.2014568
30. Chailurkit LO, Suthutvoravut U, Mahachoklertwattana P, et al. Biochemical markers of bone formation in Thai children and adolescents. Endocr Res. 2005;31(3):159–169. doi:10.1080/07435800500371607
31. Ponce-Gonzalez JG, Guadalupe-Grau A, Rodriguez-Gonzalez FG, et al. Androgen receptor gene polymorphisms and the fat-bone axis in young men and women. J Androl. 2012;33(4):644–650. doi:10.2164/jandrol.111.014415
32. Medina-Gomez C, Heppe D, Yin JL, et al. Bone mass and strength in school-age children exhibit sexual dimorphism related to differences in lean mass: the generation R study. J Bone Miner Res. 2016;31(5):1099–1106. doi:10.1002/jbmr.2755
33. Ma W, Zhou X, Huang X, Xiong Y. Causal relationship between body mass index, type 2 diabetes and bone mineral density: Mendelian randomization. PLoS One. 2023;18(10):e290530. doi:10.1371/journal.pone.0290530
34. Wang GX, Fang ZB, Li HL, et al. Effect of obesity status on adolescent bone mineral density and saturation effect: a cross-sectional study. Front Endocrinol. 2022;13:994406. doi:10.3389/fendo.2022.994406
35. Wang Y, Charchar FJ. Establishment of sex difference in circulating uric acid is associated with higher testosterone and lower sex hormone-binding globulin in adolescent boys. Sci Rep. 2021;11(1):17323. doi:10.1038/s41598-021-96959-4
36. Almeida M, Laurent MR, Dubois V, et al. Estrogens and androgens in skeletal physiology and pathophysiology. Physiol Rev. 2017;97(1):135–187. doi:10.1152/physrev.00033.2015
37. Staiano AE, Katzmarzyk PT. Ethnic and sex differences in body fat and visceral and subcutaneous adiposity in children and adolescents. Int J Obes. 2012;36(10):1261–1269. doi:10.1038/ijo.2012.95
38. Gkastaris K, Goulis DG, Potoupnis M, et al. Obesity, osteoporosis and bone metabolism. J Musculoskelet Neuronal Interact. 2020;20(3):372–381.
39. Van Eyck A, Eerens S, Trouet D, et al. Body composition monitoring in children and adolescents: reproducibility and reference values. Eur J Pediatr. 2021;180(6):1721–1732. doi:10.1007/s00431-021-03936-0
40. Taranu I, Bolboaca SD, Cret V. Follow-up evaluation of association between weight changes, metabolic, and hormonal outcomes in children - a single-center pilot study. Folia Med. 2020;62(4):736–745. doi:10.3897/folmed.62.e51120
41. Chen W, Roncal-Jimenez C, Lanaspa M, et al. Uric acid suppresses 1 alpha hydroxylase in vitro and in vivo. Metabolism. 2014;63(1):150–160. doi:10.1016/j.metabol.2013.09.018
42. Xu R, Lian D, Xie Y, et al. Relationship between serum uric acid levels and osteoporosis. Endocr Connect. 2023;12(11). doi:10.1530/EC-23-0040
43. Lin KM, Lu CL, Hung KC, et al. The paradoxical role of uric acid in osteoporosis. Nutrients. 2019;11(9):2111. doi:10.3390/nu11092111
44. Rocha E, Vogel M, Stanik J, et al. Serum uric acid levels as an indicator for metabolically unhealthy obesity in children and adolescents. Horm Res Paediatr. 2018;90(1):19–27. doi:10.1159/000490113
45. Niu Y, Tang Q, Zhao X, et al. Obesity-induced insulin resistance is mediated by high uric acid in obese children and adolescents. Front Endocrinol. 2021;12:773820. doi:10.3389/fendo.2021.773820
46. Kong B, Liu F, Zhang S, et al. Associations between dietary patterns and serum uric acid concentrations in children and adolescents: a cross-sectional study. Food Funct. 2023;14(21):9803–9814. doi:10.1039/D3FO03043A
47. Ebrahimpour-Koujan S, Saneei P, Larijani B, et al. Consumption of sugar-sweetened beverages and serum uric acid concentrations: a systematic review and meta-analysis. J Hum Nutr Diet. 2021;34(2):305–313. doi:10.1111/jhn.12796
48. Isnuwardana R, Bijukchhe S, Thadanipon K, et al. Association between vitamin d and uric acid in adults: a systematic review and meta-analysis. Horm Metab Res. 2020;52(10):732–741. doi:10.1055/a-1240-5850
49. Krzystek-Korpacka M, Patryn E, Kustrzeba-Wojcicka I, et al. The effect of a one-year weight reduction program on serum uric acid in overweight/obese children and adolescents. Clin Chem Lab Med. 2011;49(5):915–921. doi:10.1515/CCLM.2011.130
50. Kubota M. Hyperuricemia in children and adolescents: present knowledge and future directions. J Nutr Metab. 2019;2019:3480718. doi:10.1155/2019/3480718
 © 2025 The Author(s). This work is published and licensed by Dove Medical Press Limited. The
full terms of this license are available at https://www.dovepress.com/terms.php
and incorporate the Creative Commons Attribution
- Non Commercial (unported, 4.0) License.
By accessing the work you hereby accept the Terms. Non-commercial uses of the work are permitted
without any further permission from Dove Medical Press Limited, provided the work is properly
attributed. For permission for commercial use of this work, please see paragraphs 4.2 and 5 of our Terms.
© 2025 The Author(s). This work is published and licensed by Dove Medical Press Limited. The
full terms of this license are available at https://www.dovepress.com/terms.php
and incorporate the Creative Commons Attribution
- Non Commercial (unported, 4.0) License.
By accessing the work you hereby accept the Terms. Non-commercial uses of the work are permitted
without any further permission from Dove Medical Press Limited, provided the work is properly
attributed. For permission for commercial use of this work, please see paragraphs 4.2 and 5 of our Terms.
Recommended articles
Overweight/Obese Status Synergistically Worsens Nocturnal Time-to-Time Blood Pressure in Children with Obstructive Sleep Apnea
Wu Y, Geng X, Xu Z, Ni X
Nature and Science of Sleep 2022, 14:1261-1271
Published Date: 15 July 2022
Associations of Obesity Indices with Bone Mineral Densities and Risk of Osteoporosis Stratified Across Diabetic Vascular Disease in T2DM Patients
Zheng S, Zhou J, Wang K, Wang X, Li Z, Chen N
Diabetes, Metabolic Syndrome and Obesity 2022, 15:3459-3468
Published Date: 3 November 2022
The Effectiveness of Indigenous Knowledge-Based Lifestyle Interventions in Preventing Obesity and Type 2 Diabetes Mellitus in Indigenous Children in Canada: A Systematic Review
Kshatriya M, Wang KW, Hildebrand J, Crawford R, Nadarajah A, Youssef M, Rivas A, Kaushal A, Banfield LE, Thabane L, Samaan MC
Adolescent Health, Medicine and Therapeutics 2023, 14:175-193
Published Date: 28 September 2023
Criteria in the Diagnosis of Metabolic Syndrome in Children: A Scoping Review

Díaz-Ortega JL, Yupari-Azabache IL, Caballero Vidal JA, Conde-Parada NE, Rojas Gamboa AF
Diabetes, Metabolic Syndrome and Obesity 2023, 16:3489-3500
Published Date: 3 November 2023
The Influence of Obesity on Bone Health in Post-COVID-19 Recovery- Single-Center Experience
Chaturvedi B, Debnath S, Bareth H, Raj P, Singh P, Singh M, Nathiya D, Tomar BS
International Journal of General Medicine 2024, 17:29-36
Published Date: 6 January 2024