")
Back to Journals » Diabetes, Metabolic Syndrome and Obesity » Volume 18
Correlation Analysis of Serum TYROBP Level and Metabolic Indexes of Obesity
Authors Xiao Z, Han G, Gao Y , Li G, He J, Li H, Liu X, Wang J, Yang C
Received 18 December 2024
Accepted for publication 14 July 2025
Published 18 July 2025 Volume 2025:18 Pages 2385—2397
DOI https://doi.org/10.2147/DMSO.S512731
Checked for plagiarism Yes
Review by Single anonymous peer review
Peer reviewer comments 3
Editor who approved publication: Professor Liang Wang
Zhaohui Xiao, Guiyan Han, Yu Gao, Guifen Li, Jianqiu He, Hongli Li, Xiaoyan Liu, Jie Wang, Chen Yang
Endocrinology Department, Affiliated Hospital of Chengde Medical College, Chengde, People’s Republic of China
Correspondence: Guiyan Han, Email [email protected]
Purpose: To investigate the relationship between TYRO protein tyrosine kinase-binding protein (TYROBP), a transmembrane immune signal transduction adaptor, and obesity-related metabolic parameters.
Patients and Methods: A total of 54 obese patients, 66 overweight subjects, and 54 normal weight subjects were selected from the Affiliated Hospital of Chengde Medical College from February 2023 to May 2024. Serum TYROBP levels were compared among the three groups, and their correlation with body fat content and other related indicators of body composition analysis was analyzed. The analysis included correlations between serum TYROBP level and human body composition analysis indicators, such as body fat content and obesity-related metabolic indicators: weight-adjusted waist index (WWI), body shape index (ABSI), lipid accumulation index (LAP), cardiometabolic index (CMI), body adiposity index (BAI), and atherogenic index of plasma (AIP).
Results: Serum TYROBP levels were significantly elevated in obese patients compared to both normal weight and overweight individuals (p< 0.05). Spearman’s or Pearson’s correlation analyses showed that serum TYROBP levels were positively correlated with age (r=0.232, p< 0.05) and glucose metabolism-related indicator FPG (r=0.39, p< 0.05). Positive correlations were also observed with lipid metabolism-related indicators TG (triglyceride)and TyG (triglyceride and glucose) (r=0.245,0.34,p< 0.05). Additionally, it was positively correlated with the following body composition analysis-related indicators: BMI (body mass index), basal metabolic rate (BMR), waist-hip ratio (WHR), obesity degree, skeletal muscle index (SMI), and visceral fat level (VFL)(r=0.25, 0.208, 0.166, 0.232, 0.231, 0.217, p< 0.05). Furthermore, positive correlations were identified with the following obesity-related metabolic indicators: LAP, CMI, BAI, and AIP (r=0.341, 0.307, 0.204, 0.282, p< 0.05). The results of multivariate logistic regression analysis showed that TYROBP (OR:5.455 [1.283– 23.185], p=0.022) was an independent risk factor for obesity (p< 0.05).
Conclusion: TYROBP is highly expressed in obese patients, indicating its potential as an independent risk factor for obesity and demonstrating diagnostic value for obesity with metabolic disorders.
Keywords: transmembrane immune adaptor, weight-adjusted waist index, WWI, skeletal muscle index, SMI, visceral fat level, VFL, atherogenic index of plasma, AIP
Introduction
The prevalence of overweight and obesity has increased in recent years, making obesity a significant public health problem worldwide.1,2 Obesity is a pathogenic factor in various chronic diseases, increasing the risk of type 2 diabetes mellitus, fatty liver disease, hypertension, myocardial infarction, cerebral infarction, osteoarthritis, obstructive sleep apnea, and malignant tumors.3–6 Obesity is the sixth major risk factor for mortality and disability in China.6 Currently, BMI is widely used in the diagnosis of obesity,2 but it cannot distinguish lean body mass from fat. Patients with normal BMI may still meet the diagnostic criteria for obesity but have metabolic abnormalities, which increase the risk of cardiovascular and cerebrovascular diseases. In a meta-analysis of 25 studies, among 31,968 adults, half of those with excessive body fat had a normal BMI.7 According to the ATP III criteria,7 individuals with metabolic syndrome are divided into metabolically healthy normal weight (MHNW), metabolically unhealthy normal weight (MUNW), metabolically healthy obesity (MHO), and metabolically unhealthy (MUO) obesity. Therefore, identifying high-risk populations with metabolic abnormalities, especially those with normal weight but with metabolic abnormalities, and intervening early is an important intervention measure to reduce the risk of chronic diseases related to obesity, such as cardiovascular and cerebrovascular diseases.
To assess the metabolic risk of obesity, a series of new indicators have been found to complement BMI in the assessment of obesity and its metabolic abnormalities. Unhealthy body composition in obese patients includes high fat mass, low muscle mass, and low bone mass; however, WWI can estimate fat and muscle mass components.8 Previous research has shown that WWI is positively correlated with fat mass and negatively correlated with muscle mass in the elderly.9 WWI is better than BMI and waist circumference.10 ABSI is an independent risk factor for non-alcoholic fatty liver disease (NAFLD).11 It is associated with an increased risk of cardiovascular diseases.12 LAP, a measure calculated from the waist circumference and triglyceride (TG) levels, reflects lipid toxicity and is valuable for NAFLD screening.13 A high LAP index can be used as an additional indicator of new-onset T2DM in middle-aged and elderly non-obese Koreans.14 CMI is a new obesity index closely related to the occurrence of diabetes, atherosclerosis, hypertension, and other diseases, making it an important tool for screening metabolic diseases.15 Elevated levels are associated with hepatic steatosis.15 CMI can be a useful and reliable index for detecting metabolic syndrome (MetS) in obese women.16 The BAI was originally developed as a surrogate for BMI,17 and when stratified by sex, the BAI provided higher accuracy in predicting the clinical obesity indicator (% fat).18 AIP is the log of the molar ratio of TG to HDL,19 which not only reflects the relationship between protective and pro-atherogenic lipoproteins but is also an effective predictor of atherosclerosis and coronary heart disease.20 Its expression is closely associated with obesity in patients with familial Mediterranean fever (FMF). Compared to other lipid components, it may be a potential biomarker for obesity.21 AIP has been reported to be negatively associated with vitamin D levels and positively associated with BMI, insulin resistance, and insulin levels and can be a useful predictor of fatty liver in obese adolescents.22
TYROBP, also known as 12-kDa DNAX-activating protein (DAP12), is a membrane-encoded adaptive protein for immune-related signal transduction that acts through the immune receptor activation motif of tyrosine.23 TYROBP is a transmembrane adaptor protein expressed in various immune cells, including T cells, B cells, and macrophages, and plays an important role in their activation.24 TYROBP binds non-covalently to activated receptors on the surface of various immune cells, and mediates signal transduction and cellular activation.25–27 Studies have demonstrated that TYROBP may play a dual role in the activation and inhibition of natural killer cells, myeloid cells, granulocytes, monocytes and other cells. When activated, it can activate natural killer cells and other immune inflammatory cells by activating PI3K-Akt, MAPK, PLCγ and its downstream signaling pathways. However, when inhibited, it may also lead to the inhibition of Toll-like receptor mediated activation, thereby inhibiting relevant inflammatory cells activation.28–30 Immune cell infiltration and correlation analysis revealed that there were significant positive correlations between TYROBP and M0 macrophages, CSF1R and M0 macrophages, Plasma cells, and CD8 T cells. TYROBP is associated with immune cells’ infiltration and may regulate their maintenance and differentiation, especially macrophage, in the low-grade inflammation stage of obese adipose tissue and thus promote adipose tissue dysfunction induced insulin resistance.31 Yan et al showed that TYROBP expression is significantly higher in the adipose tissue of obese patients and high-fat diet-fed mice than in controls.32,33 Furthermore, they observed that TYROBP expression decreased in obese patients after bariatric surgery (BS).33 TYROBP may play an important role in the development of obesity. However, its association with obesity and related metabolic abnormalities remains unknown. This study aimed to investigate the role of serum TYROBP level in the evaluation of metabolic abnormalities in obesity.
Materials and Methods
Subjects
A total of 174 patients who visited the Affiliated Hospital of Chengde Medical College from February 2023 to May 2024 were selected. According to BMI, they were divided into three groups: normal weight group (18.5≤BMI<24), overweight group (24≤BMI<28), and obesity group (BMI≥28). Metabolic syndrome was considered based on ATPIII criteria., the MS subjects were divided into four groups: 1) MHNW; 2) MUNW; 3) MHO; 4) MUO for subgroup analysis. Inclusion criteria: 1) Age≥18 years old; 2) Body composition analysis was performed; 3) able to fully understand and voluntarily sign the informed consent form. Exclusion criteria: 1) Combined with endocrine diseases leading to obesity, such as Cushing’s syndrome, uncorrected thyroid disease, etc.; 2) comorbid mental disorders; 3) Severe abnormal liver and kidney function, alanine aminotransferase (ALT)>120U/L, aspartate aminotransferase (AST)>120U/L, glomerular filtration rate (GFR)<90 mL/min or > 420 mL/min; 4) Medications that may affect weight or appetite, such as weight-loss drugs, corticosteroids, and antidepressants, have been used within the past 3 months; 5) the history of participating in clinical research on weight loss or any other weight loss therapy within the past 3 months; 6) Unable to cooperate with the study due to other diseases or reasons. This study was approved by the hospital’s Medical Ethics Committee (Medical Ethics Committee of the Affiliated Hospital of Chengde Medical University; ethics number:CYFYLL2024626), and the study subjects provided informed consent.This study strictly adheres to the ethical principles of the Declaration of Helsinki: the welfare of participants takes precedence over scientific objectives; the protocol has been approved by Medical Ethics Committee of the Affiliated Hospital of Chengde Medical University; ethics number:CYFYLL2024626); informed consent has been obtained with protection of privacy and autonomy; both negative and positive results will be publicly disclosed without ethical compromise.
General Information
General patient information was collected, including sex, age, smoking history (whether), drinking history (whether), and diabetes history (whether).
Collection of Specimens
All subjects fasted for over 12 hours overnight. The following morning, blood samples were drawn from the antecubital vein while participants were seated. The blood was kept at 4°C for 20 minutes, centrifuged at 3000 rpm for 10 minutes, and stored at −80°C until it was ready for testing.
Indicators of Observation
Anthropometric Measures
Height, weight, waist circumference, BMI; WWI, ABSI, LAP, CMI, BAI, AIP.
General Biochemical Indicators
Alanine aminotransferase (ALT), aspartate aminotransferase (AST), glomerular filtration rate (GFR), creatinine (Cr), thyroid stimulating hormone (TSH), free triiodothyronine (FT3), free thyroxine (FT4).
Indicators Related to Glucose and Lipid Metabolism
Fasting plasma glucose (FPG), Insulin resistance index (HOMA-IR), and HOMA-islet β cell function index (HOMA-islet). Triglyceride (TG), total cholesterol (TC), high-density lipoprotein cholesterol (HDL), low-density lipoprotein cholesterol (LDL), Apolipoprotein A (APOA), apolipoprotein B (APOB), triglyceride and glucose (TyG).
Body Composition Analysis-Related Indicators
Body fat percentage (PBF), basal metabolic rate (BMR), waist-to-hip ratio (WHR),obesity degree, skeletal muscle index (SMI), InBody score, and visceral fat grade (VFL).
Serum TYROBP Concentration Research Methods
Measurement of BIOCHEMICAL Indicators
Automatic biochemical analyzer (Eckman AU5800) was used for detection.
Calculate

Body Composition Analysis
PBF, BMR, WHR,obesity degree, SMI, InBody score, and VFL were measured using InBody (370S).
Serum TYROBP Levels
Serum TYROBP levels were detected using an enzyme-linked immunosorbent assay (ELISA). The kit was purchased from Hebei Beibo Laboratory Supplies Co. Ltd. (Item No. JL14649). The instrument was a Thermo Scientific Varioskan LUX multifunctional microplate reader. The absorbance value at 450 nm was measured, a standard curve was drawn, the expression level of TYROBP in serum samples was calculated, and the test operation was performed in strict accordance with the manufacturer’s instructions.
Statistical Analysis
SPSS 27.0 was used for statistical analysis. Measurement data with normal distribution were expressed as mean±standard deviation (). Measurement data with a skewed distribution were described as M (Q25,Q75), and count data were described as N (%). One-way analysis of variance was used for comparison between groups with normal distribution. The Kruskal–Wallis H-test was used for comparison between groups with non-normal distribution. Spearman or Pearson correlation analysis was used to analyze the correlation between serum TYROBP and other clinical parameters. Univariate linear regression was used to analyze the relationship between TYROBP and body mass index (BMI), waist-to-hip ratio (WHR), obesity degree, skeletal muscle index, visceral fat grade, LAP, CMI, BAI, and AIP. Multivariate Logistic Regression was used to analyze the influencing factors of TYROBP. p<0.05 was considered statistically significant.
Results
Comparison of General Information
No significant differences were observed in sex, age, smoking, drinking, and diabetes among the obese, overweight, and normal weight groups (p>0.05). ALT levels were higher in the obese and overweight groups than in the normal group (p<0.05) (Table 1).
 |
Table 1 Baseline Characteristics of Three Groups |
Overweight and Obese Patients Had Higher Metabolism-Related Indexes
Compared with the normal control group, the obese group had higher WWI and ABSI values (p<0.05). The LAP, CMI, BAI, and AIP levels were significantly higher in the obese and overweight groups (p < 0.05). Compared to the overweight group, the obese group had higher WWI, ABSI, LAP, CMI, BAI, and AIP (p<0.05). The results showed that the metabolism-related indices were higher in overweight and obese patients, suggesting a higher likelihood of metabolic abnormalities (Table 1).
Obese and Overweight Patients Have Higher Glucose and Lipid Metabolism-Related Indicators
Homa-IR and TyG levels were significantly higher in the obese and overweight groups than in the normal control group (p<0.05). The lipid metabolism index TG level was higher (p< 0.05), while HDL and APOA levels were lower (p<0.05). Homa-IR, TyG, and TG levels were significantly higher in the obese group than in the overweight group (p< 0.05). Insulin resistance appears prominent in obese patients, with abnormalities in the metabolism of TG, HDL, and APOA. FBG, TC, and APOB levels were not statistically different among the three groups (Table 1).
Comparison of Body Composition Analysis Indicators
The PBF of the obese group was higher than that of the normal group (p<0.05). BMR, WHR, obesity degree, SMI, and VFL were higher in the obese and overweight groups (p<0.05). The InBody scores of the obese and overweight groups were significantly lower (p<0.05). PBF, BMR, WHR, obesity degree, SMI, and VFL were higher in the obese group than in the overweight group (p<0.05). The InBody scores were significantly lower (p<0.05). This suggests that body fat and visceral fat contents were higher in the overweight and obese groups (Table 2).
 |
Table 2 Body Composition Analysis Data of Three Groups |
TYROBP Is Positively Correlated with Glucose and Lipid Metabolism Indexes
Using FPG, TyG, and TG as dependent variables and TYROBP as an independent variable, a one-way linear regression analysis was conducted. The results showed that TYROBP was positively correlated with the sugar metabolism-related indicator FPG (a) and the lipid metabolism-related indicators TG (b) and TyG (c) (Figure 1).
 |
Figure 1 Using FPG (a),TG (b),TyG (c),BMI (d), obesity degree (e), VFL (f), WHR (g), SMI (h),LAP (i), CMI (j), BAI (k), and AIP (l) as dependent variables and TYROBP as an independent variable, a one-way linear regression analysis was conducted.The results showed: TYROBP is positively correlated with glucose and lipid metabolism indexes;TYROBP is positively correlated with body composition parameters;TYROBP is positively correlated with obesity-related metabolic parameters. |
TYROBP Is Positively Correlated with Body Composition Parameters
Using BMI, obesity degree, VFL, WHR, and SMI as dependent variables and TYROBP as independent variables. One-way linear regression analysis showed that TYROBP was positively correlated with BMI (d), obesity degree (e), VFL (f), WHR (g), and SMI (h) (Figure 1).
TYROBP Is Positively Correlated with Obesity-Related Metabolic Parameters
Using LAP, CMI, BAI, and AIP as dependent variables and TYROBP as an independent variable, a one-way linear regression analysis was conducted. TYROBP was positively correlated with LAP (i), CMI (j), BAI (k), and AIP (l) (Figure 1).
Multiple Linear Regression Analysis
Excluding the effects of FPG, TG, and age, TYROBP was correlated with BMI, WHR, obesity degree, SMI, VFL, LAP, CMI, and BAI (β0.03, 0.982, 0.006, 0.094, 0.02, 0.004, 0.225, 0.023, p<0.05) were still positively correlated (Table 3).
 |
Table 3 Multivariate Linear Regression Analysis of TYROBP |
TYROBP May Be an Independent Risk Factor for Obesity
Serum TYROBP levels were significantly elevated in obese patients compared to both normal weight and overweight individuals (p<0.05) (Figure 2).To determine the correlation between TYROBP and BMI in obese patients, multivariate logistic regression analysis was performed. TYROBP (OR:5.455 [1.283–23.185], p=0.022) was an independent risk factor for obesity after adjusting for sex, age, TC, TG, HDL, LDL, APOA, APOB, and TyG (p<0.05) (Table 4).
 |
Table 4 Multivariable Logistic Regression Analysis of TYROBP |
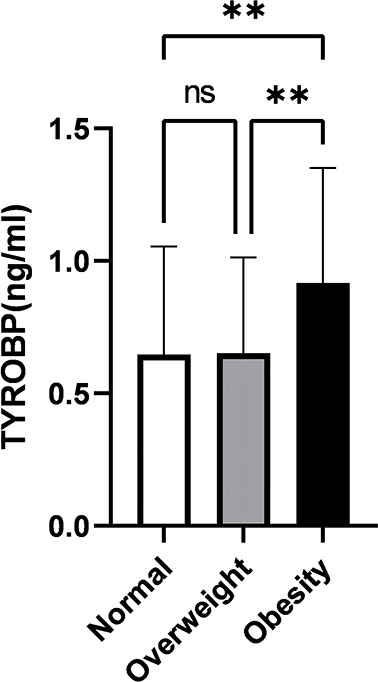 |
Figure 2 Demonstrated the serum TYROBP expression levels across respective population groups. The results showed: Demonstrated the serum TYROBP expression levels across respective population groups.**:p<0.01. |
TYROBP Can Early Detect Patients with Normal Body Weight but Metabolic Abnormalities
To investigate whether TYROBP is associated with metabolic abnormalities in obesity, individuals were divided into four groups according to ATP III criteria: MHNW, MUNW, MHO, and MUO. The Kruskal–Wallis H-test was performed. The results showed that MUNW, MHO, and MUO individuals all had higher TYROBP, CMI, and AIP levels compared to MHNW individuals (p<0.05). ABSI, BAI, WWI, and LAP levels were higher in MHO and MUO individuals than in MHNW and MUNW individuals (p<0.05). Serum TYROBP levels in patients with normal weight and metabolic disorders were significantly higher than in patients without metabolic disorders (MHNW vs MHNW vs MUNW, p<0.05). Serum TYROBP levels were significantly lower in obese patients with normal metabolism than in those with abnormal metabolism (MHO vs MHO vs MUO, p<0.05). These results suggest that serum TYROBP levels can be used for the early detection of patients with normal body weight but metabolic abnormalities and that early diagnosis and intervention can compensate for the deficiency of BMI in the diagnosis and evaluation of obesity (Figure 3 and Table 5).
 |
Table 5 Baseline Characteristics of Four Groups |
 |
Figure 3 Individuals were divided into four groups according to ATP III criteria: MHNW, MUNW, MHO, and MUO.The results showed:Serum TYROBP levels were significantly lower in obese patients with normal metabolism than in those with abnormal metabolism.*p<0.05; **p<0.01; ***p<0.001; ****p<0.0001. |
Discussion
Obesity is a chronic metabolic disease that emerged as one of the world’s leading causes of disability and death and is usually diagnosed by measuring body mass index (BMI) and waist circumference.34 Obesity contributes to the development of many metabolic diseases, highlighting the importance of identifying therapeutic targets.
Zhang et al have shown that TYROBP plays a key role in the development of obesity.31 TYROBP expression is significantly higher in the adipose tissues of obese patients and high-fat diet-fed mice than in controls.32,33 In obese patients, TYROBP expression decreases after BS.33 Jiang Y, Zhang R et al showed that TYROBP can be used as a therapeutic biomarker for obesity.32 The present study found that serum TYROBP levels were higher in the obese group compared with the normal and overweight groups. At the same time, we conducted a linear regression analysis of TYROBP, FPG, TG, and TyG. The results showed that TYROBP is positively correlated with the glucose metabolism-related index FPG. It was positively correlated with lipid metabolism-related indicators such as TG and TyG. To further clarify the effect of TYROBP on obesity, multivariate logistic regression analysis was performed in this study. After adjusting for sex, age, TC, TG, HDL, LDL, APOA, APOB, and TyG, TYROBP is still an independent risk factor for obesity. These results suggest that TYROBP may play an important role in the pathogenesis of obese patients. However, basic experiments are still required to determine how TYROBP affects obesity.
Body composition measurements not only indicate systemic nutritional status and health status but also provide valuable information for the diagnosis and treatment of various diseases, whose quality and distribution are closely related to the health status of people of all ages.35 Therefore, we further analyzed the relationship between TYROBP and body composition analysis-related indicators: BMI, WHR, obesity degree, SMI, and VFL. After multiple linear regression analysis, the results showed that after excluding the effects of FPG, TG, and age, TYROBP was still positively correlated with WHR, obesity degree, SMI, and VFL. These findings suggest that TYROBP may act as a central hub in the metabolic-immune interaction network. The positive correlation between TYROBP and obesity degree indicates its potential involvement in systemic obesity-related pathological processes, such as chronic low-grade inflammation. While elevated skeletal muscle index (SMI) is typically associated with metabolic health, its concurrent increase with TYROBP levels may reflect two distinct scenarios: 1. Compensatory muscle hyperplasia: Muscle hypertrophy occurs in response to insulin resistance under chronic inflammatory conditions. 2. Pathological remodeling: Intramuscular fat infiltration (intermuscular adipose tissue) accompanied by inflammatory activation promotes TYROBP expression. The positive correlations between TYROBP and both waist-to-hip ratio (WHR) and visceral fat level (VFL) suggest that elevated TYROBP may directly increase the risk of metabolic syndrome (MetS), type 2 diabetes mellitus (T2DM), and cardiovascular disease (CVD) by promoting visceral fat accumulation through mechanisms such as: Enhanced adipocyte differentiation, Inhibition of lipolysis.TYROBP could serve as a biomarker for visceral obesity, aiding in the identification of metabolically unhealthy normal weight (MUNW) individuals.
Some obesity-related metabolic indicators have emerged in recent years: WWI, ABSI, LAP, CMI, BAI, and AIP. The relationship between TYROBP and these obesity-related metabolic parameters was analyzed. In the present study, the WWI and ABSI levels were higher in the obese group than in the normal control group. The levels of LAP, CMI, BAI, and AIP were higher in the obese and overweight groups. Abolnezhadian F et al showed that individuals with metabolically unhealthy phenotypes (MUO, MUNW) had higher triglyceride and cardiovascular index (AIP,BMI, CMI) levels than those with metabolically healthy phenotypes (MHO, MHNW). With similar levels of obesity, the metabolically unhealthy group had higher levels of anthropometric indices (BAI,WWI, WHR) than the metabolically healthy group. Therefore, we investigated the relationship between TYROBP and obesity-related metabolic indicators. After excluding the effects of FPG, TG, and age, TYROBP was positively correlated with LAP, CMI, and BAI levels. TYROBP may be a potential diagnostic marker for metabolic abnormalities in obesity.
Obesity is often associated with a range of metabolic abnormalities; these include insulin resistance, prediabetes, atherosclerotic dyslipidemia, nonalcoholic fatty liver disease, and metabolic syndrome. However, not all obese patients have metabolic complications.36 Smith et al showed that, compared to individuals with a metabolically healthy phenotype, individuals with metabolically unhealthy phenotypes are at an increased risk of cardiovascular disease.36 To investigate whether TYROBP could predict metabolic abnormalities in obese patients, participants were divided into four groups based on ATP III criteria. Our results show that MUNW, MHO, and MUO individuals had higher TYROBP, CMI, and AIP levels than MHNW individuals. ABSI, BAI, WWI, and LAP levels of MHO and MUO were higher than those of MHNW and MUNW. These results suggest that serum TYROBP level can be used for early detection of patients with normal body weight but metabolic abnormalities. Therefore, TYROBP is of great significance for the early diagnosis and intervention of metabolic abnormalities in obesity. However, when grouped according to ATP III criteria, the number of samples varied widely among the four groups. We should further increase the sample size in the future to investigate the relationship between TYROBP and obesity with metabolic disorders.Furthermore, it is essential to investigate the TYROBP signaling pathways in both adipose and immune tissues.
The current study has some limitations.The total sample size was small, and no further follow-up study was performed on the patients. Future studies need to expand the sample size and dynamically evaluate the relationship between serum TYROBP levels, obesity, and metabolic disorders.This study lacks longitudinal data to establish causality or the potential for residual confounding.
Conclusion
TYROBP, body composition analysis-related indicators (WHR, obesity degree, SMI, and VFL), and obesity metabolism-related indicators (LAP, CMI, BAI, and AIP) were positively correlated; serum TYROBP levels were higher in obese patients. Simultaneously, serum TYROBP may serve as an independent risk factor for obesity and play a crucial role in the early diagnosis and intervention of metabolic abnormalities associated with obesity.
Abbreviations
ABSI, a Body Shape Index; AIP, atherogenic index of plasma; ALT, alanine aminotransferase; APOA, apolipoprotein A; APOB, apolipoprotein B; AST, aspartate aminotransferase; BAI, body adiposity index; BMI, body Mass Index; BMR, basal metabolic rate; CMI,cardiometabolic index; Cr, creatinine; FPG, fasting plasma glucose; FT3, free triiodothyronine; FT4, free thyroxine; GFR, glomerular filtration rate; HDL, high density lipoprotein cholesterol; HOMA-islet, HOMA-islet β cell function index; HOMA-IR; Insulin resistance index; LAP, lipid accumulation product; LDL, low density lipoprotein cholesterol; MHNW, metabolically healthy normal weight; MHO, metabolically healthy obesity; MUNW, metabolically unhealthy normal weight; MUO, metabolically unhealthy; PBF, body fat percentage; SMI, skeletal muscle index; TC, total cholesterol; TG, triglycerides; TyG, triglyceride glucose; TSH, thyroid stimulating hormone; VFL, visceral fat grade; WHR, waist-to-hip ratio; WWI, weight-adjusted waist index.
Acknowledgments
Acknowledgments to the Chengde Municipal-Level Science and Technology Program Project ID:202404B083
Disclosure
The authors report no conflicts of interest in this work.
References
1. Ahmed B, Sultana R, Greene MW. Adipose tissue and insulin resistance in obese. Biomed Pharmacother. 2021;137:111315. doi:10.1016/j.biopha.2021.111315
2. Gjermeni E, Kirstein AS, Kolbig F, et al. Obesity–an update on the basic pathophysiology and review of recent therapeutic advances. Biomolecules. 2021;11(10):1426. doi:10.3390/biom11101426
3. Safaei M, Sundararajan EA, Driss M, Boulila W, Shapi’i A. A systematic literature review on obesity: understanding the causes & consequences of obesity and reviewing various machine learning approaches used to predict obesity. Comput Biol Med. 2021;136:104754. doi:10.1016/j.compbiomed.2021.104754
4. Matthias B. Obesity: global epidemiology and pathogenesis. Nat Rev Endocrinol. 2019;15(5):288–298. doi:10.1038/s41574-019-0176-8
5. Rohde K, Keller M, la Cour Poulsen L, Blüher M, Kovacs P, Böttcher Y. Genetics and epigenetics in obesity. Metabolism. 2019;92:37–50. doi:10.1016/j.metabol.2018.10.007
6. Murray CJL, Aravkin AY, Zheng P, et al. Global burden of 87 risk factors in 204 countries and territories, 1990–2019: a systematic analysis for the Global Burden of Disease Study 2019. Lancet. 2020;396(10258):1223–1249.
7. Abolnezhadian F, Hosseini SA, Alipour M, et al. Association metabolic obesity phenotypes with cardiometabolic index, atherogenic index of plasma and novel anthropometric indices: a link of FTO-rs9939609 polymorphism. Vasc Health Risk Manag. 2020;16:249–256. doi:10.2147/VHRM.S251927
8. Kim KJ, Son S, Kim KJ, Kim SG, Kim NH. Weight‐adjusted waist as an integrated index for fat, muscle and bone health in adults. J Cachexia Sarcopenia Muscle. 2023;14(5):2196–2203. doi:10.1002/jcsm.13302
9. Park Y, Kim NH, Kwon TY, Kim SG. A novel adiposity index as an integrated predictor of cardiometabolic disease morbidity and mortality. Sci Rep. 2018;8(1):16753. doi:10.1038/s41598-018-35073-4
10. Guo M, Lei Y, Liu X, Li X, Xu Y, Zheng D. The relationship between weight-adjusted-waist index and total bone mineral density in adults aged 20–59. Front Endocrinol. 2023;14:1281396. doi:10.3389/fendo.2023.1281396
11. Kuang M, Sheng G, Hu C, Lu S, Peng N, Zou Y. The value of combining the simple anthropometric obesity parameters, Body Mass Index (BMI) and a Body Shape Index (ABSI), to assess the risk of non-alcoholic fatty liver disease. Lipids Health Dis. 2022;21(1):104. doi:10.1186/s12944-022-01717-8
12. Mirzababaei A, Abaj F, Khosravinia D, et al. The mediatory effect of inflammatory markers on the association between a body shape index and body roundness index with cardiometabolic risk factor in overweight and obese women: a cross-sectional study. Front Nutr. 2023;10:1178829. doi:10.3389/fnut.2023.1178829
13. Ebrahimi M, Seyedi SA, Nabipoorashrafi SA, et al. Lipid accumulation product (LAP) index for the diagnosis of nonalcoholic fatty liver disease (NAFLD): a systematic review and meta-analysis. Lipids Health Dis. 2023;22(1):41. doi:10.1186/s12944-023-01802-6
14. Yang SH, Yoon J, Lee YJ, Park B, Jung DH. Lipid accumulation product index predicts new-onset type 2 diabetes among non-obese Koreans: a 12-year longitudinal study. Diabetes Metab Syndr Obes. 2022;Volume 15:3729–3737. doi:10.2147/DMSO.S389889
15. Cheng L, Wu Q, Wang S. Association between cardiometabolic index and hepatic steatosis and liver fibrosis: a population-based study. Hormones. 2024;23:1–10. doi:10.1007/s42000-023-00523-w
16. Lazzer S, D’Alleva M, Isola M, et al. Cardiometabolic index (CMI) and visceral adiposity index (VAI) highlight a higher risk of metabolic syndrome in women with severe obesity. J Clin Med Res. 2023;12(9):3055.
17. Bergman RN, Stefanovski D, Buchanan TA, et al. A better index of body adiposity. Obesity. 2011;19(5):1083–1089. doi:10.1038/oby.2011.38
18. Fedewa MV, Nickerson BS, Esco MR. Associations of body adiposity index, waist circumference, and body mass index in young adults. Clin Nutr. 2019;38(2):715–720. doi:10.1016/j.clnu.2018.03.014
19. Dobiasova M. AIP--atherogenic index of plasma as a significant predictor of cardiovascular risk: from research to practice. Vnitrni lekarstvi. 2006;52(1):64–71.
20. Sabarinathan M, Ds DR, Ananthi N, Krishnan M. Atherogenic index of plasma, lipid accumulation and visceral adiposity in metabolic syndrome patients. Bioinformation. 2022;18(11):1109. doi:10.6026/973206300181109
21. Göğebakan H, Kaşali K. The correlation of plasma atherogenic index and obesity in patients with familial Mediterranean fever. Clin Rheumatol. 2022;41(11):3471–3477. doi:10.1007/s10067-022-06312-x
22. Dağ H, Incirkuş F, Dikker O. Atherogenic index of plasma (AIP) and its association with fatty liver in obese adolescents. Children. 2023;10(4):641. doi:10.3390/children10040641
23. Kobayashi M, Konishi H, Takai T, Kiyama H. A DAP12‐Dependent signal promotes pro‐inflammatory polarization in microglia following nerve injury and exacerbates degeneration of injured neurons. Glia. 2015;63(6):1073–1082. doi:10.1002/glia.22802
24. Haure-Mirande JV, Audrain M, Ehrlich ME, Gandy S. Microglial TYROBP/DAP12 in Alzheimer’s disease: transduction of physiological and pathological signals across TREM2. Mol Neurodegener. 2022;17(1):55. doi:10.1186/s13024-022-00552-w
25. Lanier LL, Corliss B, Wu J, Phillips JH. Association of DAP12 with activating CD94/NKG2C NK cell receptors. Immunity. 1998;8(6):693–701. doi:10.1016/S1074-7613(00)80574-9
26. Lanier LL, Corliss BC, Wu J, Leong C, Phillips JH. Immunoreceptor DAP12 bearing a tyrosine-based activation motif is involved in activating NK cells. Nature. 1998;391(6668):703–707. doi:10.1038/35642
27. Dietrich J, Cella M, Seiffert M, Bühring HJ, Colonna M. Cutting edge: signal-regulatory protein beta 1 is a DAP12-associated activating receptor expressed in myeloid cells. J Immunol. 2000;164(1):9–12. doi:10.4049/jimmunol.164.1.9
28. Turnbull I, Colonna M. Activating and inhibitory functions of DAP12. Nat Rev Immunol. 2007;7(2):155–161. doi:10.1038/nri2014
29. Takaki R, Watson S, Lanier LL. DAP12: an adapter protein with dual functionality. Immunol Rev. 2006;214:118–129. doi:10.1111/j.1600-065X.2006.00466.x
30. Ouchon A, Dietrich J, Colonna M. Cutting edge: inflammatory responses can be triggered by TREM-1, a novel receptor expressed on neutrophils and monocytes. J Immunol. 2000;164(10):4991–4995. doi:10.4049/jimmunol.164.10.4991
31. Zhai M, Luan P, Shi Y, et al. Identification of three significant genes associated with immune cells infiltration in dysfunctional adipose tissue‐induced insulin‐resistance of obese patients via comprehensive bioinformatics analysis. Int J Endocrinol. 2021;2021(1):8820089. doi:10.1155/2021/8820089
32. Jiang Y, Zhang R, Guo JQ, et al. Identification of major hub genes involved in high-fat diet-induced obese visceral adipose tissue based on bioinformatics approach. Adipocyte. 2023;12(1):2169227. doi:10.1080/21623945.2023.2169227
33. Yan K, Zhang P, Jin J, et al. Integrative analyses of hub genes and their association with immune infiltration in adipose tissue, liver tissue and skeletal muscle of obese patients after bariatric surgery. Adipocyte. 2022;11(1):190–201. doi:10.1080/21623945.2022.2060059
34. Jabłonowska-Lietz B, Wrzosek M, Włodarczyk M, Nowicka G. New indexes of body fat distribution, visceral adiposity index, body adiposity index, waist-to-height ratio, and metabolic disturbances in the obese. Kardiol Pol. 2017;75(11):1185–1191. doi:10.5603/KP.a2017.0149
35. Chomtho S, Fewtrell MS, Jaffe A, Williams JE, Wells J. Evaluation of arm anthropometry for assessing pediatric body composition: evidence from healthy and sick children. Pediatr Res. 2006;59(6):860–865. doi:10.1203/01.pdr.0000219395.83159.91
36. Smith GI, Mittendorfer B, Klein S. Metabolically healthy obesity: facts and fantasies. J Clin Invest. 2019;129(10):3978–3989. doi:10.1172/JCI129186
 © 2025 The Author(s). This work is published and licensed by Dove Medical Press Limited. The
full terms of this license are available at https://www.dovepress.com/terms.php
and incorporate the Creative Commons Attribution
- Non Commercial (unported, 4.0) License.
By accessing the work you hereby accept the Terms. Non-commercial uses of the work are permitted
without any further permission from Dove Medical Press Limited, provided the work is properly
attributed. For permission for commercial use of this work, please see paragraphs 4.2 and 5 of our Terms.
© 2025 The Author(s). This work is published and licensed by Dove Medical Press Limited. The
full terms of this license are available at https://www.dovepress.com/terms.php
and incorporate the Creative Commons Attribution
- Non Commercial (unported, 4.0) License.
By accessing the work you hereby accept the Terms. Non-commercial uses of the work are permitted
without any further permission from Dove Medical Press Limited, provided the work is properly
attributed. For permission for commercial use of this work, please see paragraphs 4.2 and 5 of our Terms.