")
Back to Journals » Clinical Ophthalmology » Volume 18
Correlation of Macular Ganglion Cell Layer + Inner Plexiform Layer (GCL + IPL) and Circumpapillary Retinal Nerve Fiber Layer (cRNFL) Thickness in Glaucoma Suspects and Glaucomatous Eyes
Authors San Pedro MJB , Sosuan GMN , Yap-Veloso MIR
Received 25 October 2023
Accepted for publication 19 June 2024
Published 20 August 2024 Volume 2024:18 Pages 2313—2325
DOI https://doi.org/10.2147/OPTH.S439501
Checked for plagiarism Yes
Review by Single anonymous peer review
Peer reviewer comments 2
Editor who approved publication: Dr Scott Fraser
Marie Jeremy B San Pedro,1 George Michael N Sosuan,1,2 Maria Imelda R Yap-Veloso1– 3
1Asian Eye Institute, PHINMA Plaza, Rockwell Center, Makati, Philippines; 2University of the Philippines Manila-Philippine General Hospital, Department of Ophthalmology and Visual Sciences, Metro Manila, Philippines; 3Rizal Medical Center, Department of Ophthalmology, Pasig, Philippines
Correspondence: Marie Jeremy B San Pedro, Email [email protected]
Purpose: The study aimed to correlate macular ganglion cell layer + inner plexiform layer (GCL + IPL) thickness and circumpapillary retinal nerve fiber layer (cRNFL) thickness and to determine the validity of GCL + IPL in the evaluation of glaucoma across different stages using the area under the curve (AUC) analysis in comparison to cRNFL.
Patients and Methods: The charts of 260 adult glaucoma suspect and glaucoma patients having macular ganglion cell analysis, optical coherence tomography (OCT) of the cRNFL and automated visual field (AVF) were reviewed. GCL + IPL thickness (average, minimum and sectoral) and sectoral cRNFL thickness were obtained. Glaucomatous eyes were further classified into stages based on the Hodapp-Anderson-Parrish Visual Field Criteria of Glaucoma Severity. AUC analysis was used to compare GCL + IPL parameters with cRNFL in glaucoma suspects and glaucoma patients.
Results: A total of 122 eyes were included in the study and were grouped into glaucoma suspects (n = 43), early or mild glaucoma (n = 40), and moderate-to-severe glaucoma (n = 39). Both GCL + IPL and cRNFL thickness parameters showed a significant decline with greater glaucoma severity. In the determination of visual field defects across all glaucoma stages, the highest AUC was obtained by minimum GCL + IPL (AUC = 0.859) with cut-off value at ≤ 70 μm. Average GCL + IPL had the highest AUC (0.835) in detecting progression from glaucoma suspect to mild glaucoma, while the inferior sector of the cRNFL had the highest AUC (0.937) in discerning mild from moderate-to-severe glaucoma.
Conclusion: The results of this study highlight the significance of macular ganglion cell analysis in the screening, detection and staging of glaucoma. Compared to cRNFL, macular ganglion analysis may be more beneficial in glaucoma screening and detecting progression from glaucoma suspect to mild glaucoma.
Keywords: macular ganglion cell analysis, macular ganglion cell layer, inner plexiform layer, retinal nerve fiber layer, GCL + IPL
Introduction
Glaucoma is a progressive optic neuropathy associated with structural and functional deficits. Structural deficits can be measured by thinning of the circumpapillary retinal nerve fiber layer (cRNFL) as well as the thinning or loss of the ganglion cell complex (GCC), while functional deficits are evaluated by visual field defects. Structural changes precede functional deficits. Approximately 30–50% of the retinal ganglion cells (RGC) may be lost before any detectable visual field changes can occur.1
The ganglion cell complex (GCC) is composed of the three innermost retinal layers, namely the retinal nerve fiber layer (RNFL), retinal ganglion cell layer (GCL), and inner plexiform layer (IPL), which correspond to the axons, cell bodies, and dendrites of the RGC, respectively.2 In previous studies, it has been shown that GCC and GCL + IPL measurements have the capacity to diagnose pre-perimetric glaucoma and early glaucoma similar to the cRNFL.3–5 A recent study by Mahmoudinezhad (2023) showed that GCL and GCL + IPL are equivalent for identifying early or mild glaucoma.6 The Cirrus Optical Coherence Tomography (Cirrus HD-OCT, Carl Zeiss Meditec, Dublin CA) measures the GCL + IPL thickness within a 14.13-mm2 elliptical annulus area centered on the fovea. The use of GCL + IPL in the latest ganglion cell analysis algorithm aims to diminish the effect of nerve fiber layer measurements, wherein the distribution in the macula is highly dependent on individual anatomy, in comparison to GCL + IPL, which tends to be more homogeneous.7
The concept of macular ganglion cell analysis for glaucoma diagnosis is not well studied in the Southeast Asian Regions relative to cRNFL thinning in determining structural deficits in perimetric glaucoma or as a tool to diagnose pre-perimetric glaucoma. Macular ganglion cell analysis may also be useful in detecting glaucoma among patients with optic nerve anomalies, myopic optic disc changes, and severe glaucoma. In the Philippines, only one published article3 has been found to appraise the validity of measuring macular GCL thickness as an indicator of early glaucoma, as compared to the measurement of cRNFL thickness. This study, however, did not assess the utility of macular ganglion cell analysis for moderate-to-severe glaucoma. Our study compared the GCL + IPL and cRNFL thickness parameters in glaucoma suspects and across mild to moderate-to-severe glaucoma stages and filled in the gap in knowledge.
Objectives
The general objective of the study was to correlate GCL + IPL thickness and cRNFL thickness in glaucoma suspects and across the different stages of glaucoma based on the Hodapp-Anderson-Parrish Criteria for visual field evaluation. Specifically, the study aimed to
- Determine the validity of GCL + IPL and cRNFL parameters in glaucoma screening by correlation of the presence or absence of visual field defects and GCL + IPL and cRNFL parameters using AUC analysis;
- Determine the validity of GCL + IPL parameters as an indicator of glaucoma severity from glaucoma suspect to early glaucoma and consequently to moderate-to-severe glaucoma using AUC analysis in comparison to cRNFL.
Materials and Methods
Study Design
The study was a single-center, retrospective, cross-sectional study design, including data from January 2021 to December 2021 at the Asian Eye Institute, Makati, Philippines.
Ethical Considerations
Approval from the St. Cabrini Medical Center – Asian Eye Institute Ethics Review Committee was obtained prior to the conduction of the study (ERC#2022-02, February 5, 2022). The study was designed and conducted in accordance with the principles of the Declaration of Helsinki and Good Clinical Practice. Informed consent was waived due to the retrospective nature of the study. In compliance with data privacy, all data collection materials did not include any of the participants’ names, while paper data collection forms were stored so that only the primary investigator had access to them. Programs or electronic material containing participant data were password-protected. The master list matching participant names and number codes was kept by the principal investigator. No conflict of interest exists among the investigators, which may affect the outcome of the study.
Study Population
We reviewed 260 charts of glaucoma suspects and glaucoma patients wherein both macular ganglion cell analysis and cRNFL evaluation were done using Cirrus HD-OCT (5000, Carl Zeiss Meditec, Dublin, CA, USA), as well as 24–2 SITA Standard Automated Visual Field (AVF) using Humphrey Field Analyzer (720i, Carl Zeiss Meditec, Dublin, CA, USA). The OCT of the macular ganglion cell analysis (signal strength ≥7) and cRNFL (signal strength ≥7), as well as visual field tests with good reliability (<20% fixation losses, false positive and false negative responses) were included in the study. Exclusion criteria included the presence of retinal pathology/macular pathology, media opacity, ocular inflammation, optic neuropathy other than glaucoma, age <40 years, and error of refraction greater than +6.00 D hyperopia or −6.0 D myopia with a cylinder correction within ±3.0 D.
The eyes were grouped into glaucoma suspects or glaucomatous eyes. Glaucomatous eyes were further classified into mild or moderate-to-severe groups based on Hodapp-Anderson-Parrish Visual Field Criteria of Glaucoma Severity.
Glaucomatous eyes were defined as having 2 or more out of the following (1) optic nerve changes described as cup disc ratio >0.5, focal rim notching, focal cRNFL thinning, or vertical elongation of the optic cup (2) intraocular pressure >21 mmHg or (3) visual field deficits. Glaucoma suspects were defined as having either optic nerve changes or elevated intraocular pressure >21 mmHg in the absence of glaucomatous visual field defects.
A glaucomatous visual field defect was defined as (1) a cluster of 3 points with probabilities of <5% on the pattern deviation map in at least 1 hemifield, including at least 1 point with a probability of <1% or a cluster of 2 points with a probability of <1%, (2) glaucomatous hemifield test results outside of normal limits, or (3) a pattern standard deviation beyond 95% of normal limits.
Staging of glaucoma was done using Hodapp-Anderson-Parrish Visual Field Criteria of Glaucoma Severity. In addition to having optic nerve changes as described previously and/or intraocular pressure >21 mmHg, mild glaucoma was defined as having early visual field changes, while moderate and severe glaucoma was defined as having moderate and severe visual field defects, respectively (Figure 1).
 |
Figure 1 Hodapp-Anderson-Parrish Visual Field Criteria of Glaucoma Severity. |
The charts of glaucoma suspects and glaucoma patients that satisfied the inclusion criteria were retrieved for data collection. Data from one or two eyes were included in the study. Baseline characteristics such as age, gender, nationality, intraocular pressure, and optic nerve cup-to-disc ratio were recorded. Mean deviation (dB), pattern standard deviation (dB), and visual field index (VFI) were also recorded. Average GCL + IPL, minimum GCL + IPL thickness, GCL + IPL measurements from the superior (GCL + IPL S), superonasal (GCL + IPL SN), superotemporal (GCL + IPL ST), inferior (GCL + IPL I), inferonasal (GCL + IPL IN), and inferotemporal (GCL + IPL IT) sectors as well as cRNFL thickness in the superior (cRNFL S, cRNFL SN, cRNFL ST), inferior (cRNFL I, cRNFL IN, cRNFL IT), nasal (cRNFL N, cRNFL NU, cRNFL NL) and temporal (cRNFL T, cRNFL TU, cRNFL TL) sectors were obtained (Figures 2 and 3).
 |
Figure 2 Ganglion Cell Layer + Inner Plexiform Layer (GCL + IPL) Sectors. |
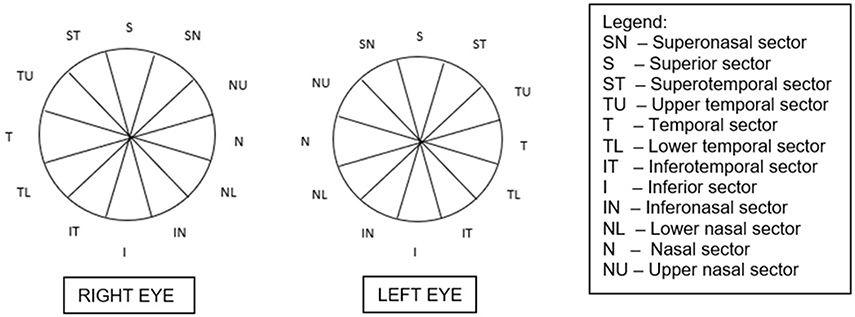 |
Figure 3 Circumpapillary Retinal Nerve Fiber Layer (cRNFL) Sectors. |
Statistical Analysis
Sample Size
The sample size was computed using the G*Power. The effect size (correlation between two variables) used was based on a study titled “Structure/Function relationship and retinal ganglion cell counts to discriminate glaucomatous damages” by Distante et al. According to this, there is a good correlation between cRNFL thickness and the inner macular retina (GCC) with a correlation coefficient equal to 0.85. However, the computed effect size was above the effect size convention of G*Power (effect size convention: 0.100, 0.300, 0.500) thus, the nearest effect size used was 0.500 instead. The computed sample size was 58 eyes with a power of analysis equal to 99.09%.
Data Analysis
Given that the baseline and clinical characteristics of the patients were not normally distributed, median and interquartile ranges (IQR) were used to describe the data. These data were age, Mean Deviation (MD), Pattern Standard Deviation (PSD), and Visual Field Index (VFI).
Ordinal Logistic Regression Analysis was used to correlate GCL + IPL and cRNFL across different stages of glaucoma. The process produced an odds ratio and 95% confidence interval. The parameters we chose to correlate were as follows: cRNFL S, cRNFL SN, cRNFL ST, cRNFL I, cRNFL IN, cRNFL IT, cRNFL N, cRNFL NU, cRNFL NL, cRNFL T, cRNFL TU, cRNFL TL, minimum GCL + IPL, average GCL + IPL, GCL + IPL S, GCL + IPL SN, GCL + IPL ST, GCL + IPL I, GCL + IPL IN and GCL + IPL IT. (Figures 2 and 3)
AUC analysis was used to compare the findings of macular GCL + IPL thickness changes with cRNFL changes in glaucoma suspects and glaucoma patients. The process also produced sensitivity, specificity, positive predictive value (PPV), and negative predictive value (NPV). All data were analyzed using the Statistical Program for the Social Sciences (SPSS, Chicago, IL) version 8.0.
Results
A total of 122 eyes were included in this study. The median age of the patients was 69 (62 to 75.75) years old. The median of the highest IOP recorded for each patient (with or without medications) was 20 mmHg (17 mmHg to 22 mmHg), and the median cup-to-disc ratio (CDR) of the optic nerve was 0.70 (0.60 to 0.75) (Table 1). Fifty-seven percent of the population were males, while 43% were females. Ninety-one percent of the population were Filipinos, while the rest belonged to the Japanese, Korean, Chinese, Indian, and British races.
 |
Table 1 Baseline Characteristics of Patients (N = 122) |
Visual field defects were classified into none (n = 43; 35%), mild (n = 40; 33%), and moderate-to-severe groups (n = 39; 32%) based on the Hodapp-Anderson-Parrish Criteria (Table 2). The computed median and interquartile range (IQR) of the different clinical variables of the study are presented in Table 2.
 |
Table 2 Clinical Variables of the Study |
Table 3 shows the correlation of GCL + IPL and cRNFL across different stages of glaucoma. Odds ratio was used to describe the correlation of GCL + IPL and cRNFL in relation to glaucoma severity, while the p-value was used to determine whether the correlation is significant or not. An odds ratio below 1.0 indicates that an event (greater glaucoma field defect severity) is less likely to happen, while an odds ratio above 1.0 indicates that an event is more likely to happen. A p-value below 0.05 is an indication of a significant correlation, while a p-value above 0.05 means an insignificant correlation.
 |
Table 3 Correlation of Ganglion Cell Layer + Inner Plexiform Layer (GCL + IPL) and Circumpapillary Retinal Nerve Fiber Layer (cRNFL) Across Different Stages of Glaucoma |
In our study, macular ganglion cell analysis significantly correlated with glaucoma field defect severity with p-values below 0.05. The results showed patients with thicker average GCL + IPL, minimum GCL + IPL thickness, and sectoral GCL + IPL (superior, superonasal, superotemporal, inferior, inferonasal, and inferotemporal) were less likely to have greater glaucoma field defect severity (odds ratio <1.0).
For the cRNFL, superior (S, SN, ST P = 0.00), inferior (I, IN, IT P = 0.00), nasal (N, NL P = 0.00), and temporal sectors (TU P =, 0.001 TL P = 0.00) also showed a significant decline with greater glaucoma severity, while the strength of association in terms of odds ratio varied from 0.83 to 0.97. This means that patients with thicker S, SN, ST, I, IN, IT, N, NL, TU, and TL were less likely to have greater glaucoma field defect severity. The rest of the variables (NU, T) were not significant with p-values above 0.05.
Table 4 shows the validity of GCL + IPL as an indicator of the presence of visual field defects from early to moderate-to-severe glaucoma in comparison to cRNFL using AUC analysis. The results showed that minimum GCL + IPL, average GCL + IPL, GCL Sectors (S, SN, ST, I, IN, IT), and cRNFL in terms of S, SN, ST, I, IN, IT, T, TU, and TL were significant predictors of glaucoma field defect with AUCs above 0.60 and a p-value below 0.05. An AUC above 0.500 is desirable as it indicates a good predictability of the test variable against the reference standard.
 |
Table 4 Validity of Ganglion Cell Layer + Inner Plexiform Layer (GCL + IPL) as an Indicator of Visual Field Defect using Area Under the Curve (AUC) Analysis in Comparison to cRNFL |
Sensitivity is the probability that a glaucoma field defect will occur when a cut-off value of an independent variable has been met. Specificity is the probability that a glaucoma field defect will not occur when the value of an independent variable goes outside the cut-off value. The PPV is the probability of the presence of glaucoma field defect than its absence when the value of an independent variable goes within the cut-off value. The NPV is the probability of the absence of glaucoma field defect than its presence when the value of an independent variable goes outside the cut-off value. Increasing sensitivity leads to a higher false positive rate, which can decrease the positive predictive value of a test.
Out of all the parameters tested for the detection of glaucoma field defect (both GCL + IPL and cRNFL), minimum GCL + IPL with a cut-off value ≤70 µm showed the highest AUC value (0.859), followed by average GCL + IPL with cut-off value ≤73 µm (AUC = 0.846). Among the GCL + IPL sectors, the IN sector obtained the highest AUC (AUC = 0.835; cut-off value ≤70 µm). All AUCs for the GCL + IPL parameters had AUC > 0.8. In addition, the inferonasal GCL + IPL sector with a cut-off value of ≤70 µm has the highest specificity (100%) and PPV (100%) for glaucoma field defect determination, while the inferotemporal GCL + IPL sector had the highest sensitivity (86%) and NPV (74%) with a cut-off value of ≤70 µm. On the other hand, AUCs for cRNFL parameters were variable from 0.526 to 0.782, wherein the highest values (>0.70) were obtained by cRNFL I (AUC = 0.782; cut-off value ≤117 µm), cRNFL IT (AUC = 0.782; cut-off value ≤126 µm), cRNFL ST (AUC = 0.734; cut-off value ≤0.734 µm), and cRNFL S (AUC = 0.722; cut-off value ≤91 µm), in descending order.
For the determination of glaucoma severity using macular ganglion cell analysis, average GCL + IPL, minimum GCL + IPL thickness, and sectoral GCL + IPL (superior, superonasal, superotemporal, inferior, inferonasal, and inferotemporal), all have AUCs > 0.5 with p-values below 0.05. The AUCs were nearer to 1.00 which indicates that these parameters were able to correctly discriminate consecutive glaucoma stages, from glaucoma suspect to early glaucoma and early glaucoma to moderate-to-severe glaucoma. The highest AUCs were obtained by the average GCL + IPL (0.835) followed by the superonasal (0.832) and superior (0.831) GCL + IPL sectors in the determination of progression from glaucoma suspect to mild glaucoma (Table 5).
 |
Table 5 Area Under the Curve (AUC) Values of Ganglion Cell Layer + Inner Plexiform Layer (GCL + IPL) and Circumpapillary Retinal Nerve Fiber Layer (cRNFL) Parameters for Discriminating Consecutive Glaucoma Stages |
For the correlation of glaucoma severity and cRNFL parameters, cRNFL S, cRNFL SN, and cRNFL NU sectors were able to discriminate early glaucoma to moderate-to-severe glaucoma but failed to distinguish glaucoma suspect from early glaucoma. Alternatively, the AUC of the temporal cRNFL T and cRNFL TL sectors were only able to discriminate glaucoma suspect from early glaucoma but not early glaucoma from moderate-to-severe glaucoma. The following sectors ST, I, IN, IT, NU, and TU were all able to correctly discriminate consecutive glaucoma stages, glaucoma suspect from early glaucoma and early glaucoma from moderate-to-severe glaucoma. In the determination of severity of mild versus moderate-to-severe glaucoma, highest AUC was obtained by the inferior cRNFL sector, specifically cRNFL I (0.937), followed by cRNFL IT (0.907). (Table 5)
Discussion
Macular ganglion cell analysis in terms of GCL + IPL thickness has been reported in recent years to be valuable in the screening of early glaucoma and determination of glaucoma progression. While published articles had reported comparable value of GCL + IPL to cRNFL analysis in glaucoma diagnosis,8–11 evidence of earlier structural loss of GCL + IPL compared to cRNFL,12 lesser OCT structural floor effect of GCL + IPL in severe glaucoma,13 the better diagnostic ability of GCL + IPL in high myopia,14 and the ability of GCL + IPL to differentiate glaucomatous from non-glaucomatous optic neuropathy15 are all in favor of the utility of GCL + IPL as an adjunct to glaucoma diagnosis. In addition, macular ganglion cell analysis may also overcome the limitations of cRNFL thickness analysis, including retinal and optic nerve head vasculature interference, peripapillary atrophy, and variable placement of the measurement circle around the disc.16,17
In stable glaucoma patients, macular ganglion cell analysis (GCL + IPL and deviation maps) was found to have good inter-visit reproducibility, making it a good indicator of glaucoma progression.18 The results showed that patients with thicker average GCL + IPL, minimum GCL + IPL thickness, and sectoral GCL + IPL (superior, superonasal, superotemporal, inferior, inferonasal, and inferotemporal) were less likely to have greater glaucoma field defect severity (odds ratio < 1.0); similarly, patients with thicker cRNFL S, SN, ST, I, IN, IT, N, NL, TU, and TL were less likely to have greater glaucoma field defect severity.
Based on the AUC analysis, results showed that all GCL + IPL parameters including minimum GCL + IPL, average GCL + IPL, sectoral GCL + IPL with AUCs > 0.80 had an overall better ability to discriminate between glaucoma suspects and glaucomatous eyes compared to cRNFL parameters (AUCs 0.526–0.782) in terms of the absence or presence of visual field defects. In glaucoma screening for visual field defects, the highest AUC was obtained by minimum GCL + IPL (0.859), followed by average GCL + IPL (0.846) with cut-off values at ≤70 µm and ≤73 µm, respectively. In addition, macular ganglion cell analysis parameters had an overall better ability to discriminate progression from glaucoma suspect to early glaucoma based on obtained AUC values. The highest AUC was obtained by average GCL + IPL (0.835), followed by superior GCL + IPL sector (0.831). The results indicate the significance of GCL + IPL parameters in glaucoma screening and detection of early glaucoma.
In a study by Ustaoglu (2018),19 GCL + IPL, cRNFL and optic nerve parameters had the ability to discriminate early glaucoma compared to moderate-to-severe glaucoma, highlighting minimum GCL + IPL, average cRNFL, and rim area (AUC = 0.900, 0.858, 0.768, respectively) as the best parameters for discriminating the two groups. Comparing glaucoma suspects from early glaucoma, however, the minimum GCL + IPL, inferotemporal, and inferonasal GCL + IPL parameters discriminated early glaucoma patients from glaucoma suspects, while cRNFL and ONH measurements had lower AUCs and did not distinguish the two groups. In a similar study by Jeoung et al, the AUC of minimum GCL + IPL thickness in the detection of early glaucoma was significantly greater than cRNFL (P = 0.03). In addition, the AUC of minimum GCL + IPL thickness was greater than that of average cRNFL thickness, but the difference was not significant (P = 0.80).20 Similar to the findings of Ustaoglu (2018) and Jeoung et al, our study highlights the utility of GCL + IPL in early glaucoma diagnosis. The results are in contrast with the findings of Aquino (2020) wherein higher AUC was obtained by average cRNFL thickness (0.655) compared to average GCL + IPL thickness (0.572) in determining progression from glaucoma suspect to early glaucoma.3
In a group of healthy individuals and glaucoma patients classified as having visual field defect of at least > −6.0 dB mean deviation, Nouri-Mahdavi et al found out that average cRNFL thickness performed better than average GCL + IPL measurements for detection of glaucoma (AUC = 0.964 vs 0.937; p = 0.04). In addition, they reported that inferior quadrant cRNFL and minimum GCL + IPL are comparable in glaucoma detection.21
Based on the results of our study, both cRNFL and GCL + IPL parameters are good indicators of severity of mild versus moderate-to-severe glaucoma with all AUCs > 0.5. In the GCL + IPL group, the highest AUC value was obtained by the inferotemporal GCL + IPL sector (0.860), followed by the minimum GCL + IPL (0.811). On the other hand, the highest AUC value for the cRNFL group was obtained by inferior cRNFL sector (0.937), followed by the inferotemporal cRNFL sector (0.907). Overall, the inferior cRNFL sector had the highest AUC (0.937) among all the parameters as an indicator for glaucoma severity from mild versus moderate-to-severe. This is also similar to the results of Jeoung et al wherein the highest AUCs were obtained by inferior cRNFL sector (AUC = 0.958) and inferior quadrant cRNFL/average cRNFL (0.958) in the cRNFL group. However, in their study, the AUC of minimum GCL + IPL (0.960) was comparable to that of inferior sectoral cRNFL and inferior quadrant/average cRNFL. Bambo et al also reported that GCL + IPL performed as well as cRNFL across different glaucoma stages. According to their study, inferior macular GCL + IPL sectors, minimum GCL + IPL thickness, and the inferior cRNFL quadrant best differentiate disease severity and correlate with central visual function and VF indexes.22 Our results were similar to the findings of Jeoung et al and Bambo et al, wherein inferior cRNFL sector (for the cRNFL group), inferior/inferotemporal GCL + IPL and minimum GCL + IPL (for the GCL + IPL group) were identified as the best parameters to differentiate disease severity from mild versus moderate-to-severe glaucoma. In our study, however, our results suggest that the inferior cRNFL sector is a better indicator for mild versus moderate-to-severe glaucoma severity compared to GCL + IPL parameters in terms of AUC values.
Limitations of the Study
The results of the study are based on a specific population wherein inclusion and exclusion criteria were set. These results may be true only for the adult population since normative cRNFL and GCL + IPL thickness for pediatric population still need to be established. In addition, these results may only be true in patients without retina or inflammatory pathology and without optic nerve pathology other than glaucoma, and in patients with refractive errors within +6.00 D hyperopia or −6.0 D myopia with a cylinder correction within ±3.0 D. Furthermore, statistical analysis with correction for age of GCL + IPL and cRNFL parameters throughout the different glaucoma stages can also be done.
Conclusion
The study highlights the role of macular ganglion cell analysis as a screening tool in the discernment of glaucoma patients from glaucoma suspects, as well as for monitoring disease progression, comparable to cRNFL parameters. Compared to cRNFL, macular ganglion analysis may be more beneficial in glaucoma screening and detecting progression from glaucoma suspect to mild glaucoma.
Abbreviations
AUC, area under the curve; AVF, automated visual field; CDR, cup disc ratio; cRNFL, circumpapillary retinal nerve fiber layer; dB, decibel; GCC, ganglion cell complex; GCL + IPL, ganglion cell layer + inner plexiform layer; IQR, interquartile range; MD, mean deviation; NPV, negative predictive value; OCT, optical coherence tomography; PPV, positive predictive value; PSD, pattern standard deviation; RGC, retinal ganglion cells; RNFL, retinal nerve fiber layer; VFI, visual field index.
Data Sharing Statement
The datasets used and analyzed in the current study are available from the corresponding author on reasonable request.
Acknowledgments
The abstract of this paper was presented as a poster at the World Glaucoma Congress last June 28 – July 1 2023 (Rome, Italy) and has never been published in any other journals. The authors thank the Asian Eye Institute for support and guidance in making this paper.
Author Contributions
All authors made a significant contribution to the work reported, whether that is in the conception, study design, execution, acquisition of data, analysis and interpretation, or in all these areas; took part in drafting, revising or critically reviewing the article; gave final approval of the version to be published; have agreed on the journal to which the article has been submitted; and agree to be accountable for all aspects of the work.
Funding
The authors have shouldered the expenses with no external assistance.
Disclosure
The authors report no conflicts of interest in this work.
References
1. Kim YJ, Kang MH, Cho HY, Lim HW, Seong M. Comparative study of macular ganglion cell complex thickness measured by spectral-domain optical coherence tomography in healthy eyes, eyes with preperimetric glaucoma, and eyes with early glaucoma. Jpn J Ophthalmol. 2014;58:244–251. doi:10.1007/s10384-014-0315-7
2. Distante P, Lombardo S, Vercellin ACV, et al. Structure/Function relationship and retinal ganglion cells counts to discriminate glaucomatous damages. BMC Ophthalmology. 2015;15:185. doi:10.1186/s12886-015-0177-x
3. Aquino L, Aquino N. Evaluation of macular ganglion cell layer thickness vs peripapillary retinal nerve fiber layer thickness for glaucoma detection using spectral-domain optical coherence tomography in a tertiary Philippine hospital. J Curr Glaucom Pract. 2020;14(2):50–56. doi:10.5005/jp-journals-10078-1278
4. Meshi A, Goldenberg D, Armarnik S, Segal O, Geffen N. Systematic review of macular ganglion cell complex analysis using spectral domain optical coherence tomography for glaucoma assessment. World J Ophthalmol. 2015;5(2):86–98. doi:10.5318/wjo.v5.i2.86
5. Scuderi G, Fragiotta S, Scuderi L, Iodice CM, Perdicchi A. Ganglion cell complex analysis in glaucoma patients: what can it tell us? Eye Brain. 2020;2:33–44. doi:10.2147/EB.S226319
6. Mahmoudinezhad G, Mohammadzadeh V, Martinyan J, et al. Comparison of ganglion cell layer and ganglion cell/inner plexiform layer measures for detection of early glaucoma. Ophthalmol Glaucoma. 2023;6(1):58–67. doi:10.1016/j.ogla.2022.06.008
7. Francoz M, Fenolland JR, Giraud JM, et al. Reproducibility of macular ganglion cell–inner plexiform layer thickness measurement with cirrus HD-OCT in normal, hypertensive and glaucomatous eyes. Br J Ophthalmol. 2014;98:322–328. doi:10.1136/bjophthalmol-2012-302242
8. Kotowski J, Folio LS, Wollstein G, et al. Glaucoma discrimination of segmented cirrus spectral domain optical coherence tomography (SD-OCT) macular scans. Br J Ophthalmol. 2012;96(11):1420–1425. doi:10.1136/bjophthalmol-2011-301021
9. Deshpande G, Bawankule P, Raje D, Chakraborty M, Gupta R. Structural evaluation of perimetrically normal and affected hemifields in open angle glaucoma. Indian J Ophthalmol. 2019;67(10):1657–1662. doi:10.4103/ijo.IJO_1755_18
10. Kim HJ, Lee SY, Park KH, Kim DM, Jeoung JW. Glaucoma diagnostic ability of layer-by-layer segmented ganglion cell complex by spectral-domain optical coherence tomography. Invest Ophthalmol Visual Sci. 2016;57:4799–4805. doi:10.1167/iovs.16-19214
11. Mwanza JC, Durbin MK, Budenz DL, et al. Glaucoma diagnostic accuracy of ganglion cell–inner plexiform layer thickness: comparison with nerve fiber layer and optic nerve head. Ophthalmology. 2012;119(6):1151–1158. doi:10.1016/j.ophtha.2011.12.014
12. Kim YK, Jeoung JW, Park KH. Inferior macular damage in glaucoma: its relationship to retinal nerve fiber layer defect in macular vulnerability zone. J Glaucoma. 2017;26:126–132. doi:10.1097/IJG.0000000000000576
13. Bowd C, Zangwill LM, Weinreb RN, Medeiros FA, Belghith A. Estimating OCT structural measurement floors to improve detection of progression in advanced glaucoma. Am J Ophthalmol. 2017;175:37–44. doi:10.1016/j.ajo.2016.11.010
14. Shoji T, Nagaoka Y, Sato H, Chihara E. Impact of high myopia on the performance of SD-OCT parameters to detect glaucoma. Graefes Arch Clin Exp Ophthalmol. 2012;250:1843–1849. doi:10.1007/s00417-012-1994-8
15. Lee J, Kim YK, Park KH, et al. Temporal raphe sign for discrimination of glaucoma from optic neuropathy in eyes with macular ganglion cell inner plexiform layer thinning. Ophthalmology. 2019;19:1–9. doi:10.1186/s12886-018-1008-7
16. Tatham AJ, Medeiros FA, Zangwill FM, Weinreb RA. Strategies to improve early diagnosis in glaucoma. Prog Brain Res. 2015;2015:221.
17. Hood DC, Raza AS, de Moraes CGV, Liebmann JM, Ritch R. Glaucomatous damage of the macula. Prog Retinal Eye Res. 2013;32:1–21. doi:10.1016/j.preteyeres.2012.08.003
18. Kim KE, Yoo BW, Jeoung JW, Park KH. Long-term reproducibility of macular ganglion cell analysis in clinically stable glaucoma patients. Invest Ophthalmol Visual Sci. 2015;56:4857–4864. doi:10.1167/iovs.14-16350
19. Ustaoglu M, Solmaz N, Onder F. Discriminating performance of macular ganglion cell inner plexiform layer thicknesses at different stages of glaucoma. Int J Ophthalmol. 2019;12(3):464–471. doi:10.18240/ijo.2019.03.18
20. Jeoung JW, Choi YJ, Park KH, Kim DM. Macular ganglion cell imaging study: glaucoma diagnostic accuracy of spectral-domain optical coherence tomography. Invest Ophthalmol Vis Sci. 2013;54:4422–4429. doi:10.1167/iovs.12-11273
21. Nouri-Mahdavi K, Nowroozizadeh S, Nassiri N, et al. Macular ganglion cell/inner plexiform layer measurements by spectral domain optical coherence tomography for detection of early glaucoma and comparison to retinal nerve fiber layer measurements. Am J Ophthalmol. 2013;156(6):1297–1307.e2. PMID: 24075422; PMCID: PMC3834195. doi:10.1016/j.ajo.2013.08.001
22. Bambo MP, Güerri N, Ferrandez B, et al. Evaluation of the macular ganglion cell-inner plexiform layer and the circumpapillary retinal nerve fiber layer in early to severe stages of glaucoma: correlation with central visual function and visual field indexes. Ophthalmic Res. 2017;57(4):216–223. doi:10.1159/000453318
 © 2024 The Author(s). This work is published and licensed by Dove Medical Press Limited. The
full terms of this license are available at https://www.dovepress.com/terms.php
and incorporate the Creative Commons Attribution
- Non Commercial (unported, 3.0) License.
By accessing the work you hereby accept the Terms. Non-commercial uses of the work are permitted
without any further permission from Dove Medical Press Limited, provided the work is properly
attributed. For permission for commercial use of this work, please see paragraphs 4.2 and 5 of our Terms.
© 2024 The Author(s). This work is published and licensed by Dove Medical Press Limited. The
full terms of this license are available at https://www.dovepress.com/terms.php
and incorporate the Creative Commons Attribution
- Non Commercial (unported, 3.0) License.
By accessing the work you hereby accept the Terms. Non-commercial uses of the work are permitted
without any further permission from Dove Medical Press Limited, provided the work is properly
attributed. For permission for commercial use of this work, please see paragraphs 4.2 and 5 of our Terms.