")
Back to Journals » Journal of Hepatocellular Carcinoma » Volume 12
Decoding ARF4 and EIF5B-Based Prognostic Signatures and Immune Landscape Following Insufficient Radiofrequency Ablation in Hepatocellular Carcinoma: Through Multi-Omics and Experimental Validation
Authors Zhang Y , Lu Y, Zheng S, Luo W, Tan M , Luo B
Received 14 January 2025
Accepted for publication 16 April 2025
Published 9 May 2025 Volume 2025:12 Pages 909—931
DOI https://doi.org/10.2147/JHC.S517528
Checked for plagiarism Yes
Review by Single anonymous peer review
Peer reviewer comments 3
Editor who approved publication: Dr Ali Hosni
Yixin Zhang,1,* Yongpan Lu,2,* Sui Zheng,1,* Wanrong Luo,1 Min Tan,1 Baoming Luo1
1Department of Ultrasound, Sun Yat-sen Memorial Hospital, Sun Yat-sen University, Guangzhou, Guangdong, 510120, People’s Republic of China; 2Department of Anorectal Surgery, The Affiliated Hospital of Qingdao University, Qingdao, Shandong, 266000, People’s Republic of China
*These authors contributed equally to this work
Correspondence: Baoming Luo, Department of Ultrasound, Sun Yat-sen Memorial Hospital, Sun Yat-sen University, No. 33 Yingfeng Road, Guangzhou, Guangdong, People’s Republic of China, Email [email protected]
Background: Radiofrequency ablation (RFA) is pivotal in non-surgical hepatocellular carcinoma (HCC) treatments but poses a high postoperative recurrence risk, exceeding conventional surgeries. Insufficient tumor ablation may trigger immune responses, promoting tumor progression locally. Hence, this study seeks to pinpoint immune biomarkers to improve treatment precision and prognostic accuracy for RFA patients.
Methods: The study utilized data from The Cancer Genome Atlas (TCGA), Gene Expression Omnibus (GEO), and The International Cancer Genome Consortium (ICGC) database to investigate novel immune biomarkers influencing the prognosis of patients undergoing insufficient radiofrequency ablation (IRFA). Subsequently, an IRFA model was developed and validated. Then, we employed Quantitative real time-Polymerase Chain Reaction (qPCR), Western blotting (WB), immunohistochemistry (IHC), and immunofluorescence (IF) techniques on human HCC cell lines and IRFA animal model to validate ADP-ribosylation factor 4 (ARF4) and Eukaryotic translation initiation factor 5B (EIF5B) expression and prognostic relevance post-IRFA. In addition, knockdown of ARF4 and EIF5B was performed to evaluate cell proliferation, migration, invasion, and epithelial-mesenchymal transition (EMT). Finally, transcriptome sequencing was subsequently performed to confirm and extend our findings.
Results: ARF4 and EIF5B were identified as critical immune targets affecting IRFA patient prognosis, forming the basis of an IRFA risk model. High-risk scores in this model correlated with poorer prognoses and reduced responsiveness to immune checkpoint inhibitors (ICIs) across multiple cancer types. Experimental validations confirmed the protective role of ARF4 and EIF5B in IRFA outcomes, while knockdown experiments suggested their involvement in promoting cell proliferation, migration, invasion, and EMT in IRFA models, potentially through pathways like P53 and Transforming Growth Factor Beta(TGF-β) signaling pathway activation as indicated by transcriptome sequencing.
Conclusion: ARF4 and EIF5B have demonstrated promising potential as biomarkers influencing patient prognosis following RFA in HCC. These findings suggest they could serve as viable therapeutic targets aimed at mitigating HCC recurrence post-RFA.
Keywords: inadequate radiofrequency ablation, HCC, ARF4, EIF5B, biomarker
Graphical Abstract:

Introduction
A thermal ablation technique, RFA has been recommended by some organizations, including the European Association for the Study of the Liver and the American Association for the Study of Liver Diseases guidelines, for the treatment of early-stage HCC.1–3 RFA generates heat within both the tumor and the adjacent liver tissue, ultimately resulting in tumor necrosis. Patients with HCC benefit from RFA’s attributes of safety, minimal invasiveness, and efficacy. In certain cases, however, patients treated with RFA may experience a phenomenon known as insufficient RFA (IRFA), in which tumors fail to reach the critical temperatures necessary for effective ablation, often due to their size or anatomical location.4 IRFA, a leading cause of early recurrence within 2 years and compromised recurrence-free survival, arises from factors such as microvascular invasion, satellite tumor nodules, inaccuracies in image guidance, and the scattering effect.5,6 Recent studies, including our own, have reported the rapid and aggressive recurrence and metastasis of HCC following IRFA, highlighting its clinical significance and therapeutic challenge.7–9 While microvascular invasion (MVI)10 serves as a predictive model for HCC recurrence and circulating tumor cells11 hold promise for the identification of IRFA, challenges in detection methods currently limit their practical application. Despite significant efforts to prevent tumor recurrence post-RFA, progress in this area remains constrained. Hence, there is a pressing imperative to unveil novel mechanisms that could augment the long-term efficacy of RFA treatment.
Single-cell RNA sequencing (scRNA-seq) has emerged as a powerful tool for analyzing transcriptome landscapes at the single-cell level, offering deeper insights into cellular heterogeneity within the tumor microenvironment.12 In this study, scRNA-seq was employed to delineate the landscape of HCC, identify predominant immune cell subpopulations within the tumor microenvironment, and investigate key immune-related targets involved in residual cancer progression following IRFA.
ARF4, belonging to the human ARF gene cohort, assumes pivotal roles as a GTP-binding protein indispensable for an array of cellular processes.13 Dysregulation of this process has been implicated in tumorigenesis and cancer progression.14 Augmented ARF4 expression has been noted in breast, lung, and ovarian cancers, indicating its potential implication in tumorigenesis and disease progression.15–17 Additionally, evidence suggests that the ARF gene family, particularly ARF5, fosters the advancement of HCC.18 Moreover, eukaryotic translation initiation factors (eIFs) are indispensable for the formation of translation initiation complexes that govern protein synthesis.19 Several eIFs, particularly eIF-4, are frequently overexpressed in tumors, with their elevated expression closely linked to tumor stage and progression.20,21 A recent two-sample Mendelian randomization study further suggested that EIF4 may play a pivotal role in the onset and progression of breast cancer.22 Notably, eIF5B has been identified as significantly upregulated in lung adenocarcinoma, where it correlates with increased PD-L1 expression and a poor prognosis.23 However, the effect of ARF4 and eIF5B for the post-IRFA treatment aspect of HCC has not been studied yet.
In this investigation, we employed single-cell analysis to cluster and screen immune marker genes, intersecting these findings with differential genes identified from the GEO-IRFA dataset. This approach enables the development of molecular subtyping and prognostic models for immune-related focal ablation. Notably, our study highlighted the good prognostic implications associated with ARF4 and eIF5B expression in HCC patients post-IRFA. Meanwhile, through comprehensive multi-cohort transcriptome analyses, we elucidated the underlying molecular mechanisms and investigated the potential inhibitory effects of these genes on malignant progression in vitro. These findings may unveil novel impact biomarkers and therapeutic targets for HCC following IRFA.
Methods
Gathering and Handling Data
Specific LIHC-related sequencing information data were acquired from TCGA database, assessable via https://portal.gdc.cancer.gov/projects/TCGA. Samples lacking survival data and outcome status were excluded, resulting in a final inclusion of 363 tumor samples and 50 adjacent non-tumor samples. The dataset denoted as GSE212604, encompassing 12 HCC samples treated with IRFA alongside 8 control group samples, was acquired from the GEO repository to facilitate gene ablation profiling. The ICGC database provided 231 HCC samples for a validation cohort. Datasets for scRNA-seq, the GSE112271 dataset, were retrieved from the GEO platform for detailed analysis.
The meticulous handling of scRNA-seq data involved a structured approach: (1) Initial preprocessing utilized the “Seurat” package (version 5.2.0; http://satijalab.org/seurat/);24 incorporating the PercentageFeatureSet function to assess mitochondrial gene content and conducting correlation analyses to probe sequencing depth relationships with mitochondrial and total cellular sequences. (2) Cells expressing fewer than 200 genes were excluded, with stringent criteria mandating every gene to be detected in a minimum 3 cells. (3) Gene levels within each cell was confined to a range of 200 to 500 genes, ensuring a minimum of 200 UMIs per cell and maintaining mitochondrial proportions below 30%.25–27 Post-filtration, scRNA-seq data underwent normalization via the LogNormalize methodology. This study was approved by Sun Yat-Sen Memorial Hospital’s Institutional Review Board (IRB) (Approval No.: SYSKY-2024-891-01).
A Graphical Abstract summarizing the key findings and conceptual framework of this study is provided as Supplementary Figure 1. The data collection timeline for the conduct of the study is shown in Supplementary Figure 5.
Synthesis of Data and Dimensionality Reduction
Use the Read 10x () function to process the Seurat object containing the gene expression data for each sample.28 Following data quality control, data were normalized using the “LogNormalize” method. To prevent logarithmic indeterminacy (log0), activity was represented as a fraction of genes, scaled by a factor of 10,000 per specimen, transformed using natural logarithms, and standardized by adding 1.
Cell Clustering and Annotation
Seurat employs PCA scores for cell clustering, with each principal component encapsulating a composite “meta-feature” that integrates information from correlated sets of features. The “RunPCA” function is applied to reduce the PCA dimensions of the top 2000 highly variable genes identified in the preceding step. To display the spatial relationships between each cluster, analysis of t-distributed stochastic neighbor embedding (tSNE) was performed, with known marker genes used to define broad cell categories.29,30 By iteratively eliminating types with the poorest correlation, singleR (Single cell sequencing cell type annotation) refines the correlation calculation, ultimately providing an annotation for the predicted cell type.31 Subsequently, marker genes indicative of each cell subtype was identified using the FindAllMarkers function. Genes displaying |avg_log2FC| > 0.25 and a min. pct of 0.25 were chosen providing distinct indicators for every form of cell. Finally, we used the “CellCycleScoring” function enabling prediction of the cell cycle phase (S, G2/M, or G1) for each cell.
Analysis of Cell-Cell Communication
The exploration of ligand-receptor interactions at the cellular membrane provides profound insights into intercellular communication dynamics. Through the utilization of gene expression data, we deduce protein expression profiles, enabling the elucidation of intricate cell interaction networks.32 Our approach involves extracting the expression matrix and cell classification data, followed by employing “CellChat” package32 to construct a comprehensive cellular communication map. Pre-processing tasks encompass the selection of pivotal signaling genes, identification of significantly expressed genes and ligand-receptor pairs, and their integration into the protein-protein interaction (PPI) network framework. Utilizing communication probability calculations, we infer the cellular interaction network, applying stringent criteria to filter out low-quality intercellular communications involving fewer than three cells. Furthermore, we analyze communication dynamics at the signaling pathway level, culminating in the aggregation of robust cell communication networks.
IRFA Differential Genes Screening and Functional Enrichment Analysis
R was utilized for processing and statistically analyzing expression files. Data normalization and identification of differential expression genes (DEGs) were performed utilizing the “limma” package.33 DEGs were considered statistically significant if they satisfied the requirements of a P-value < 0.05 and an absolute log2|FC| > 0.3. A volcano plot illustrating the DEGs was generated using the “ggplot” package. Furthermore, the “pheatmap” R program was used to arrange log2-transformed mRNA expression data into heatmaps. To perform functional annotation of DEGs, the Metascape database (www.metascape.org) was utilized, facilitating a comprehensive exploration of functional associations within gene sets. The intersection of DEGs and cell markers was employed to identify 19 DE-IRFAs utilizing the Venn online website (http://bioinformatics.psb.ugent.be/webtools/Venn/).
Analysis of Gene Set Enrichment, Gene Set Variation, and Consensus Clustering Algorithm
The expression profiles and medical records of 19 DE-IRFAs were obtained from 363 LIHC samples. Subsequently, the “ConsensusClusterPlus” package34 was employed to cluster these DE-IRFAs, with parameters set as follows: 50 repetitions, 80% item resampling rate, 100% feature resampling rate, “pam” clustering algorithm, and Spearman correlation as the distance metric. To assess IRFA activity, the “GSVA” package35 in R was utilized to calculate each LIHC patient’s unique IRFA score. Subsequently, the “wilcox.test” function in R was utilized to examine differences in IRFA scores among various clusters identified by ConsensusClusterPlus. Additionally, using the “GSVA” software package, enrichment values for 50 typical HALLMARK signal transduction pathways were calculated. Similarly, potential differences in signaling pathway enrichment between different clusters were examined using analogous methods.
Cluster Analysis of Tumor Immune Microenvironment
Calculate the Immunity Score, Stroma Score, Estimate Score and Tumor Purity Indicator for every LIHC specimen using the “estimate” package36 in R. Visualization of the outcomes was facilitated using the “ggpubr” package. Moreover, the TIMER2.0 database (http://timer.cistrome.org/), incorporating algorithms from TIMER, CIBERSORT, EPIC, and MCPCOUNTER, was utilized to provide comprehensive immune signatures of tumor-infiltrating cells across various tumor samples sourced from the TCGA database.37 The visualization of immune cell infiltration profiles across each LIHC sample was achieved using the “pheatmap” package in R. Subsequently, the “limma” package in R was applied to identify notable alterations in immune cell infiltration between the C1 and C2 subgroups. Cells were categorized based on their corresponding p-values (< 0.05). Given the crucial role of ICGs in suppressing anti-tumor immune responses and promoting tumor cell immune evasion and progression, we further investigated disparities in ICG comparative gene expression in C1 and C2. Tumor immune dysfunction and elimination (TIDE) represent significant biomarkers for predicting immunotherapy response. Additionally, we examined potential associations between TIDE scores and the C1 and C2 subgroups.
Drug Sensitivity Analysis
Utilizing the comprehensive GDSC Cancer Drug Sensitivity Genomics Database (https://www.cancerrxgene.org/), we employed the R package “pRRophetic”38 to predict the responsiveness of each tumor sample to chemotherapy. Regression-based methods were utilized to predict IC50 values for specific chemotherapy agents, with validation conducted using 10-fold cross-validation on the GDSC training set to ensure robust regression quality and predictive accuracy. Default settings were uniformly applied, including batch effect correction using “combat” and averaging duplicate gene expression measurements.
Construction and Validation of the IRFA Risk Model
Univariate Cox regression analysis, utilizing the survival package, was employed to pinpoint genes significantly linked to prognosis, with statistical significance established at P < 0.05.39 To compress the number of genes, we performed a least absolute shrinkage and selection operator (LASSO) Cox regression analysis, subsequently followed by a multifactorial Cox regression analysis employing the stepwise regression approach.40 Derived from the outcomes of the multifactorial Cox model, we formulated a risk profile using the ensuing formula:

Among these factors, i denotes the gene within the risk profile, where expi signifies the expression level of gene i, and βi represents coefficient derived from the multifactorial Cox model. Following zero-mean normalization, patients were classified into high-risk and low-risk cohorts. The timeROC software package was utilized to do a study of the ROC curve and evaluate the risk characteristics’ predictive ability. The ROC curve was constructed using the risk score, with subsequent calculation of the area under the curve (AUC) to assess the precision of the risk model. The optimal threshold was identified by maximizing the sum of sensitivity and specificity, thereby stratifying individuals into high-risk and low-risk categories. Following this, Kaplan-Meier analysis was employed to underscore the independent prognostic value of the risk score in clinical outcomes.
Construction of Risk Characteristics and Nomogram
To devise a nomogram model suitable for clinical implementation, we commenced with both univariate and multivariate Cox regression analyses of clinicopathological and risk factors. Variables demonstrating significance at P < 0.05 in the multivariable Cox model were integrated into a nomogram designed to forecast prognosis in patients with LIHC, utilizing the rms software package. Calibration curves were subsequently constructed to appraise the predictive precision of the model. Furthermore, the model’s reliability was evaluated via decision curve analysis (DCA).
Response to Immune Checkpoint Blockade
Transcriptomic data and associated clinical profiles were sourced from HCC patients treated with an anti-PD-L1 agent (atezolizumab) in the IMvigor210 cohort (http://research-pub.gene.com/IMvigor210CoreBiologies). Additionally, transcriptomic data from the GSE78220 cohort, comprising pre-treatment melanomas treated with anti-PD-1 checkpoint inhibitors, was included. Furthermore, a tool assessing the potential predictive efficacy of risk signature scores in predicting responsiveness to immune checkpoint blockade (ICB) was also acquired.
Immune Checkpoint Analysis and Gene Set Enrichment Analysis (GSEA)
Conducting GSEA entails the utilization of a predetermined gene set, where genes are ranked according to their expression differences between two sample types. Subsequently, the analysis determines whether this predefined gene set shows enrichment towards the upper or lower extremes of the ranked list. GSEA was employed to scrutinize disparities in hub gene signaling pathways, aiming to uncover potential molecular mechanisms contributing to prognostic variations between the two patient cohorts. And the Single nucleotide variant (SNV) mutations and CNV copy number variation analysis of risk model genes were analyzed. We calculated each patient’s tumor mutational burden (TMB) based on somatic mutation data and performed mutually exclusive and collaborative analyzes of mutation frequencies in hub genes.
Cell Culture and Transfection
The HepG2 and SNU449 cell lines were procured from the Shanghai Academy of Life Sciences cell bank. HepG2 cells were nurtured in Dulbecco’s Modified Eagle Medium (DMEM) medium enriched with 10% fetal bovine serum (FBS), while SNU449 cells were cultivated in RPMI1640 medium supplemented with 10% FBS. All cells were cultured in an incubator at 37°C with a CO2 concentration of 5%. HepG2 and SNU449 liver cancer cells were exposed to a 47°C water bath for 5 minutes to simulate in vitro thermal ablation. Shandong Gene & Bio Co.Ltd (Shandong, China) developed and synthesized two different small interfering RNAs (siRNAs) targeting ARF4 and EIF5B. All transfections were performed using lipofectamine 3000 (lipo3000) liposome transfection reagent (Thermo Biotechnology) following the manufacturer’s guidelines.
Extraction of RNA and qRT-PCR
RNA extraction and reverse transcription were performed using EZB’s RNA Purification Kit and Color Reverse Transcription Kit. Using HiScript II (Vazyme) for cDNA synthesis. ARF4, EIF5B and β-actin were then quantified using 2x Color SYBR Green qPCR Master Mix (ROX2 plus) (A0012-R2, EZBioscience). β-actin was used as an internal reference and we normalized the relative mRNA expression of ARF4 and EIF5B to β-actin. The primers utilized in this study were as follows: ARF4 forward primer (5′-CTGGCAAGACGACAATTCTGT-3′) and reverse primer (5′-TGGATTCTTTCACGATCATTGCT-3′); EIF5B forward primer (5′-CGTTTGAAGGAAGGGGATACAA-3′) and reverse primer (5′-CCACTAGGAGAGGTAAGCCAG-3′); Beta Actin (ACTB) forward primer (5′-CACCATTGGCAATGAGCGGTTC-3′) and reverse primer (5′-AGGTCTTTGCGGATGTCCACGT-3′).
Haematoxylin Eosin (HE) and IHC Staining
Tissues harvested post-ablation from mice were fixed using a 10% paraformaldehyde solution, then embedded in paraffin and sectioned into 3-μm slices for subsequent staining analysis. The paraffin sections underwent dewaxing, followed by rehydration, antigen retrieval, blocking of endogenous peroxidase activity, and blocking with goat serum (ZSGB-BIO, SP-9001). Next, tissue sections were incubated overnight at 4°C with anti-ARF4 primary antibody (A7644, Abclonal) and EIF5B (A15123, Abclonal) at a dilution of 1:200. The following day, 15 minutes incubation of all sections with biotin-labelled goat anti-rabbit immunoglobulin G polymers and 15 minutes incubation with horseradish enzyme-labelled streptavidin working solution at room temperature was performed. Finally, the slides were restained with hematoxylin (CAS. 517-28-2; Sorabo Technology, Beijing) and diaminobenzidine (DAB; ZSGB-BIO, ZLI-9018). For H&E staining, slides were stained according to the manufacturer’s instructions (CAS. 17372-87-1; Sorabo Technology, Beijing). Subsequently, images were examined and captured utilizing an Olympus IX73 microscope (Olympus). Quantification of positivity was performed using ImageJ software.
Immunofluorescence (IF) Staining
The deparaffinized sections underwent a meticulous process: first, they were dewaxed with water, then sequentially treated with environmentally protective dewaxing solutions I and II for 10 minutes each. Subsequently, the sections were rinsed with anhydrous ethanol I, II, and III for 5 minutes each, followed by distilled water for antigen retrieval, completed through natural cooling. The sections were then blocked with 3% Bovine serum albumin (BSA) dropwise for 30 minutes, after which the primary antibody was incubated overnight at 4°C in a humidified chamber. Prior to observation and recording using a Nikon Eclipse Ti2 confocal microscope (Nikon Instruments Co., Ltd., Shanghai), the slides underwent shaking and washing on a decolorizing shaker. Primary antibodies were used as follows: Anti-ARF4 (A7644, Abclonal) and anti-EIF5B (A15123, Abclonal).
Western Blot
The BCA Protein Assay Kit was used to calculate the total protein content (Cwbio, Taizhou, China). Anti-ARF4 (catalog no.: A7644, 1:1000) and anti-EIF5B (A15123, 1:1000) were purchased from ABclonal Biotechnology (Wuhan, China). Levels of two markers, ARF4 and EIF5B, before and after RFA using Western blot assay.
Cell Migration and Invasion Assay
Transwell chambers are used for invasion and migration assays. At 37°C for 2 hours, we placed Matrigel chambers (Corning) in 24-well plates containing serum medium. To the upper part of the transwell chamber containing 100 uL of serum-free medium, a total of 100,000 cells were added. After culturing HepG2 cells for 48h and 72h, and SNU449 cells for 72 hours and 96 hours, respectively. Then cells were fixed with paraformaldehyde 40 minutes and stained with 500uL of crystal violet dye solution (1%). After staining 30 minutes, excess dye was removed from and around the basement membrane with a cotton swab. Finally, we photographed each of the chambers with a Nikon microscope.
CCK-8 Assay and Colony-Forming Assay
To determine the cell viability, we resuspended the cells using DMEM and 1640 medium containing 1% double antibody, adjusted the cell density to 2000, mixed and inoculated into 96-well plates at 100ul/well, and after 24h to 72h of incubation, 90ul of fresh medium and 10ul of cck8 solution were added to each well, and the optical density (OD) at 450 nm was assessed following a 2-hour incubation period in the controlled environment of the incubator.
Plate cloning experiments were performed by adjusting the cell density to 1000 and then inoculating the cells into 6-well plates and incubating them in a thermostat for 7–10 days, closely observing the cell growth, and after the formation of the colonies, fixing the cells with 4% paraformaldehyde for 30 min, and staining them with 0.5% crystal violet staining solution for 20 min at room temperature. The cells were washed with running water, and then the plates were air-dried in an oven at 37°C degrees Celsius and finally photographed.
Animal Experiment
All animal experiments in this study were conducted within the specific pathogen-free (SPF) barrier of our school’s animal experiment center, using 3–5-week-old C57BL/6 male mice. The mouse liver cancer cell line Hepa1-6 was selected, and DMEM high-glucose medium was used for 1:2 passage. The Hepa1-6 cells growing in the logarithmic phase were digested with trypsin. After centrifugation, the cells were resuspended in a solution of matrix gel and PBS 1:1 to prepare a 5*107/mL cell suspension. The mouse skin was prepared, the back was disinfected with 75% alcohol, the 100ul of cell suspension was inoculated on the right side. The tumor formation was observed every 3 days. After about 1 week, the subcutaneous tumor of the mouse could be observed with the naked eye. When the diameter of the subcutaneous tumor reached 1cm and the volume reached 500mm3, the mouse was anesthetized with isoflurane and IRFA was performed: the radiofrequency ablation instrument was connected, the coupling agent was squeezed on the electrode sheet, the surgical area was disinfected, the ablation needle was inserted into the subcutaneous tumor, condensed water was passed, the power was adjusted to 3W, ablation was performed for 30s (90 Joules), the surgical area was disinfected again, and the mouse was kept in the recovery position and kept warm until awake.
Our study was carried out in compliance with the ARRIVE guidelines. Animal experiments included in this study were agreed by the Ethics Committee of Sun Yat-Sen University (Ethical Number: SYSU-IACUC-2024-002485).
High Throughput mRNA Sequencing Analysis
Technical support for mRNA sequencing was provided by Kindstar Sequenon Biotechnology (Wuhan, China). In brief, the index-coded samples were clustered using a cBot Cluster Generation System with TruSeq PE Cluster Kit v3-cBot-HS (Illumina), following the manufacturer’s protocols. Subsequently, library preparations were sequenced on an Illumina Novaseq platform, and data analysis was conducted.
Pathway Enrichment Analysis and Comparative Visualization of ARF4 and EIF5B-Associated Signaling Pathways
We performed GSEA using the “ClusterProfiler” R package to identify pathways associated with ARF4 and EIF5B, with enrichment assessed against the KEGG database. To explore shared regulatory mechanisms, we visualized overlapping enriched pathways using a dot plot generated with “ggplot2”, where dot size represents gene count and color gradient indicates statistical significance. Additionally, we compared the relative enrichment of these pathways using Normalized Enrichment Scores (NES) and visualized them with a heatmap generated by the “pheatmap” package.
Statistical Analysis
Statistical analyses were conducted using GraphPad Prism v9.0.0 (GraphPad Software Inc., CA, USA) and R software (version 4.2.3). Comparison of continuous and ordered categorical variables using Wilcoxon and Kruskal–Wallis tests, respectively. The results were presented as mean ± standard error of the mean (SEM). Statistical significance was defined as P < 0.05.
Results
Quality Control, Standardization, and Analysis of scRNA-Seq Data
Upon filtering the single-cell dataset, stringent criteria were applied: a minimum requirement of gene expression in at least three cells per gene and a minimum of 200 genes expressed per cell. The PercentageFeatureSet function was utilized to assess the proportions of mitochondrial and ribosomal RNA, ensuring that gene expression per cell ranged from 200 to 5000 and that each cell possessed a unique molecular identifier (UMI) count exceeding 200. We observed a direct association between UMI/mRNA ratios and mitochondrial gene content. Subsequently, a scatter plot was constructed for the 2000 variable genes, demonstrating that the optimal number of principal components (PCs) is 30, as discerned through the ElbowPlot method, depicted in Supplementary Figure S2.
PCA was employed for dimensionality reduction, revealing distinct scoring values across multiple dimensions. Figure 1A displays the tSNE plot depicting the distribution of the seven samples. Subsequently, tSNE analysis identified 23 subtypes (Figure 1B), revealing significant expression variations among numerous genes across these subtypes.
 |
Figure 1 (A) T-SNE plot from seven LIHC samples in this study. Distribution of cells were uniform in all samples, indicating no significant batch effect between all samples. (B) All cells were clustered into 23 clusters analyzed by dimensionality and clustering. (C) T-SNE analysis revealed different cell cycle phases in the full sample. (D) Bar graphs show the specific proportions of the distribution of cell cycle phases for different cell types. (E) Extensive cell categories were defined using known marker genes, and 23 clusters were annotated to different cell categories. (F) Cellular interactions and strength of communication between the major cell types are represented by circular diagrams. (G) Compare important intercellular ligand-receptor pairs that contribute to signaling. (H) The heatmap of DEGs between con and IRFA group. (I) The volcano gram of IRFA DEGs in the GSE212604 dataset. (J) Relationship between single-cell immunity subtypes and IRFA analyzed by GSEA. (K) KEGG and GO functional enrichment analysis of IRFA DEGs in GSE212604 dataset. (L) Venn diagram showing hub genes intersected by IRFA DEGs and cell markers. |
Additionally, we conducted cell cycle analysis and observed distinct proportions of cell cycle phases across different cell subtypes (Figure 1C and D). Using cell-specific markers, we delineated various cell types such as epithelial cells, and immune cells (Figure 1E). Meanwhile, our investigation into intercellular interactions revealed significant findings, including the FN1-SDC4 receptor-ligand pair in NK cells and monocytes (Figure 1F and G).
Identification of DEGs in IRFA
Differential analysis was conducted on samples derived from the GSE212604 dataset, revealing 175 genes as differentially expressed in response to IRFA (DE-IRFAs). Among them, 86 genes were up-regulated while 89 were down-regulated. Visual representations such as heatmaps and volcano plots were utilized to illustrate the differential expression patterns of these genes (Figure 1H and I). We subsequently explored the correlation between single cell immune subtypes and IRFA using GSEA. This investigation uncovered notable enrichment of cancer stem cells, endothelial cells, M2 macrophages, and regulatory T cells within the immune cell populations affected by IRFA (Figure 1J). Following this, we performed GO and KEGG analyses on the DE-IRFA genes. The KEGG enrichment analysis highlighted pathways such as Platelet activation and others of significance. Concurrently, the GO analysis revealed notable biology process including regulation of phosphatase activity, catalytic activity, and RNA-related processes, among others (Figure 1K). At last, we proceeded to identify 19 differentially expressed genes associated with immune subtypes cells using the Venn diagram analysis tool online (Figure 1L).
Consensus Clustering Analysis for IRFA-Based Molecular Subtype Identification in LIHC
To elucidate IRFA-based molecular subtypes of liver hepatocellular carcinoma (LIHC), we conducted consensus clustering analysis employing 363 LIHC samples. Through evaluation of the cumulative distribution function (CDF) curve and delta area, we identified an optimal partitioning into two distinct, mutually exclusive subtypes (Figure 2A). Following clustering, we delineated two distinct IRFA-based molecular subtypes of LIHC: subtype 1 comprised 190 cases, while subtype 2 comprised 173 cases. Patients classified under subtype 1 (C1) displayed elevated immunogenic cell death (ICD) scores relative to those in subtype 2 (C2) (Figure 2B). Moreover, substantial disparities in the expression levels of different expression IRFA (DE-IRFA) associated genes were evident between C1 and C2 subtypes, with predominance of overexpression observed in the C1 subtype (Figure 2C). The exploration through pathway-based single sample Gene Set Enrichment Analysis (ssGSEA) uncovered that the C2 subtype displays notable enrichment in pathways including TGF-β signaling, angiogenesis, and Interleukin 6 (IL6)/ Janus kinase (JAK)/ Signal transducer and activator of transcription 3 (STAT3) signaling, among others. These findings underscore the intimate association of IRFA with tumor-related pathways mentioned above (Figure 2D).
 |
Figure 2 (A) Define a heatmap of the consensus matrix for the two clusters. Option k is a parameter used to determine the number of clusters, with k = 2 indicating two subgroup clusters. (B) IRFA scores in patients with C1 and C2 subtypes and statistical analyses were performed using the Wilcoxon test. (C) Heatmap depicting the expression levels of different clusters. Cluster 1 is mostly represented by the high expression group, while cluster 2 is dominated by the low expression group. (D) Major enrichment pathways for C1 and C2 subtypes identified based on ssGSEA. (E) Assessment of chemotherapy response to subtypes C1 and C2 is shown by bar graphs. (F) Differences in immune characteristics between C1 and C2 subtypes assessed based on ImmuneScore, StromalScore, ESTIMATEScore, and TumorPurity. (G) Four different algorithms were used to estimate the percentage of immune cell infiltration in the C1 and C2 subtypes, revealing the abundance of immune cell infiltration in the tumor microenvironment. (H) Disparities in immune checkpoints levels for subtype C1 and subtype C2. (I) Patients with the C1 clusters responded less favorably to immunotherapy than those with the C2 clusters, as demonstrated by application of the Tumor Immune Dysfunction and Exclusion (TIDE) algorithm. |
Assessment of Treatment Response in Different Clusters of Subtypes
Given the extensive application of molecularly targeted therapies in HCC treatment, we conducted a systematic assessment of chemotherapy response across distinct subtypes, leveraging half-maximal inhibitory concentration (IC50) data sourced from the Genomics of Drug Sensitivity in Cancer (GDSC) database. This analysis was facilitated using the “pRRophetic” package in R. In our study, we identified a total of 55 small molecule compounds that exhibited significant distinctions between cluster1 and cluster2 (Supplementary Figures S3 and S4). Our findings suggest that drugs such as Bortezomib, Bexarotene, Bleomycin, and Cytarabine hold promise for efficacy in the C1 subtype, while Salubrinal and Roscovitine show potential responsiveness in the C2 subtype (refer to Figure 2E). These small molecule compounds represent prospective therapeutic agents for HCC. Nonetheless, further detailed analyses are warranted in the near future.
Examining Tumor Immune Microenvironment Cluster Analysis
Transcriptomic data were employed to assess disparities in immune profiles between the C1 and C2 subtypes utilizing the “ESTIMATE” R package. We conducted evaluations using metrics including StromalScore, ImmuneScore, ESTIMATEScore, and Tumorpurity, offering insights into the shifting immune dynamics across these subtypes. Our results demonstrate that the C1 subtype exhibits elevated levels of ImmuneScore, StromalScore, and ESTIMATEScore, alongside reduced tumor purity levels (Figure 2F). These observations imply a favorable prognostic association between liver cancer prognosis and the presence of immune and stromal constituents. To further elucidate the prevalence of immune cell infiltration in the tumor microenvironment, a variety of algorithms were utilized to assess the proportions of immune cell infiltrates across the C1 and C2 subtypes. As illustrated in Figure 2G, leveraging TIMER, CIBERSORT-ABS, EPIC, and MCPCOUNTER algorithms, the C1 subtype manifests heightened fractions of B cells, CD4+T cells, CD8+T cells, macrophages, neutrophils, NK cells, and myeloid cells in the tumor microenvironment. It is widely acknowledged that numerous immune cell subtypes are disproportionately abundant in the C1 subtype. Immune checkpoint genes (ICGs) play a pivotal role in regulating immune cell functions. Likewise, our observation indicates heightened expression of ICGs within the C2 subtype, as depicted in Figure 2H. Employing the TIDE algorithm, our investigation unveiled a conspicuously heightened TIDE score in the high-risk cohort, indicating that patients with the C1 subtype demonstrated reduced responsiveness to immunotherapy relative to those with the C2 subtypes, as illustrated in Figure 2I.
Construction of IRFA Risk Model
In pursuit of refined prognostic modeling, we subjected 19 DE-IRFA-associated immune genes to detailed analysis, revealing 12 genes of notable prognostic significance through univariate Cox regression analysis (Figure 3A, P < 0.05). Following this, LASSO-Cox analysis revealed a λ value of 0.0299 (Figure 3B), followed by multifactorial Cox regression analyses employing stepwise regression methods to ultimately identify 2 genes for constructing the risk score model, and they were positively correlated with the overall survival (OS) of patients (Figure 3C). The definitive formula for the 2-IRFA-associated gene signature is articulated as follows:

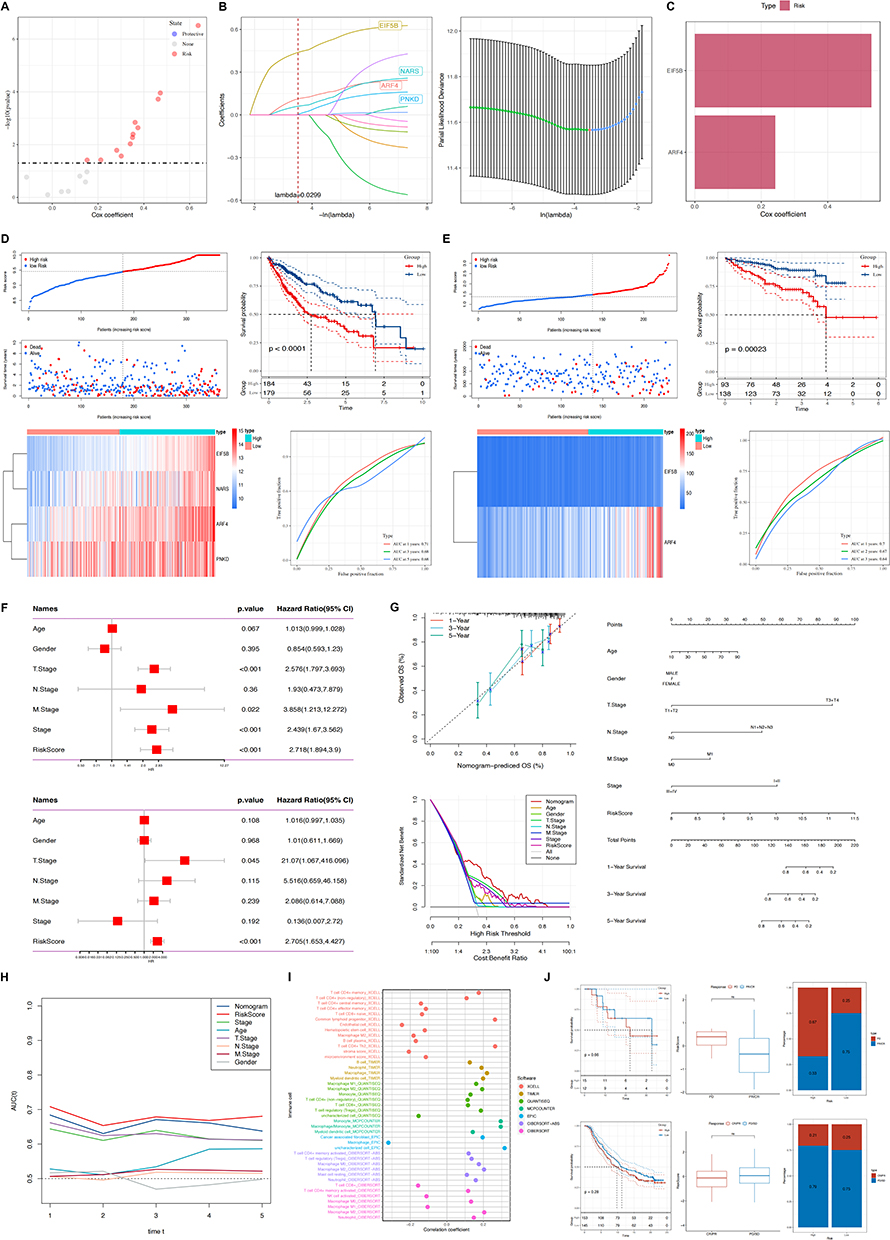 |
Figure 3 (A) Model coefficients for twelve genes in the IRFA subtype construct. (B) Four genes were included in the IRFA risk model after multivariate Cox regression analysis using stepwise regression method. (C) Two immune-related hub genes for constructing IRFA risk models were obtained, both of which are protective genes. (D) Construction of a postoperative risk prediction model for IRFA based on TCGA-LIHC dataset. (E) External validation of the IRFA postoperative risk prediction model on the ICGC dataset. (F) Single and multivariate cox regression analyses for identification of risk scores and prognostic risk factors (Age, Gender, T-Stage, N-Stage, M-Stage, NCCN-Stage, and RiskScore) in the clinicopathological. (G) A nomogram combining stage and risk score was constructed to effectively predict actual survival outcomes, and DCA showed that the nomogram had better discrimination ability. (H) TimeROC analyzes showed higher AUCs for risk scores and column plots in the TCGA cohort than for other metrics. (I) Correlations between risk models and various immune cells were found using different softwares. (J) Responsiveness to immunotherapy is predicted using characteristics based on public databases. |
Moreover, our study explored the association between the ICD risk score and survival outcomes. The findings revealed that patients with a lower ICD risk score exhibited more favorable prognoses compared to those with higher scores (Figure 3D). Furthermore, we validated the prognostic efficacy of the ICD-risk score model using the TCGA-LIHC cohort and subsequently confirmed its robustness through external validation using the ICGC database, employing Kaplan-Meier and ROC curve analyses (Figure 3E).
Determining Independent Risk Variables and Creating a Nomogram
In order to enhance the predictive accuracy of risk profiles, we amalgamated clinicopathological features with risk scores using both univariate and multivariate Cox regression analyses. The univariate analysis underscored that risk features, alongside stage, T stage (T: size or direct extent of the primary tumor), and N stage (N: degree of spread to regional lymph nodes), each stood out as significant independent prognostic factors within the risk model. Subsequent multivariate analysis demonstrated that both the risk signature and T stage retained their status as significant independent prognostic factors within the model (Figure 3F). Subsequently, a nomogram integrating both stage and risk score was developed. Calibration plots demonstrated the efficacy of the nomogram in accurately predicting actual survival outcomes. Additionally, DCA indicated that the nomogram outperformed both risk score and stage alone in discriminating high-risk patients (Figure 3G). TimeROC analysis revealed that both the AUC of the risk score and the nomogram surpassed those of other metrics in the TCGA cohort (Figure 3H).
Association Between IRFA-Risk Score and Immune Signature and Response to Immunotherapy and Prognosis
Diverse levels of immune cell death activation could induce variability in immune cell infiltration. Hence, we conducted additional analyses to identify correlations between high and low risk scores in the IRFA model and various immune cells, employing various software tools such as TIMER and CIBERSORT. The results demonstrated that the high-risk cohort displayed heightened levels of immune cell infiltration and increased activation of immune-related functions and pathways compared to the low-risk group (Figure 3I). We extended our investigation to ascertain the role of IRFA-risk score in predicting both response to immunotherapy and prognosis in patients. Our findings revealed that who responded to immunotherapy tended to have lower risk scores, correlating with more favorable survival outcomes among those classified in the low-risk subtype, as depicted in Figure 3J.
Mutation Statuses of ARF4 and EIF5B
To delve deeper into hub genes (ARF4 and EIF5B) related molecular mechanisms, we analyzed the somatic mutation profiles of patients within the TCGA-LIHC cohort (TCGA: The Cancer Genome Atlas). Subsequent analysis on investigating single nucleotide variant (SNV) mutations in the two genes comprising the risk signature. Results revealed that EIF5B exhibited SNV mutations in a higher proportion of samples, whereas no SNV mutations were detected in ARF4 (Figure 4A). We also evaluated the likelihood of co-occurrence between these key genes and the top 10 most frequently mutated genes. As illustrated in Figure 4B and C, no significant co-occurrence of mutations was observed between these two genes. Moreover, only a small subset of samples among these genes exhibited gain/loss of copy number variations (CNV), as illustrated in Figure 4D. To further elucidate the association of these risk genes with HCC, we conducted an analysis exploring their correlation with various molecular features. The findings indicated that EIF5B demonstrated notable positive associations with Aneuploidy Score, Homologous Recombination Defects, and Fraction Altered, whereas ARF4 exhibited a significant positive correlation specifically with Homologous Recombination Defects (Figure 4E).
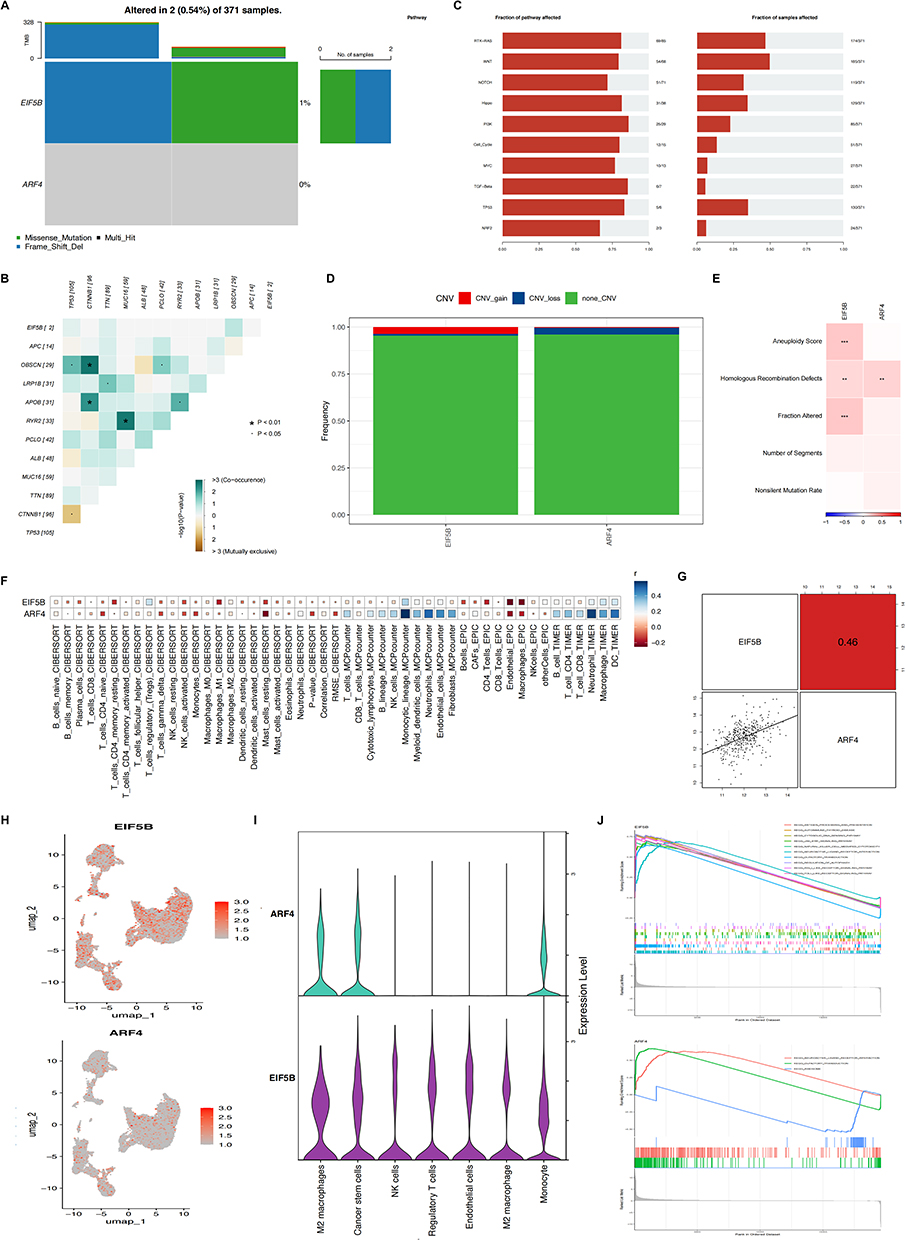 |
Figure 4 (A) SNV mutations in two genes (EIF5B and ARF4) in the risk signature model. (B) The co-occurrence probabilities of the two key genes and the ten most mutated genes were analyzed. (C) Detection of gain/loss of CNV in two key genes. (D) Detection of gain/loss of CNV frequency in two key genes. (E) Correlations between key genes and different molecular features of hepatocellular carcinoma were analyzed. (F) Risk genes were analyzed for correlation with immune cells, EIF5B and ARF4 were significantly and positively correlated with the majority of immune cells. (G) The correlation between two key genes, EIF5B and ARF4. (H) Feature plot of EIF5B and ARF4 expression after recognition of cell clusters by umap. (I) Violin plots showing the distribution of EIF5B and ARF4 in different immune cells. (J) The pathways in which the two key genes were mainly enriched were analyzed by GSEA. |
Elevated Expression of Hub Genes are Associated with Heightened Immune Activity and a Reduced Rate of Tumor Metastasis
Next, we further investigated the potential links between ARF4 and EIF5B expression and tumor immune status. We utilized four distinct algorithms to evaluate the association between levels of immune cell infiltration and the expression profiles of ARF4 and EIF5B. Our findings suggest a positive correlation between infiltration levels of CD8+T cells, CD4+T cells and macrophages, and the expression levels of ARF4 and EIF5B (Figure 4F). The above results were further confirmed using single cell sequencing results (Figure 4H and I). Furthermore, between ARF4 and EIF5B demonstrate a notable positive correlation (Figure 4G). Subsequently, we conducted GSEA analysis revealing that ARF4 is prominently enriched in pathways related to neuroactive ligand receptor interaction, while EIF5B exhibits enrichment primarily pathways associated with antigen processing and presentation, among others (Figure 4J).
ARF4 and EIF5B Exhibits a Low Expression After IRFA with HCC
To study the expression of ARF4 and EIF5B after IRFA, we performed qPCR, Western blot, IHC and IF assays in two different cell lines HepG2 and SNU449. We found that ARF4 and EIF5B expression were lower in the post-RFA group compared with that of the pre-RFA group (Figure 5A, B and F). To systematically understand the invasiveness and biological role of post-IRFA, we established IRFA animal model (Figure 5D). Perform H&E staining to confirm IRFA success (Figure 5E). Similarly, qPCR, Western blot, IHC and IF assays in mouse tissues exhibited the same findings as the cell lines, with both ARF4 and EIF5B expression reduced after ablation (Figure 5A, C and F).
 |
Figure 5 (A) Variations in mRNA expression levels of ARF4 and EIF5B in HepG2 and SNU449 cell lines, as well as mouse tissues, under control conditions and following heat treatment. (B) Analysis of ARF4 and EIF5B at the protein levels in HepG2 and SNU449 cell lines. (C) Quantification of ARF4 and EIF5B protein levels in mouse tissues before and after exposure to IRFA. (D) Schematic representation of the IRFA model used for constructing subcutaneous tumors in mice. (E) Histopathological analysis and immunohistochemical staining of ARF4 and EIF5B in HCC sections from normal tumors and tumors post-IRFA in a murine model. (F) Fluorescence microscopy images depicting ARF4 and EIF5B expression patterns in HepG2, SNU449 cell lines and in mouse tissues. *P < 0.05, **P < 0.01, ***P < 0.001, ****P < 0.0001. |
Increased Expression of ARF4 and EIF5B Attenuates Aggressive Tumor Behaviors and Serve as a Favorable Prognosis Marker Following IRFA
To further validate the biological functions of ARF4 and EIF5B, detection of variations in mRNA and protein levels was performed by real-time PCR, protein blotting analysis and immunohistochemistry. The results showed satisfactory knockdown efficiency of si-ARF4 (Figure 6A) and si-EIF5B (Figure 6E). The cell proliferation capacity of HepG2 and SNU449 cell lines was subsequently determined using the CCK-8 kit and colony formation assay. The CCK-8 results revealed that cell proliferation was significantly accelerated after knockdown of ARF4 and EIF5B (Figure 6B and F). Plate cloning experiments also showed the same trend of results (Figure 6I and J). Subsequent Transwell experiments demonstrated that the migration and invasion abilities of both HepG2 and SNU449 cell lines were markedly elevated after ARF4 and EIF5B knockdown (Figure 6C, D, G and H).
 |
Figure 6 Assessment of the impact of ARF4 and EIF5B knockdown on the invasive, migratory, and proliferative capacities of HepG2 and SNU449 cells. (A and E) RT-qPCR was employed to quantify the efficacy of ARF4 and EIF5B knockdown in HepG2 and SNU449 cells. (B and F) The CCK-8 assay was conducted to evaluate the proliferation of HepG2 and SNU449 cells. (C and G) Cell migration was assessed via transwell assays. (D and H) Cell invasion was assessed via transwell assays. (I and J) The colony-forming assay was employed to assess the proliferative potential of HepG2 and SNU449 cells. *P < 0.05, **P < 0.01, ***P < 0.001, ****P < 0.0001. |
It is known that epithelial mesenchymal transition (EMT) is a common cause of tumor metastasis. In the following section, we checked whether ARF4 and EIF5B causes EMT. In comparison to control cells, ARF4 and EIF5B knockdown cells exhibited E-cadherin was decreased and Vimentin and snail upregulated. This was confirmed by immunofluorescence (Figure 7A). Overall, our data provides evidence suggesting that ARF4 and EIF5B may regulate cell proliferation, migration, and invasion by EMT.
 |
Figure 7 (A) Immunofluorescence staining delineated alterations in the expression profiles of EMT-related genes, especially highlighting the dynamics of E-cadherin, Snail, and vimentin (depicted in green) within HCC cells. The cellular nuclei were concurrently counterstained with DAPI (blue). (B) Heatmap of gene changes pre and post ablation analysis using transcriptome sequencing. (C) Analysis of transcriptome sequencing reveals volcanic picture in gene expression pre- and post-ablation. (D) Transcriptome sequencing was used to analyze the changes in the differentially expressed genes EIF5B and ARFs family. (E and F) GO and KEGG pathway enrichment analysis. (G) GSEA of ARF4 and EIF5B-associated signaling pathways. (H) Shared pathways between ARF4 and EIF5B. (I) Pathway enrichment heatmap (NES) between ARF4 and EIF5B. |
Pathways That May Affect Residual Cancer Progression After IRFA
To further verify the results of our analysis, we used HepG2 cell lines heat-treated at 37 degrees Celsius as the control group and heat-treated at 47 degrees Celsius for 48 hours as the IRFA group and performed transcriptome sequencing analysis. Sequencing analysis was performed by Kindstar Sequenon Biotechnology (Wuhan) Co., LTD. Our sequencing findings were visually represented using heat maps and volcano plots to delineate genes that were upregulated, downregulated, and unchanged (Figure 7B and C). Concurrently, functional enrichment analyses including Gene Ontology (GO) and Kyoto Encyclopedia of Genes and Genomes (KEGG) pathway analysis implicated pathways potentially linked to residual tumor progression following ablation, notably involving P53 and TGF-β signaling pathway. These findings underscore the necessity for future in-depth investigations (Figure 7E and F). Notably, differential gene expression analysis revealed EIF5B downregulation, corroborating our prior research. Conversely, while ARF4 exhibited no change in expression, its homolog ARF6 demonstrated a notable downward trend within the same gene family (Figure 7D).
We further explored potential biological pathways specifically affected by ARF4 and EIF5B, we performed GSEA analysis. The results showed that ARF4 and EIF5B were significantly associated with multiple oncogenic pathways, including the KEGG cell cycle pathway, the JAK-STAT signaling pathway, and the WNT signaling pathway (Figure 7G). To explore shared regulatory mechanisms, we analyzed overlapping enriched pathways and visualized them using a dot plot, where dot size and color gradient indicate statistical significance (Figure 7H). Finally, we quantitatively compared the enrichment scores of pathways associated with ARF4 and EIF5B, and we generated a NES heat map (Figure 7I). The cell cycle pathway showed the highest enrichment score in both genes, while immune-related pathways, including B cell receptor signaling, T cell receptor signaling, and cytokine-cytokine receptor interactions, were negatively enriched.
Discussion
RFA represents a primary curative modality for liver cancer, distinguished by its minimal tissue damage. Nevertheless, studies have reported higher recurrence rates following RFA compared to liver resection.41 Mounting evidence underscores that incomplete ablation of tumors may elicit both an immune response and promote tumor progression and recurrence within the periablational zone.42–45 Mounting evidence underscores that incomplete ablation of tumors may elicit both an immune response and promote tumor progression and recurrence within the periablational zone.46 Therefore, we take an immune perspective to screen for more effective immune-related biomarkers for precision therapy and prognostic assessment.
Given the challenges in acquiring human HCC tissue post-RFA, the insights gleaned from investigations using liver cancer cell lines and animal models necessitate substantiation through robust theoretical frameworks and empirical evidence. This study is the first attempt to screen biomarkers affecting the progression of residual cancer after IRFA by bioinformatics methods, to assess the changes in immune cells and to comprehensively analyze the immune response and tumor recurrence-related mechanisms in residual HCC after IRFA by integrating transcriptomics analysis.
In this study, we integrated single cell sequencing analysis and transcriptome sequencing data from post-IRFA patients to explore the immunophenotype of HCC and identify key immune cell subpopulations enriched in the tumor microenvironment. By intersecting differentially expressed genes associated with residual cancer progression, we uncovered potential immune-related targets influencing tumor recurrence. Presently, numerous biomarkers, including NOX4, and HSP70 have been employed for prognostic prediction in IRFA. However, most studies focus on individual biomarkers.47,48 Mounting evidence suggests that prognostic models utilizing multiple genes as indices offer a more comprehensive and effective approach than single gene markers across various malignancies. For instance, Long et al developed an immune prognostic model based on differentially expressed immune-related genes between TP53WT and TP53MUT HCC samples.49 Lin et al development and validation of a prognostic model incorporating diverse vascular patterns for survival estimation in HCC.50 Cao et al using lymph angiogenesis-related lncRNA pairs to predict prognosis of HCC.51 Hence, we developed an immune-related prognostic model for IRFA using two pivotal genes (ARF4 and EIF5B), identified through screening, to accurately forecast patient outcomes following IRFA surgery.
A recent study revealed that the ARF4 is a gene notably upregulated during treatment and linked to temozolomide (TMZ) chemoresistance in glioblastoma.17 Simultaneously, research has demonstrated that the inhibition of ARF4 effectively attenuates the proliferation and migratory capabilities of epithelial ovarian cancer cells.52 EIF5B, another pivotal gene in our prognostic model, serve as a critical regulatory hub facilizing cancer cell evasion of apoptosis. It accomplishes this by enhancing the translation of pro-survival proteins encoded within IRES-containing mRNA transcripts.53 Meanwhile, the initiation factor eIF5B exerts stringent control over global translation initiation, thereby facilitating the expression of specific proteins critical for promoting proliferation, suppressing apoptosis, and inducing immunosuppression during stress conditions. By augmenting the synthesis of these survival-promoting proteins, eIF5B enables cancer cells to metastasize and develop resistance to chemotherapy.54 Interestingly, our investigation revealed a notable downregulation of ARF4 and eIF5B following IRFA treatment. Comprehensive cohort analyses consistently indicated that diminished ARF4 and eIF5B expression correlates with unfavorable prognostic outcomes. Furthermore, using qPCR, Western blot, IHC, and IF assays on two distinct cell lines and IRFA-animal mouse models, we observed that reduced ARF4 and eIF5B expression is associated with poorer prognosis in post-IRFA patients.
ARF4 and eIF5B are commonly upregulated in a majority of tumors. However, our study reveals their potential role as protective factors that mitigate residual cancer progression following IRFA. We suspect this may be because RFA treatment directly modulates the metabolic and survival landscape of liver cancer cells. RFA induces localized thermal effects and cellular damage, leading to the deactivation and regression of tumor tissues. Post-RFA treatment, metabolic shifts and alterations in gene expression profiles within HCC tissues may occur, accompanied by suppression of critical cellular signaling pathways. These collective changes are likely contributors to the observed decrease in ARF4 and eIF5B expression levels in treated tissues. Collectively, these findings underscore the potential of ARF4 and eIF5B as a protective factor against residual cancer progression following IRFA, thereby suggesting its candidacy as a robust prognostic biomarker.
We further performed transcriptomic analysis to further investigate the potential biological function of post-IRFA in promoting residual cancer progression. The results showed that post-IRFA activated multiple pathways related to tumor progression, including TGF-β signaling pathway and the p53 signaling pathway, etc. Activation of these pathways robustly triggers diverse signaling cascades across various cancer cell types, contributing significantly to tumor cell proliferation, metastasis, and modulation of immune evasion mechanisms.55,56 Interestingly, our enrichment analysis further demonstrated that ARF4 and EIF5B were specifically associated with the Wnt signaling pathway and several immune-related pathways through public dataset. The Wnt pathway plays a pivotal role in tumor initiation and progression by regulating cell proliferation, differentiation, and stemness, which may explain the enhanced tumor aggressiveness observed post-IRFA.57,58 Moreover, enrichment in immune-related pathways suggests a potential role of ARF4 and EIF5B in modulating the tumor immune microenvironment, possibly contributing to immune escape mechanisms. Taken together, these results indicate that while post-IRFA broadly activates oncogenic signaling pathways, ARF4 and EIF5B may serve as key mediators, particularly through the Wnt pathway and immune regulation, in promoting residual tumor progression. Future studies are warranted to explore the mechanistic links between these pathways and to determine whether targeting ARF4 and EIF5B could provide therapeutic benefits in the post-IRFA setting.
Our study revealed significant associations between ARF4 and EIF5B genes and the in vitro proliferation, migration, and invasion capabilities of HepG2 and SNU449 cells. Furthermore, tumorigenesis, invasion, metastasis, and treatment resistance are intricately linked to EMT, a reversible process that warrants detailed investigation of its regulatory factors.59 Notably, our findings underscore that ARF4 and EIF5B knockdown exacerbates EMT in vitro. These results advocate for exploring ARF4 and EIF5B as potential therapeutic targets to enhance treatment outcomes following IRFA and surgery.
While this study advances our understanding of the immune response and prognostic biomarkers of HCC following IRFA, certain limitations must be acknowledged. First, the relatively modest sample size may limit statistical power and constrain the generalizability of our findings. Second, as the data primarily originate from public databases and select patient cohorts, potential biases—arising from differences in sequencing platforms or patient backgrounds—may affect data stability and reproducibility, necessitating further validation. Additionally, although experimental validation was performed using in vitro models and murine systems, the broader applicability of these findings to diverse patient populations remains to be established through further clinical investigations. Future research should incorporate larger-scale, multi-center clinical datasets and more extensive experimental validation to enhance the robustness and translational relevance of our conclusions.
Conclusion
In conclusion, in the present study we found that the ARF4 and eIF5B genes are not exclusively tumor suppressors but also sometimes tumor promoters. Additionally, post-IRFA, ARF4 and EIF5B exhibited significant downregulation, correlating with adverse prognostic outcomes. Our investigation further linked this downregulation to the activation of multiple oncogenic pathways. Moreover, our in vitro assessments demonstrated that ARF4 and EIF5B attenuate the proliferation, invasion, migration, and EMT of residual cancer cells post-IRFA. Thus, ARF4 and EIF5B emerge as potential biomarkers for prognostic evaluation following IRFA, highlighting their potential as therapeutic targets in post-IRFA interventions.
Data Sharing Statement
The contributions originally presented in this study are included in the article/supplementary material. Further inquiries can be directed to the corresponding author.
Ethical Statement
This study uses publicly available data from the TCGA, GEO and ICGC database, which has been ethically approved with patient informed consent. All experimental procedures involving animals were conducted in full compliance with the Guide for the Care and Use of Laboratory Animals (NIH Publication No. 85-23, revised 1996) and received approval from the Laboratory Animal Center at Sun Yat-Sen University (Approval number: SYSU-IACUC-2024-002485). Our study followed the ARRIVE guidelines for reporting animal research. Meanwhile, this study was conducted in accordance with the 1964 helsinki Declaration and approved by the Sun Yat-Sen Memorial Hospital’s Institutional Review Board (IRB) (SYSKY-2024-891-01). In this study, the samples were utilized exclusively for their intended scientific purposes, without additional collection or any impact on patient privacy.
Acknowledgments
The authors acknowledged the R software development team and the databased for providing many biological information data.
Author Contributions
All authors made a significant contribution to the work reported, whether that is in the conception, study design, execution, acquisition of data, analysis and interpretation, or in all these areas; took part in drafting, revising or critically reviewing the article; gave final approval of the version to be published; have agreed on the journal to which the article has been submitted; and agree to be accountable for all aspects of the work.
Funding
This work was supported by the National Natural Science Foundation of China (82171944, 81873899), and Natural Science Foundation of Guangdong Province (2021A1515012611, 2022A1515012426).
Disclosure
All authors have read the policy on disclosure of potential conflicts of interest outlined. The authors declare that there are no conflicts of interest.
References
1. Marrero JA, Kulik LM, Sirlin CB, et al. Diagnosis, staging, and management of hepatocellular carcinoma: 2018 practice guidance by the American Association for the Study of Liver Diseases. Hepatology. 2018;68:723–750. doi:10.1002/hep.29913
2. Heimbach JK, Kulik LM, Finn RS, et al. AASLD guidelines for the treatment of hepatocellular carcinoma. Hepatology. 2018;67:358–380. doi:10.1002/hep.29086
3. European Association for the Study of the Liver, European Organisation for Research and Treatment of Cancer. EASL-EORTC clinical practice guidelines: management of hepatocellular carcinoma. J Hepatol. 2012;56:908–943. doi:10.1016/j.jhep.2011.12.001
4. Teng W, Liu KW, Lin CC, et al. Insufficient ablative margin determined by early computed tomography may predict the recurrence of hepatocellular carcinoma after radiofrequency ablation. Liver Cancer. 2015;4:26–38. doi:10.1159/000343877
5. Zhang N, Ma D, Wang L, et al. Insufficient radiofrequency ablation treated hepatocellular carcinoma cells promote metastasis by up-regulation ITGB3. J Cancer. 2017;8:3742–3754. doi:10.7150/jca.20816
6. Guo Y, Ren Y, Dong X, et al. An overview of hepatocellular carcinoma after insufficient radiofrequency ablation. J Hepatocell Carcinoma. 2022;9:343–355. doi:10.2147/JHC.S358539
7. Tong Y, Yang H, Xu X, et al. Effect of a hypoxic microenvironment after radiofrequency ablation on residual hepatocellular cell migration and invasion. Cancer Sci. 2017;108:753–762. doi:10.1111/cas.13191
8. Canale M, Ulivi P, Foschi FG, et al. Clinical and circulating biomarkers of survival and recurrence after radiofrequency ablation in patients with hepatocellular carcinoma. Crit Rev Oncol Hematol. 2018;129:44–53. doi:10.1016/j.critrevonc.2018.06.017
9. Zhao Z, Wu J, Liu X, et al. Insufficient radiofrequency ablation promotes proliferation of residual hepatocellular carcinoma via autophagy. Cancer Lett. 2018;421:73–81. doi:10.1016/j.canlet.2018.02.024
10. Lee S, Kang TW, Song KD, et al. Effect of microvascular invasion risk on early recurrence of hepatocellular carcinoma after surgery and radiofrequency ablation. Ann Surg. 2021;273:564–571. doi:10.1097/SLA.0000000000003268
11. Ahn JC, Teng PC, Chen PJ, et al. Detection of circulating tumor cells and their implications as a biomarker for diagnosis, prognostication, and therapeutic monitoring in hepatocellular carcinoma. Hepatology. 2021;73:422–436. doi:10.1002/hep.31165
12. Tang F, Barbacioru C, Wang Y, et al. mRNA-Seq whole-transcriptome analysis of a single cell. Nat Methods. 2009;6:377–382. doi:10.1038/nmeth.1315
13. Nakai W, Kondo Y, Saitoh A, et al. ARF1 and ARF4 regulate recycling endosomal morphology and retrograde transport from endosomes to the Golgi apparatus. Mol Biol Cell. 2013;24:2570–2581. doi:10.1091/mbc.E13-04-0197
14. Niedziolka SM, Datta S, Uspienski T, et al. The exocyst complex and intracellular vesicles mediate soluble protein trafficking to the primary cilium. Commun Biol. 2024;7:213. doi:10.1038/s42003-024-05817-2
15. Casalou C, Ferreira A, Barral DC. The role of ARF family proteins and their regulators and effectors in cancer progression: a therapeutic perspective. Front Cell Dev Biol. 2020;8:217. doi:10.3389/fcell.2020.00217
16. Shirai R, Cho M, Isogai M, et al. FTD/ALS type 7-associated Thr104Asn mutation of CHMP2B blunts neuronal process elongation, and is recovered by knockdown of Arf4, the golgi stress regulator. Neurol Int. 2023;15:980–993. doi:10.3390/neurolint15030063
17. Budhiraja S, McManus G, Baisiwala S, et al. ARF4-mediated retrograde trafficking as a driver of chemoresistance in glioblastoma. Neuro Oncol. 2024;26:1421–1437. doi:10.1093/neuonc/noae059
18. Li Q, Li F, Song X, et al. Pan-cancer analysis of ARFs family and ARF5 promoted the progression of hepatocellular carcinoma. Heliyon. 2024;10:e29099. doi:10.1016/j.heliyon.2024.e29099
19. Li Q, Xiao M, Shi Y, et al. eIF5B regulates the expression of PD-L1 in prostate cancer cells by interacting with Wig1. BMC Cancer. 2021;21:1022. doi:10.1186/s12885-021-08749-w
20. Lee JW, Choi JJ, Lee KM, et al. eIF-4E expression is associated with histopathologic grades in cervical neoplasia. Hum Pathol. 2005;36:1197–1203. doi:10.1016/j.humpath.2005.08.010
21. Shahbazian D, Parsyan A, Petroulakis E, et al. eIF4B controls survival and proliferation and is regulated by proto-oncogenic signaling pathways. Cell Cycle. 2010;9:4106–4109. doi:10.4161/cc.9.20.13630
22. Shi JY, Wen R, Chen JY, et al. Genetic evidence supporting potential causal roles of EIF4 family in breast cancer: a two-sample randomized Mendelian study. Sci Rep. 2024;14:20191. doi:10.1038/s41598-024-71059-1
23. Suresh S, Chen B, Zhu J, et al. eIF5B drives integrated stress response-dependent translation of PD-L1 in lung cancer. Nat Cancer. 2020;1:533–545. doi:10.1038/s43018-020-0056-0
24. Hao Y, Hao S, Andersen-Nissen E, et al. Integrated analysis of multimodal single-cell data. Cell. 2021;184:3573–3587e3529. doi:10.1016/j.cell.2021.04.048
25. Liao J, Yu Z, Chen Y, et al. Single-cell RNA sequencing of human kidney. Sci Data. 2020;7:4. doi:10.1038/s41597-019-0351-8
26. Bravo Gonzalez-Blas C, De Winter S, Hulselmans G, et al. SCENIC+: single-cell multiomic inference of enhancers and gene regulatory networks. Nat Methods. 2023;20:1355–1367. doi:10.1038/s41592-023-01938-4
27. Ravi K, Zhang Y, Sakala L, et al. Tumor microenvironment On-A-Chip and single-cell analysis reveal synergistic stromal-immune crosstalk on breast cancer progression. Adv Sci. 2025:e2413457. doi:10.1002/advs.202413457
28. Butler A, Hoffman P, Smibert P, et al. Integrating single-cell transcriptomic data across different conditions, technologies, and species. Nat Biotechnol. 2018;36:411–420. doi:10.1038/nbt.4096
29. Zhou B, Jin W. Visualization of single cell RNA-Seq data using t-SNE in R. Methods Mol Biol. 2020;2117:159–167. doi:10.1007/978-1-0716-0301-7_8
30. Stuart T, Satija R. Integrative single-cell analysis. Nat Rev Genet. 2019;20:257–272. doi:10.1038/s41576-019-0093-7
31. Aran D, Looney AP, Liu L, et al. Reference-based analysis of lung single-cell sequencing reveals a transitional profibrotic macrophage. Nat Immunol. 2019;20:163–172. doi:10.1038/s41590-018-0276-y
32. Jin S, Guerrero-Juarez CF, Zhang L, et al. Inference and analysis of cell-cell communication using CellChat. Nat Commun. 2021;12:1088. doi:10.1038/s41467-021-21246-9
33. Ritchie ME, Phipson B, Wu D, et al. limma powers differential expression analyses for RNA-sequencing and microarray studies. Nucleic Acids Res. 2015;43:e47. doi:10.1093/nar/gkv007
34. Wilkerson MD, Hayes DN. ConsensusClusterPlus: a class discovery tool with confidence assessments and item tracking. Bioinformatics. 2010;26:1572–1573. doi:10.1093/bioinformatics/btq170
35. Hänzelmann S, Castelo R, Guinney J. GSVA: gene set variation analysis for microarray and RNA-seq data. BMC Bioinf. 2013;14. doi:10.1186/1471-2105-14-7
36. Yoshihara K, Shahmoradgoli M, Martinez E, et al. Inferring tumour purity and stromal and immune cell admixture from expression data. Nat Commun. 2013;4:2612. doi:10.1038/ncomms3612
37. Li T, Fan J, Wang B, et al. TIMER: a web server for comprehensive analysis of tumor-infiltrating immune cells. Cancer Res. 2017;77:e108–e110. doi:10.1158/0008-5472.CAN-17-0307
38. Geeleher P, Cox N, Huang RS. pRRophetic: an R package for prediction of clinical chemotherapeutic response from tumor gene expression levels. PLoS One. 2014;9:e107468. doi:10.1371/journal.pone.0107468
39. van Dijk PC, Jager KJ, Zwinderman AH, et al. The analysis of survival data in nephrology: basic concepts and methods of Cox regression. Kidney Int. 2008;74:705–709. doi:10.1038/ki.2008.294
40. Tibshirani R. The lasso method for variable selection in the Cox model. Stat Med. 1997;16:385–395.
41. Xu XL, Liu XD, Liang M, et al. Radiofrequency ablation versus hepatic resection for small hepatocellular carcinoma: systematic review of randomized controlled trials with meta-analysis and trial sequential analysis. Radiology. 2018;287:461–472. doi:10.1148/radiol.2017162756
42. Bai XM, Cui M, Yang W, et al. The 10-year survival analysis of radiofrequency ablation for solitary hepatocellular carcinoma 5 cm or smaller: primary versus recurrent HCC. Radiology. 2021;300:458–469. doi:10.1148/radiol.2021200153
43. Dromi SA, Walsh MP, Herby S, et al. Radiofrequency ablation induces antigen-presenting cell infiltration and amplification of weak tumor-induced immunity. Radiology. 2009;251:58–66. doi:10.1148/radiol.2511072175
44. Shi L, Chen L, Wu C, et al. PD-1 blockade boosts radiofrequency ablation-elicited adaptive immune responses against tumor. Clin Cancer Res. 2016;22:1173–1184. doi:10.1158/1078-0432.CCR-15-1352
45. Peng S, Chen S, Hu W, et al. Combination neoantigen-based dendritic cell vaccination and adoptive T-cell transfer induces antitumor responses against recurrence of hepatocellular carcinoma. Cancer Immunol Res. 2022;10:728–744. doi:10.1158/2326-6066.CIR-21-0931
46. Liang Y, Li L, Liu B, et al. [Research Advances in the Roles of High-Altitude Hypoxic Stress in Hepatocellular Carcinoma]. Sichuan Da Xue Xue Bao Yi Xue Ban. 2024;55:1436–1445. Danish. doi:10.12182/20241160605
47. Peng C, Li X, Ao F, et al. Mitochondrial ROS driven by NOX4 upregulation promotes hepatocellular carcinoma cell survival after incomplete radiofrequency ablation by inducing of mitophagy via Nrf2/PINK1. J Transl Med. 2023;21:218. doi:10.1186/s12967-023-04067-w
48. Wang F, Xu C, Li G, et al. Incomplete radiofrequency ablation induced chemoresistance by up-regulating heat shock protein 70 in hepatocellular carcinoma. Exp Cell Res. 2021;409:112910. doi:10.1016/j.yexcr.2021.112910
49. Long J, Wang A, Bai Y, et al. Development and validation of a TP53-associated immune prognostic model for hepatocellular carcinoma. EBioMedicine. 2019;42:363–374. doi:10.1016/j.ebiom.2019.03.022
50. Lin WP, Xing KL, Fu JC, et al. Development and validation of a model including distinct vascular patterns to estimate survival in hepatocellular carcinoma. JAMA Network Open. 2021;4:e2125055. doi:10.1001/jamanetworkopen.2021.25055
51. Cao J, Xu Y, Liu X, et al. Innovative signature establishment using lymphangiogenesis-related lncRNA pairs to predict prognosis of hepatocellular carcinoma. Heliyon. 2022;8:e10215. doi:10.1016/j.heliyon.2022.e10215
52. Wu Q, Ren X, Zhang Y, et al. MiR-221-3p targets ARF4 and inhibits the proliferation and migration of epithelial ovarian cancer cells. Biochem Biophys Res Commun. 2018;497:1162–1170. doi:10.1016/j.bbrc.2017.01.002
53. Ross JA, Dungen KV, Bressler KR, et al. Eukaryotic initiation factor 5B (eIF5B) provides a critical cell survival switch to glioblastoma cells via regulation of apoptosis. Cell Death Dis. 2019;10:57. doi:10.1038/s41419-018-1283-5
54. Chukka PAR, Wetmore SD, Thakor N. Established and emerging regulatory roles of eukaryotic translation initiation factor 5B (eIF5B). Front Genet. 2021;12:737433. doi:10.3389/fgene.2021.737433
55. Zhang Y, Zhang Y, Wang J, et al. Amarogentin inhibits liver cancer cell angiogenesis after insufficient radiofrequency ablation via affecting stemness and the p53-Dependent VEGFA/Dll4/Notch1 pathway. Biomed Res Int. 2020;2020:5391058. doi:10.1155/2020/5391058
56. Wang Y, Wang GZ, Chen C, et al. Exploration of the impact of multimode thermal therapy versus radiofrequency ablation on CD8(+) T effector cells of liver malignancies based on single cell transcriptomics. Front Immunol. 2023;14:1172362. doi:10.3389/fimmu.2023.1172362
57. Tufail M, Jiang CH, Li N. Wnt signaling in cancer: from biomarkers to targeted therapies and clinical translation. Mol Cancer. 2025;24:107. doi:10.1186/s12943-025-02306-w
58. Aoki T, Nishida N, Kurebayashi Y, et al. Two distinct characteristics of immune microenvironment in human hepatocellular carcinoma with Wnt/beta-Catenin mutations. Liver Cancer. 2024;13:285–305. doi:10.1159/000533818
59. Pastushenko I, Blanpain C. EMT transition states during tumor progression and metastasis. Trends Cell Biol. 2019;29:212–226. doi:10.1016/j.tcb.2018.12.001
 © 2025 The Author(s). This work is published and licensed by Dove Medical Press Limited. The
full terms of this license are available at https://www.dovepress.com/terms.php
and incorporate the Creative Commons Attribution
- Non Commercial (unported, 4.0) License.
By accessing the work you hereby accept the Terms. Non-commercial uses of the work are permitted
without any further permission from Dove Medical Press Limited, provided the work is properly
attributed. For permission for commercial use of this work, please see paragraphs 4.2 and 5 of our Terms.
© 2025 The Author(s). This work is published and licensed by Dove Medical Press Limited. The
full terms of this license are available at https://www.dovepress.com/terms.php
and incorporate the Creative Commons Attribution
- Non Commercial (unported, 4.0) License.
By accessing the work you hereby accept the Terms. Non-commercial uses of the work are permitted
without any further permission from Dove Medical Press Limited, provided the work is properly
attributed. For permission for commercial use of this work, please see paragraphs 4.2 and 5 of our Terms.