")
Back to Journals » Journal of Inflammation Research » Volume 17
Development and Validation of a Nomogram Based on Inflammatory Markers for Risk Prediction in Meige Syndrome Patients
Authors Fu R, Lian W, Zhang B, Liu G, Feng X, Zhu Y, Zhou J, Zhang X, Wang S, Huo H, Wang D, Liu C, Gao S, Ma Y, Peng M
Received 6 June 2024
Accepted for publication 17 October 2024
Published 25 October 2024 Volume 2024:17 Pages 7721—7731
DOI https://doi.org/10.2147/JIR.S481649
Checked for plagiarism Yes
Review by Single anonymous peer review
Peer reviewer comments 2
Editor who approved publication: Professor Ning Quan
Runing Fu,1,* Wenping Lian,1,* Bohao Zhang,2,* Gang Liu,3 Xinyu Feng,1 Yingjie Zhu,1 Jiuan Zhou,1 Xinyu Zhang,4 Shukai Wang,1 Huijuan Huo,1 Daxin Wang,1 Cui Liu,1 Saisai Gao,1 Yajie Ma,4 Mengle Peng1,*
1Department of Clinical Laboratory, The Third People’s Hospital of Henan Province, Zhengzhou, Henan, 450006, People’s Republic of China; 2Department of Oncology, The First Affiliated Hospital of Zhengzhou University, Zhengzhou, Henan, 450000, People’s Republic of China; 3The Center of Meige Syndrome, The Third People’s Hospital of Henan Province, Zhengzhou, Henan, 450006, People’s Republic of China; 4Department of Medical Affair, the Third People’s Hospital of Henan Province, Zhengzhou, Henan, 450006, People’s Republic of China
*These authors contributed equally to this work
Correspondence: Mengle Peng; Yajie Ma, Email [email protected]; [email protected]
Purpose: Inflammatory markers are known to be associated with many diseases, but their role in Meige syndrome (MS) remains unclear. This study aimed to develop and validate a nomogram for the risk prediction of MS based on inflammatory markers.
Patient Data and Methods: Data from 448 consecutive patients with MS at the Third People’s Hospital of Henan Province between January 2022 and December 2023 were retrospectively reviewed. The MS cohort was randomly divided into separate training and validation sets. A nomogram was constructed using a multivariate logistic regression model based on data from the training set. The model’s performance was validated through cross-validation, receiver operating characteristic (ROC) curve analysis, calibration curve analysis and decision curve analysis (DCA).
Results: A total of five predictors, including red blood cell distribution width (RDW), hemoglobin (HGB), high-density lipoprotein cholesterol (HDL-C), the lymphocyte-to-monocyte ratio (LMR), and the systemic immune‐inflammation index (SII), were identified using multivariate logistic regression from a total of 11 variables. The cross-validation results indicated the stability of the model constructed with the above five predictors. The model showed moderate predictive ability, with an area under the ROC curve of 0.767 in the training set and 0.735 in the validation set. The calibration curve and DCA results indicate that the model has strong consistency and significant potential for clinical application.
Conclusion: We constructed a nomogram based on five risk predictors, RDW, HGB, HDL-C, the LMR and the SII, to predict MS and enhance the predictive accuracy for identifying MS risk.
Keywords: Meige syndrome, inflammatory marker, nomogram, LMR, SII
Introduction
Meige syndrome (MS), also known as a rare adult-onset dystonia described by the French neurologist Henry Meige in 1910, is characterized by blepharospasm, oromandibular dystonia and cervical dystonia.1 MS generally affects individuals between the ages of 40 and 70, with a higher incidence observed in women than in men,2 the etiology and pathogenesis of MS are not fully understood. Secondary cases of MS can occur following the prolonged use of neuroleptics or the presence of underlying brain disorders. The current clinical treatments available for MS patients include oral medication, Botulinum toxin (BoNT) injection, deep brain stimulation (DBS), and surgical treatments.3–5 Currently, the diagnosis of MS relies primarily on patients’ symptoms, and there is no usable gold standard diagnostic test. Thus, there is an unmet need for the identification of reliable biomarkers in the diagnosis of MS.
Additionally, MS is a neural network disorder in which connections between the basal ganglia and supplementary motor areas, premotor cortex, sensorimotor cortex, parietal cortex and precuneus are altered.6 Some research has suggested that MS is mainly associated with an aberrant acetylcholine/dopamine balance, whereas other studies have proposed that cortical inhibition reduction and alterations in neuronal plasticity may cause MS.7 In neural network disorders, increased levels of inflammatory molecules can lead to progressive neurodegeneration and functional impairment, which are characteristic of neuroinflammation.8,9 Many studies have indicated that neuroinflammation plays a significant role in the pathological processes of different neurodegenerative diseases and brain injuries, such as Alzheimer’s disease (AD), Parkinson’s disease (PD) and multiple system atrophy (MSA).10–12 In the brain, both glial and immune cells can be activated by peripherally-derived inflammatory mediators and brain-derived inflammatory cytokines, chemokines, beta-amyloid 1–42 (Aβ1-42) peptide, α-synuclein, corticotropin-releasing hormone (CRH), amyloid precursor proteins (APP) and substance P (SP), leading to the release of neurotoxic mediators and inflammatory factors, as well as the progression of chronic neuroinflammation and neurodegeneration.13 The close association between neuroinflammation and neurodegeneration suggests that neuroinflammatory mechanisms may trigger neuronal degeneration, leading to neurotoxicity and neuronal cell loss.14
In recent years, complete blood cell count (CBC)-derived parameters such as the neutrophil-to-lymphocyte ratio (NLR), neutrophil-to-monocyte ratio (NMR), lymphocyte-to-monocyte ratio (LMR), system inflammation response index (SIRI), systemic immune‐inflammation index (SII) and pan-immune inflammation value (PIV) have been reported to act as valuable inflammatory markers in neurological diseases,15,16 which may support the potential hypothesis of inflammatory etiopathogenesis. These parameters can be easily analyzed from blood samples obtained under normal laboratory conditions, with low-cost and reproducible tests. To our knowledge, this study is the first to explore the relationship between these blood-based inflammatory indicators and MS, with the largest number of MS samples. The goal of the current study was to explore possible indicators for predicting the diagnosis of MS.
Materials and Methods
Study Population
This was a single-center retrospective study. Patients with MS from around the country were admitted to the Third People’s Hospital of Henan Province from January 2022 to December 2023 and screened according to the inclusion and exclusion criteria. This study was approved by the Third People’s Hospital of Henan Province Research Ethics Committee (2024-SZSYKY-009). Written informed consent was obtained from all patients/participants prior to their involvement in the study. This study was conducted according to the Declaration of Helsinki and institutional guidelines.
The inclusion criteria were as follows: all patients were diagnosed with primary MS by two clinicians according to the clinical criteria. The exclusion criteria were as follows: (1) infection, blood system diseases or immune system diseases present; (2) severe organ function injuries; (3) other dystonic disorders; and (4) incomplete key variables, including hemoglobin (HGB), red blood cell distribution width (RDW), neutrophil, lymphocyte, monocyte, platelet, and high-density lipoprotein cholesterol (HDL-C) levels.
Data Collection
Clinical and laboratory information for all patients was collected from medical records. Clinical information included age, sex, HGB level, the RDW, neutrophil count, lymphocyte count, monocyte count, platelet count (Mindray CAL-8000, China) and HDL-C level (Beckman AU680, USA). The various ratios were calculated as follows: NLR = neutrophil/lymphocyte; NMR = neutrophil/monocyte; LMR = lymphocyte/monocyte; SII = (neutrophil × platelet)/lymphocyte; SIRI = (monocyte × neutrophil)/lymphocyte; PIV = (neutrophil × monocyte × platelet)/lymphocyte.
Statistical Analysis
The statistical analyses were performed using R version 4.2.1. The normality of the data was assessed using the Shapiro‒Wilk test. When the measurement data exhibited a normal distribution, they were presented as the mean ± standard deviation (mean ± SD), and a Student’s t test was employed to determine any differences between the two sets. When the measurement data were not normally distributed, the Wilcoxon‒Mann‒Whitney test was used, and the data were presented as the median (quartile) [M (P25, p75)]. Pearson’s chi-square test was used to compare the measurement data between groups, and the results were expressed as n (%). A univariate logistic regression model was employed to screen the variables. The predictors necessary for the final model were identified using a combination of the random forest algorithm, the Spearman correlation analysis, and the variance inflation index (VIF). After excluding collinearity, the predictors needed for the final model were identified. Nomograms were subsequently constructed using the RMS package in R. The performance of the nomogram was assessed through receiver operating characteristic (ROC) curves, calibration curves and decision curve analysis (DCA). Internal validation of the model was performed via fivefold cross-validation. A significance level of P < 0.05 was used to determine statistical significance.
Results
Patient Characteristics
A total of 469 patients with MS met the inclusion criteria. We excluded 12 patients with infectious diseases, 4 patients with PD, 4 patients with immune system diseases, and 1 patient with kidney function injuries. Ultimately, a total of 448 MS patients and 814 age- and sex-matched healthy controls (HCs) were included. The MS cohort was subsequently divided into a training set (320 cases) and a validation set (128 cases) using random stratified sampling at a ratio of 7:3 (Figure 1). There was no significant difference in sex or age between MS patients and HCs (P > 0.05). Compared with those in HCs, the levels of monocytes and HDL-C were elevated in the MS group (P < 0.05), while the levels of erythrocytes, HGB, the RDW, neutrophils, lymphocytes, platelets, the LMR, the NMR, and the SII were lower (P < 0.05) (Table 1).
 |
Table 1 Characteristics of the Patients with MS and Healthy Controls |
 |
Figure 1 Study flow chart. |
Logistic Regression Analyses in the MS
We used univariate analysis to screen variables, and variables with statistically significant differences (P < 0.05) were included in the multivariate logistic regression analysis to further determine the independent influencing factors (P < 0.05) (Supplementary Figure 1). In this study, the 11 variables identified by the univariate analysis were ranked by the importance of the random forest (Supplementary Figure 2). Spearman correlation analysis (r > 0.5) and the VIF (VIF < 5) were used for multicollinearity analysis to determine the collinearity between the variables (Supplementary Table 1, Supplementary Figure 3). After collinearity was excluded, multivariate logistic regression analysis revealed that the RDW (OR, 0.893; 95% CI, 0.841–0.947; P < 0.001), HGB (OR, 0.947; 95% CI, 0.937–0.957; P < 0.001), HDL-C (OR, 2.502; 95% CI, 1.505–4.156; P < 0.001), the LMR (OR, 0.721; 95% CI, 0.674–0.772; P < 0.001), and the SII (OR, 0.770; 95% CI, 0.706–0.840; P < 0.001) were independently influencing predictors (Table 2).
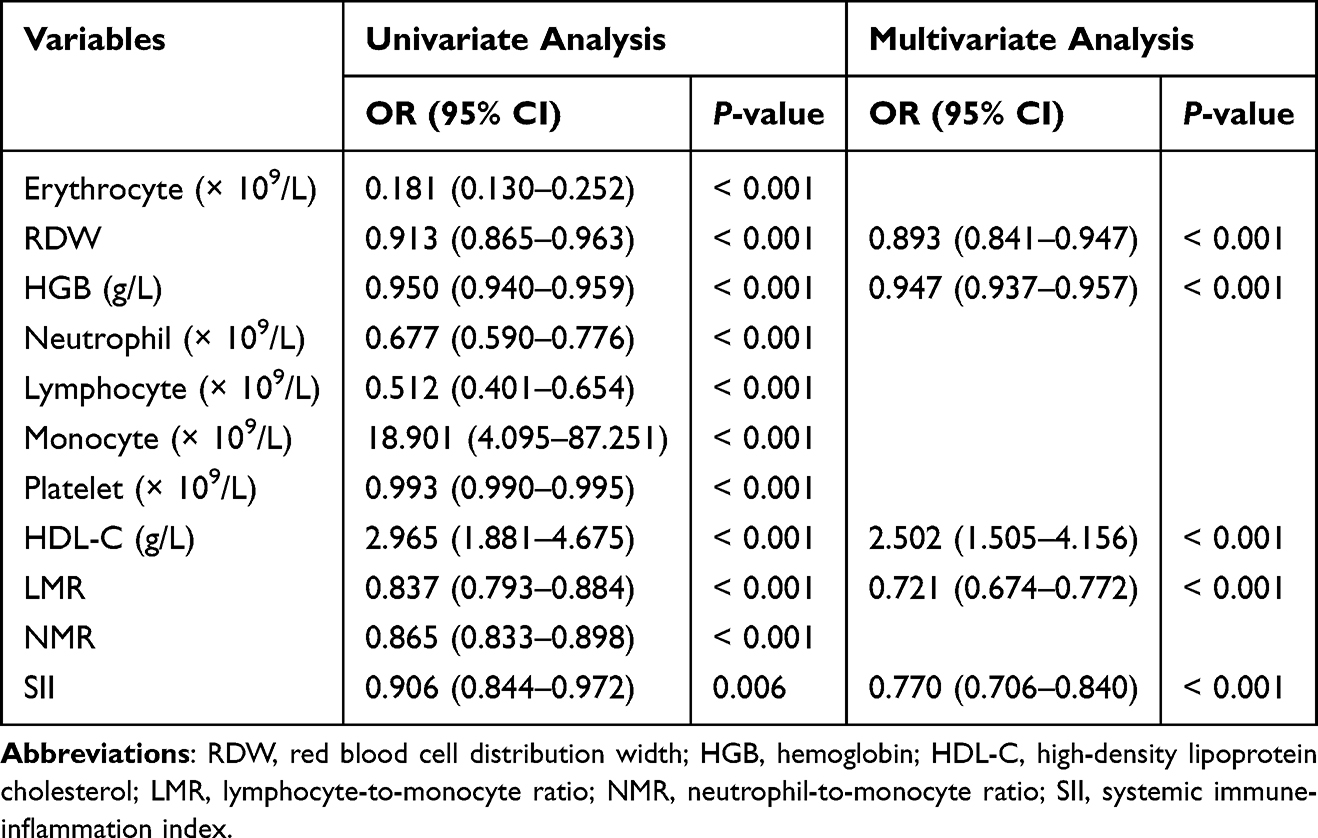 |
Table 2 Univariate and Multivariate Logistic Regression Analyses for MS |
Construction of the MS-Predicting Nomogram
There was no significant difference between the training set and the validation set (Table 3). A nomogram was constructed according to 5 independent predictors and developed with data from the training set (Figure 2). A detailed scoring table was constructed according to the nomogram. The total score for the nomogram model was 260. When the total scores were 201, 212, and 233 points, the predicted probabilities of MS occurrence were 30%, 50%, and 70%, respectively. In our study, a nomogram was constructed based on the following formula: prediction probability =1/[1+exp (0.098915 * RDW+0.053656 * HGB - 0.72133 * HDL-C + 0.30394 * LMR + 0.30394 * SII-12.953)]. To illustrate its application, a randomly selected patient from the training set was considered. The patient had an RDW value of 41.4. Additionally, the HGB value was 119 g/L, the HDL-C value was 1.11 g/L, the LMR value was 5.58, and the SII value was 3.22. Based on the formula calculation, the predicted risk of having MS was 0.645 (Supplementary Figure 4). This score provides important information for further clinical assessment and decision-making.
 |
Table 3 Characteristics of Patients with MS in the Training and Validation Sets |
 |
Figure 2 Nomogram for predicting MS using the baseline RDW, HGB, HDL-C, the LMR and the SII as indicators. Each variable is assigned a score on the points scale. The sum of each score is obtained as the total points. The total points correspond to the estimated probability for MS. |
Internal Prediction Model Validation
To ensure the reliability and robustness of our prediction model, we employed a fivefold cross-validation for internal validation. This approach involves randomly dividing the dataset into five subsets. In each iteration, one subset is used as the validation set, while the remaining four subsets are combined to form the training set. This process is repeated five times, with each subset serving as the validation set exactly once. During internal validation, the area under the ROC curve (AUC), which is a measure of discriminative ability, was found to be 0.752. This provides a level of confidence in the predictive power of our model (Supplementary Figure 5).
Validation of the MS-Predicting Nomogram
The nomogram exhibited good discriminative ability in both datasets. The training set demonstrated an AUC of 0.767 (95% CI: 0.735–0.799), with a sensitivity of 61.25% and a specificity of 78.37%. In the validation set, the AUC was 0.735 (95% CI: 0.684–0.787), with a sensitivity of 59.38% and a specificity of 78.75% (Figure 3). In the training set, the Hosmer–Lemeshow statistics revealed a chi-square value of 14.324, 8 degrees of freedom and P = 0.074. In the validation set, the Hosmer–Lemeshow statistic had a chi-square value of 10.955, 8 degrees of freedom and P = 0.204 (Supplementary Table 2). The calibration curve indicated that the nomogram-predicted probabilities were very close to the actual probabilities in both sets (Figure 4A and B). In addition, DCA curves were used to evaluate the clinical benefit of the nomogram model in predicting MS. When the threshold probabilities of the nomogram model were in the range of 0–0.71, the net benefit ratio was > 0, which suggested that the model had a better clinical value for predicting MS (Figure 4C and D). All these results suggest that the nomogram has a well-recognized predictive and discriminative performance.
 |
Figure 3 Receiver operating characteristic (ROC) curves for the training set and the validation set. The dot on the curve indicates the point corresponding to the optimal cutoff value. |
 |
Figure 4 The predictive value and clinical use of the nomogram model. Calibration curve of the training set (A). Calibration curve of the validation set (B). DCA curve of the training set (C). DCA curve of the validation set (D). |
Discussions
In this study, we performed a retrospective analysis of data from 448 patients diagnosed with MS. The results of multivariate logistic regression analysis revealed that the RDW, HGB, HDL-C, the LMR, and the SII were associated with the risk prediction of MS. These biomarkers are routine and readily available under normal laboratory conditions. We combined these variables in a nomogram to construct a predictive model. The results revealed that the areas under the ROC curve for the training set and the validation set were 0.767 (95% CI: 0.735–0.799) and 0.735 (95% CI: 0.684–0.787), respectively. The calibration curve and DCA results show that the proposed model has good consistency and clinical application value.
Recently, increasing evidence has supported the role of peripheral blood markers in the pathophysiology of neurodegeneration.17 Cytokines that regulate communication between central immune compartments and peripheral blood appear to be dysregulated in the cerebrospinal fluid and peripheral blood of PD patients.18 The levels of cytokines with proinflammatory, anti-inflammatory, and chemotactic effects in the cerebrospinal fluid of patients with MS are significantly increased.12 Nevertheless, no evidence currently exists for the association between peripheral blood inflammatory markers and MS. Therefore, evaluating the correlations between peripheral blood inflammatory markers and MS is necessary.
The RDW is linked with neuronal injury in the context of acute ischemic stroke. This hematological marker can be easily, safely, and economically assessed through an automated hematology analyzer as a part of the complete blood count.19 Recent studies have revealed that the RDW possibly reflects oxidative stress (OS) impairment and the underlying inflammatory state.20 Furthermore, increased RDWs have been shown to be valid predictors of neuronal impairment.21 In our study, the RDW was lower in MS patients than in HCs, suggesting that a decreased RDW may be a risk factor associated with MS.
HGB is an iron-containing protein in erythrocytes and is essential for the transport of oxygen, nitric oxide, and carbon dioxide in mammals.22 It is composed of a tetrameric configuration comprising two β-globin chains (HBBs) and two α-globin chains (HBAs).23 Each monomeric globin chain incorporates a heme prosthetic group. Heme is a potent stimulator of globin chain transcription.24 HGB is not confined exclusively to erythrocytes but is also expressed in neuronal cells. Thus, based on the known roles of HGB in the blood, neuronal HGB may have a biological function related to its role in erythrocytes. For example, the upregulation of neuronal HGB by transgenic overexpression or injection of EPO enhances mitochondrial activity and brain oxygenation under hypoxic or physiological conditions, suggesting that HGB in neurons is involved in oxygen storage and mitochondria-related neuroprotection.25 Several studies have revealed that patients with lower HGB levels are more susceptible to PD.26 Similarly, we found that the HGB levels in the peripheral blood of patients with MS was significantly lower than that in the peripheral blood of HCs.
HDL-C is a heterogeneous lipoprotein composed of various proteins and lipids. Apolipoprotein (apo) A1 is the main protein component of circulatory HDL-C, whereas apoC3, apoJ and apoE are rare HDL-C constituents found at 10- to 100-fold lower concentrations than apoA1 in the HDL-C fraction of the plasma.27 HDL-C is synthesized both in the brain and in systemic circulation. In addition to its important role in the cholesterol reverse transport pathway, HDL-C has a wide range of other functions, including pro-endothelial function, anti-inflammatory effects, antioxidation, regulated immunity, and antithrombotic effects.28 Recently, the benefits of HDL-C have been suggested to extend beyond the cardiovascular system to the central nervous system.29 A recent study demonstrated that insufficient or impaired brain HDL-C could play a role in the development of cerebrovascular dysfunctions, neurodegeneration, or neurovascular instability.28 An early study with 334 elderly French subjects revealed that high HDL-C cholesterol levels were associated with a significantly decreased risk of AD.30 Furthermore, a study with a group of 139 centenarians (Ashkenazi Jews older than 95 years) revealed that plasma HDL-C levels were highly and positively correlated with cognitive function.31 However, in our investigation, we noted increased levels of HDL-C in the MS group, which diverges from findings in other studies on neurodegeneration. HDL-C has both anti-inflammatory and proinflammatory effects.32 For example, HDL-mediated passive cholesterol depletion (independent of cholesterol transporters) and lipid raft disruption can activate multiple protein kinase C isoforms, leading to the production of proinflammatory cytokines, including TNF-α and IL-12, and the reduction of IL-10.33 HDL-C therefore may exert anti- or proinflammatory effects, depending on the adaptations occurring in cell cholesterol content, which may explain some of the discrepancies regarding the association of HDL-C levels with disease status in clinical studies.
Neutrophils and lymphocytes serve as crucial markers of inflammation and are associated with the occurrence, development, and severity of inflammation. Monocytes can stimulate the synthesis of proinflammatory cytokines, including TNF-α and IL-10, and exhibit robust antigen-presenting capabilities, playing a pivotal role in activation and phagocytosis during inflammatory events.34 Previous studies have indicated the upregulation of monocytes and their precursors in the peripheral circulation of PD patients.35 Platelets actively participate in inflammatory processes through their mediation of leukocyte adhesion and extravasation.36 Thrombocytosis serves as an indicator of a heightened extent of suppurative infection.37 In recent years, as innovative biomarkers reflecting systemic inflammation, the LMR and the SII have been widely applied to primary and secondary tumors and cerebrovascular diseases.38,39 However, there are no relevant studies on the LMR and the SII in MS patients. Our results indicate that the value of LMR and SII in the MS group were significantly lower than that in the HCs (P < 0.05), suggesting a potential correlation between MS patients and the LMR and the SII. These findings suggest a possible association of MS with peripheral inflammation.
The present study was the first to construct an MS-predicting nomogram based on inflammatory markers. The factors incorporated into our predictive model are readily obtainable. This enhances the convenience of utilizing the predictive model. However, the current study has several limitations. First, although the RDW, HGB, HDL-C, the LMR, and the SII have been identified as markers of inflammation in the peripheral circulation, they lack the specificity of definitive inflammatory markers and can be influenced by various factors. This makes it challenging to draw definite conclusions about their specific effects on certain neuroinflammatory pathways. Second, this was a single-center retrospective study. The data from a single center limits the generalizability of the findings; thus, further verification with multicenter data is needed in future studies. Moreover, owing to its retrospective nature, we were unable to obtain accurate data on several potential confounding factors, such as the patients’ preadmission medication history and dietary habits. Finally, the diagnostic process for MS patients is complex. Obtaining predisease data is extremely difficult. Consequently, the data collected in this experiment consisted solely of clinical test results obtained after diagnosis.
Conclusions
In conclusion, our findings suggest that the RDW, HGB, HDL-C, the LMR, and the SII may serve as effective biomarkers for predicting MS with significant clinical relevance. We subsequently developed a nomogram based on these five risk predictors to predict the risk likelihood of MS. The reliability and accuracy of the nomograms were subsequently validated for their ability to identify MS. Therefore, this nomogram can be utilized as a straightforward and cost-effective tool to facilitate the diagnosis of MS.
Data Sharing Statement
The datasets used and/or analyzed in the study are available from the corresponding author upon reasonable request.
Ethics Approval and Informed Consent
This study was approved by the Third People’s Hospital of Henan Province Research Ethics Committee (2024-SZSYKY-009). Written informed consent was obtained from all patients/participants prior to their involvement in the study. This study was conducted according to the Declaration of Helsinki and institutional guidelines.
Acknowledgments
We thank the Third People’s Hospital of Henan Province for providing the necessary data for this study and thank all the participants in this study.
Author Contributions
All authors made a significant contribution to the work reported, whether that is in the conception, study design, execution, acquisition of data, analysis and interpretation, or in all these areas; took part in drafting, revising or critically reviewing the article; gave final approval of the version to be published; have agreed on the journal to which the article has been submitted; and agree to be accountable for all aspects of the work.
Funding
This research is supported by the Key and Promotion Special Project of Henan Province (Grant No. 232102311046), as well as the Internal Scientific Project of the Third People’s Hospital of Henan Province (Grant No. HNSZSYKY220011).
Disclosure
The authors report no conflicts of interest in this work.
References
1. Pandey S, Sharma S. Meige’s syndrome: history, epidemiology, clinical features, pathogenesis and treatment. J Neurol Sci. 2017;372:162–170. doi:10.1016/j.jns.2016.11.053
2. Liu J, Li L, Li Y, Wang Q, Liu R, Ding H. Metabolic imaging of deep brain stimulation in Meige syndrome. Front Aging Neurosci. 2022;14:848100. doi:10.3389/fnagi.2022.848100
3. Kraft SP, Lang AE. Cranial dystonia, blepharospasm and hemifacial spasm: clinical features and treatment, including the use of botulinum toxin. Cmaj. 1988;139(9):837–844.
4. Hao QP, Zheng WT, Zhang ZH, et al. Subthalamic nucleus deep brain stimulation in primary Meige syndrome: motor and non-motor outcomes. Eur J Neurol. 2024;31(2):e16121. doi:10.1111/ene.16121
5. Jinnah HA, Factor SA. Diagnosis and treatment of dystonia. Neurol Clin. 2015;33(1):77–100. doi:10.1016/j.ncl.2014.09.002
6. Zheng H, Wu L, Tian S, et al. Effect of botulinum toxin type A on non-motor symptoms and quality of life in Meige syndrome. Front Neurol. 2023;14:1115482. doi:10.3389/fneur.2023.1115482
7. Ribot B, Aupy J, Vidailhet M, et al. Dystonia and dopamine: from phenomenology to pathophysiology. Prog Neurobiol. 2019;182:101678. doi:10.1016/j.pneurobio.2019.101678
8. Moyse E, Krantic S, Djellouli N, et al. Neuroinflammation: a possible link between chronic vascular disorders and neurodegenerative diseases. Front Aging Neurosci. 2022;14:827263. doi:10.3389/fnagi.2022.827263
9. Dhapola R, Hota SS, Sarma P, Bhattacharyya A, Medhi B, Reddy DH. Recent advances in molecular pathways and therapeutic implications targeting neuroinflammation for Alzheimer’s disease. Inflammopharmacology. 2021;29(6):1669–1681. doi:10.1007/s10787-021-00889-6
10. Singhal G, Jaehne EJ, Corrigan F, Toben C, Baune BT. Inflammasomes in neuroinflammation and changes in brain function: a focused review. Front Neurosci. 2014;8:315. doi:10.3389/fnins.2014.00315
11. Kim JH, Kwon O, Bhusal A, et al. Neuroinflammation induced by transgenic expression of lipocalin-2 in astrocytes. Front Cell Neurosci. 2022;16:839118. doi:10.3389/fncel.2022.839118
12. Yamasaki R, Yamaguchi H, Matsushita T, Fujii T, Hiwatashi A, Kira JI. Early strong intrathecal inflammation in cerebellar type multiple system atrophy by cerebrospinal fluid cytokine/chemokine profiles: a case control study. J Neuroinflammation. 2017;14(1):89. doi:10.1186/s12974-017-0863-0
13. Kempuraj D, Thangavel R, Selvakumar GP, et al. Brain and peripheral atypical inflammatory mediators potentiate neuroinflammation and neurodegeneration. Front Cell Neurosci. 2017;11:216. doi:10.3389/fncel.2017.00216
14. Qin P, Sun Y, Li L. Mitochondrial dysfunction in chronic neuroinflammatory diseases (Review). Int J Mol Med. 2024;53(5). doi:10.3892/ijmm.2024.5371
15. Novellino F, Donato A, Malara N, Madrigal JL, Donato G. Complete blood cell count-derived ratios can be useful biomarkers for neurological diseases. Int J Immunopathol Pharmacol. 2021;35:20587384211048264. doi:10.1177/20587384211048264
16. Madetko N, Migda B, Alster P, Turski P, Koziorowski D, Friedman A. Platelet-to-lymphocyte ratio and neutrophil-tolymphocyte ratio may reflect differences in PD and MSA-P neuroinflammation patterns. Neurol Neurochir Pol. 2022;56(2):148–155. doi:10.5603/PJNNS.a2022.0014
17. Muñoz-Delgado L, Macías-García D, Periñán MT, et al. Peripheral inflammatory immune response differs among sporadic and familial Parkinson’s disease. NPJ Parkinsons Dis. 2023;9(1):12. doi:10.1038/s41531-023-00457-5
18. Tansey MG, Romero-Ramos M. Immune system responses in Parkinson’s disease: early and dynamic. Eur J Neurosci. 2019;49(3):364–383. doi:10.1111/ejn.14290
19. Mohindra R, Mishra U, Mathew R, Negi NS. Red cell distribution width (RDW) index as a predictor of severity of acute ischemic stroke: a correlation study. Adv J Emerg Med. 2020;4(2):e24. doi:10.22114/ajem.v0i0.257
20. Zhao Z, Liu T, Li J, Yang W, Liu E, Li G. Elevated red cell distribution width level is associated with oxidative stress and inflammation in a canine model of rapid atrial pacing. Int J Cardiol. 2014;174(1):174–176. doi:10.1016/j.ijcard.2014.03.189
21. Hong RH, Zhu J, Li ZZ, et al. Red blood cell distribution width is associated with neuronal damage in acute ischemic stroke. Aging. 2020;12(10):9855–9867. doi:10.18632/aging.103250
22. Gell DA. Structure and function of haemoglobins. Blood Cells Mol Dis. 2018;70:13–42. doi:10.1016/j.bcmd.2017.10.006
23. Zhao X, Zhou J, Du G, Chen J. Recent advances in the microbial synthesis of hemoglobin. Trends Biotechnol. 2021;39(3):286–297. doi:10.1016/j.tibtech.2020.08.004
24. Saha D, Patgaonkar M, Shroff A, Ayyar K, Bashir T, Reddy KV. Hemoglobin expression in nonerythroid cells: novel or ubiquitous? Int J Inflam. 2014;2014:803237. doi:10.1155/2014/803237
25. Schelshorn DW, Schneider A, Kuschinsky W, et al. Expression of hemoglobin in rodent neurons. J Cereb Blood Flow Metab. 2009;29(3):585–595. doi:10.1038/jcbfm.2008.152
26. Deng Q, Zhou X, Chen J, et al. Lower hemoglobin levels in patients with Parkinson’s disease are associated with disease severity and iron metabolism. Brain Res. 2017;1655:145–151. doi:10.1016/j.brainres.2016.11.007
27. Koch M, Furtado JD, Falk K, Leypoldt F, Mukamal KJ, Jensen MK. Apolipoproteins and their subspecies in human cerebrospinal fluid and plasma. Alzheimers Dement. 2017;6(1):182–187. doi:10.1016/j.dadm.2017.01.007
28. Bahrami A, Barreto GE, Lombardi G, Pirro M, Sahebkar A. Emerging roles for high-density lipoproteins in neurodegenerative disorders. Biofactors. 2019;45(5):725–739. doi:10.1002/biof.1541
29. Hottman DA, Chernick D, Cheng S, Wang Z, Li L. HDL and cognition in neurodegenerative disorders. Neurobiol Dis. 2014;72 Pt A:22–36. doi:10.1016/j.nbd.2014.07.015
30. Bonarek M, Barberger-Gateau P, Letenneur L, et al. Relationships between cholesterol, apolipoprotein E polymorphism and dementia: a cross-sectional analysis from the PAQUID study. Neuroepidemiology. 2000;19(3):141–148. doi:10.1159/000026249
31. Atzmon G, Gabriely I, Greiner W, Davidson D, Schechter C, Barzilai N. Plasma HDL levels highly correlate with cognitive function in exceptional longevity. J Gerontol a Biol Sci Med Sci. 2002;57(11):M712–715. doi:10.1093/gerona/57.11.m712
32. Navab M, Ananthramaiah GM, Reddy ST, et al. The double jeopardy of HDL. Ann Med. 2005;37(3):173–178. doi:10.1080/07853890510007322
33. van der Vorst EPC, Theodorou K, Wu Y, et al. High-density lipoproteins exert pro-inflammatory effects on macrophages via passive cholesterol depletion and PKC-NF-κB/STAT1-IRF1 signaling. Cell Metab. 2017;25(1):197–207. doi:10.1016/j.cmet.2016.10.013
34. Gudbrandsdottir S, Hasselbalch HC, Nielsen CH. Activated platelets enhance IL-10 secretion and reduce TNF-α secretion by monocytes. J Immunol. 2013;191(8):4059–4067. doi:10.4049/jimmunol.1201103
35. Wijeyekoon RS, Kronenberg-Versteeg D, Scott KM, et al. Monocyte function in Parkinson’s disease and the impact of autologous serum on phagocytosis. Front Neurol. 2018;9:870. doi:10.3389/fneur.2018.00870
36. Thomas MR, Storey RF. The role of platelets in inflammation. Thromb Haemost. 2015;114(3):449–458. doi:10.1160/th14-12-1067
37. Tchebiner JZ, Nutman A, Boursi B, et al. Diagnostic and prognostic value of thrombocytosis in admitted medical patients. Am J Med Sci. 2011;342(5):395–401. doi:10.1097/MAJ.0b013e318214768d
38. Li YL, Wang ZX, Ying CZ, Zhang BR, Pu JL. Decoding the role of familial Parkinson’s disease-related genes in DNA damage and repair. Aging Dis. 2022;13(5):1405–1412. doi:10.14336/ad.2022.0216
39. Zhu M, Chen L, Kong X, et al. The systemic immune-inflammation index is an independent predictor of survival in breast cancer patients. Cancer Manag Res. 2022;14:775–820. doi:10.2147/cmar.S346406
 © 2024 The Author(s). This work is published and licensed by Dove Medical Press Limited. The
full terms of this license are available at https://www.dovepress.com/terms.php
and incorporate the Creative Commons Attribution
- Non Commercial (unported, 3.0) License.
By accessing the work you hereby accept the Terms. Non-commercial uses of the work are permitted
without any further permission from Dove Medical Press Limited, provided the work is properly
attributed. For permission for commercial use of this work, please see paragraphs 4.2 and 5 of our Terms.
© 2024 The Author(s). This work is published and licensed by Dove Medical Press Limited. The
full terms of this license are available at https://www.dovepress.com/terms.php
and incorporate the Creative Commons Attribution
- Non Commercial (unported, 3.0) License.
By accessing the work you hereby accept the Terms. Non-commercial uses of the work are permitted
without any further permission from Dove Medical Press Limited, provided the work is properly
attributed. For permission for commercial use of this work, please see paragraphs 4.2 and 5 of our Terms.
Recommended articles
Clinical Significance and Diagnostic Utility of NLR, LMR, PLR and SII in the Course of COVID-19: A Literature Review

Kosidło JW, Wolszczak-Biedrzycka B, Matowicka-Karna J, Dymicka-Piekarska V, Dorf J
Journal of Inflammation Research 2023, 16:539-562
Published Date: 11 February 2023
Inflammatory Markers in Women with Infertility: A Cross-Sectional Study
Duan Y, Zhou Y, Peng Y, Shi X, Peng C
International Journal of General Medicine 2023, 16:1113-1121
Published Date: 27 March 2023