")
Back to Journals » Journal of Inflammation Research » Volume 17
Development and Verification of Diagnosis Model for Papillary Thyroid Cancer Based on Pyroptosis-Related Genes: A Bioinformatic and in vitro Investigation
Authors Ding L, Zheng G, Zhou A, Song F, Zhu L , Cai Y, Guo Y, Hua T , Liu Y, Ma W, Hu Y, Guo Y , Zheng C
Received 19 May 2024
Accepted for publication 17 October 2024
Published 29 October 2024 Volume 2024:17 Pages 7761—7776
DOI https://doi.org/10.2147/JIR.S478989
Checked for plagiarism Yes
Review by Single anonymous peer review
Peer reviewer comments 2
Editor who approved publication: Professor Ning Quan
Lingling Ding,1,* Guowan Zheng,1– 3,* Aoni Zhou,4 Fahuan Song,1– 3 Lei Zhu,5 Yefeng Cai,6 Yehao Guo,1 Tebo Hua,7 Yunye Liu,1 Wenli Ma,1 Yiqun Hu,1– 3 Yawen Guo,1– 3 Chuanming Zheng1– 3
1Otolaryngology & Head and Neck Center, Cancer Center, Department of Head and Neck Surgery, Zhejiang Provincial People’s Hospital (Affiliated People’s Hospital), Hangzhou Medical College, Hangzhou, Zhejiang, 310000, People’s Republic of China; 2Zhejiang Provincial Clinical Research Center for Malignant Tumor, Hangzhou, Zhejiang, 310000, People’s Republic of China; 3Zhejiang Key Laboratory of Precision Medicine Research on Head & Neck Cancer, Hangzhou, Zhejiang, 310000, People’s Republic of China; 4Hangzhou Normal University, Hangzhou, Zhejiang, 311121, People’s Republic of China; 5Department of Thyroid Surgery, The Fifth Hospital Affiliated to Wenzhou Medical University, Lishui Central Hospital, Lishui, Zhejiang, 323000, People’s Republic of China; 6Department of Thyroid Surgery, The First Affiliated Hospital of Wenzhou Medical University, Wenzhou, Zhejiang, 325000, People’s Republic of China; 7Department of Thyroid Surgery, Ningbo Medical Centre Lihuili Hospital, Ningbo, Zhejiang, 315000, People’s Republic of China
*These authors contributed equally to this work
Correspondence: Yawen Guo; Chuanming Zheng, Department of Head and Neck Surgery, Zhejiang Provincial People’s Hospital (Affiliated People’s Hospital), Hangzhou Medical College, No. 158, Shangtang Road, Hangzhou, Zhejiang, People’s Republic of China, Email [email protected]; [email protected]
Background: The incidence of papillary thyroid cancer (PTC) has been increasing annually; however, early diagnosis can improve patient outcomes. Pyroptosis is a programmed cell death modality that has received considerable attention recently. However, no studies have reported using pyroptosis-related genes in PTC diagnosis.
Methods: Analyzed 33 pyroptosis-related genes in PTC transcriptome data from the Gene Expression Omnibus database. Subsequently, used the Least Absolute Shrinkage and Selection Operator (LASSO) model to construct a PTC molecular diagnostic model. Furthermore, confirmed differences in the expression of five genes between PTC and non-tumor tissues using immunohistochemistry. Collected 338 PTC and control samples to construct a five-gene PTC diagnostic model, which was then validated using a training set and underwent correlation analysis with immune cell infiltration. Additionally, validated the biological functions of the core gene NOD1 in vitro.
Results: The five-gene PTC diagnostic model demonstrated good diagnostic value for PTC. Moreover, identified three reliable subtypes of pyroptosis and found that NOD1 is involved in tumor-suppressive microenvironment formation. Notably, patients with high NOD1 expression had lower Progression-Free Survival (PFS). Additionally, NOD1 expression was positively correlated with immune markers such as CD47, CD68, CD3, and CD8. Lastly, inhibiting NOD1 showed significant anti-PTC activity in vitro.
Conclusion: Our results suggest that pyroptosis-related genes can be used for PTC diagnosis, and NOD1 could be a promising therapeutic target.
Keywords: pyroptosis-related genes, papillary thyroid cancer, PTC, immune cell infiltration, bioinformatic, diagnosis model
Introduction
Recently, thyroid cancer incidence has increased dramatically worldwide, ranking in the top 10 of all cancer types, seventh in the incidence of malignancies in women,1 and fourth in Chinese women.2 In the United States, approximately 43,800 new cases of thyroid cancer are estimated to be diagnosed in 2022.1 Thyroid cancer is classified into four major tissue types: papillary thyroid carcinoma (PTC), follicular thyroid carcinoma (FTC), medullary thyroid carcinoma, and anaplastic thyroid carcinoma. PTC and FTC are called differentiated thyroid cancer (DTC). DTC accounts for more than 95% of all cases.3 Thyroid cancer has a low overall mortality rate. DTC has a good prognosis,4 with a 10-year survival rate of more than 90–95%5 due to increasingly advanced screening methods, improved surgical procedures, and corresponding postoperative management and treatment.6 With the widespread development of fine needle aspiration cytology and the use of the Bethesda reporting system for cytopathology, most thyroid disorders can be diagnosed simply and safely. However, some atypical morphologic changes are difficult to distinguish and require using molecular markers, such as BRAF/RET/RAS genes, to improve preoperative diagnosis accuracy.7 Therefore, establishing a simple, effective early diagnostic model with a high diagnostic yield is a current research priority.
Brennan et al were the first to propose pyroptosis to describe a mode of programmed cell death.8 Pyroptosis mainly depends on the inflammatory cystathionine (caspase) and gasdermin (GSDMs) protein families, meaning that the activated caspase cleaves the GSDMs protein, releasing its N-terminal structural domain, which binds membrane lipids and punches holes in the cell membrane. These changes cellular osmotic pressure and cell membrane pore formation, which distends until the cell membrane ruptures.9 Gasdermin D (GSDMD) and Gasdermin E (GSDME) are two commonly described molecules that can be cleaved by caspases and exert a pyroptosis effect.10 GSDMD is cleaved by inflammatory caspase-1/4/5/11, whereas GSDME is cleaved by apoptotic caspase3, which mediates cell pyroptosis.11,12 Recent studies have discovered that pyroptosis of tumor cells causes CD8+ T-cell infiltration, triggering acute inflammation and changing the tumor microenvironment (TME) to an immune-stimulated state, which has great clinical application potential.13 Tumor treatment with immune checkpoint inhibitors has made great clinical progress; however, only 16% of patients benefit from using related drugs. Moreover, immune checkpoint blockers can act as immune enhancers in tumors with high GSDM family expression.14 In previous studies, we found that significant anti-ATC (Anaplastic carcinoma) cancer activity could be demonstrated both in vitro and in vivo by inducing GSDME-dependent pyroptosis in ATC cancer cells.15,16 Therefore, discovering new targets to induce tumor pyroptosis and combining them with immune checkpoint blockers to enhance antitumor activity is necessary for providing a potential therapeutic strategy for treating high-risk refractory PTC.
Here, the role of pyroptosis-related genes in patients with PTC was evaluated using the Gene Expression Omnibus (GEO) database system. Five pyroptosis-related genes with significant differences were screened, and a molecular diagnostic model was constructed. Based on the split-needle diagnostic model, patients with PTC were classified into different pyroptosis subtype clusters, and the relationships between immune cell differences, immune checkpoint genes, human leukocyte antigen (HLA) genes, immune gene enrichment, pyroptosis subtype clusters, and the molecular functions of pyroptosis subtypes were investigated. An early diagnostic model of pyroptosis-related genes was constructed to predict the early diagnosis of patients with PTC. The expression of the five pyroptosis genes was further validated using PTC cases at our center. NOD1 was identified as the core gene, and NOD1 activity inhibition was found to induce pyroptosis in PTC cells in vitro. Therefore, this study will help clinicians predict the risk of early-onset PTC and provide more accurate treatment options for patients with PTC.
Materials and Methods
Data Collection
The GEO database (https://www.ncbi.nlm.nih.gov/geo/) was used to download RNA microarray data from the GSE6004, GSE76039, GSE35570, GSE53157, GSE60542, GSE29265, and GSE33630 datasets, which included 338 (PTC = 195, normal = 143) samples. Furthermore, 32 cases (PTC = 16) from two collections, GSE3467 and GSE3678, were downloaded as the validation dataset for this study using the same method, with the seven gene collections mentioned above as backup after the same operation. The expression data quality control phase was log2 (count+1) normalized using the count value of the gene expression matrix.17 In addition, the predefined genome included in this study was based on a literature search that yielded 33 pyroptosis-related genes for subsequent investigation.
Analysis and Diagnostic Modelling of Cellular Pyroptosis Molecules in PTC
We explored the biological processes associated with significantly different pyroptosis-related genes (p-value < 0.01). The study used 338 cases of samples divided into PTC (195 cases) and normal (143 cases) using the R language limma to identify differential genes between the two groups and determined adjusted p < 0.05. Gene ID conversion was performed for the gene list using the R language clusterProfiler package18 using Gene Ontology (GO) (Biological Process [BP], Molecular Function [MF], Cellular Component [CC]) and Kyoto Encyclopedia of Genes and Genomes (KEGG) database sources. Pathway setting thresholds were used to identify significantly different enrichment entries (adjusted p-value < 0.05, enrichment factor > 1.5), and the top five significantly different pathways were presented.
Based on the above significantly different sets of pyroptosis-related genes (P < 0.05), the Least Absolute Shrinkage and Selection Operator (LASSO) model was used to construct a PTC molecular diagnostic model. The eigenvalues of the molecular diagnostic model were calculated using the following equation:

The Mann–Whitney U-test was then used to map the model gene expression heatmap using the R language heatmap package for the high-risk and low-risk groups. Subsequently, the predicted values  and actual population classification (PTC vs normal) were used to calculate the area-under-The-curve value (AUC) of the model for PTC prediction using the R language pROC (v1.18.0). Finally, 32 samples (PTC = 16) from the two validation datasets were used to verify the survival analysis of this model.
Diagnostic Models and Immune Infiltration Studies
The infiltration fraction of 22 immune cell species was determined using CIBERSORT (R 4.0.2) to explore the relationship between the grouping of diagnostic models (Risk score) and TME.19 The “LM22 Leukocyte Gene Matrix Collection” was used to analyze multiple immune cell types in all samples using the deconvolution method.20 LM22 consists of 547 genes, covering 22 immune cell types, including different subtypes of B-cell, T-cell, natural killer cells, plasma cells, and myeloid cell types. After calculating the proportions of immune infiltrating cells, the Mann–Whitney U-test was used to compare the results of the immune infiltration scores of the high and low groups (P < 0.05).
Pyroptosis Molecular Subtyping and Immune Cell Differences
Based on the molecular diagnostic model genes, the non-negative matrix factorization (NMF) software package was used for unsupervised clustering of PTC patients to delineate the heat protein isoform clusters. We further elucidated the significant differences in important immune checkpoints and HLA family genes in these pyroptosis subtypes. After establishing the heat protein variant isoform clusters, 33 pyroptosis-related genes from the above research papers were investigated to explore the differences in isoform cluster scores in the cellular heat protein variant pathway. Genomic variation analysis (GSVA) algorithm was used to calculate enrichment scores for the pyroptosis death pathway. The relationship between pyroptosis molecular isoforms and PTC microenvironment was observed based on Stromal Score, Immune Score, ESTIMATE Score, and Tumor Purity.20 The differences between TME scores of the molecular subtypes were compared using the analysis of variance (ANOVA) test (P < 0.05).
Cell Culture
TPC-1, IHH-4, and BCPAP cells were purchased from Procell (Wuhan, China), Cobioer (Nanjing, China), and the Shanghai Cell Bank of the Chinese Academy of Sciences, respectively. Cells were cultured in RPMI1640 (Hyclone) supplemented with 10% Q penicillin and streptomycin and 10% fetal bovine serum at 37°C in a 5% CO2 incubator.
Reverse Transcription-Polymerase Chain Reaction (RT-PCR)
Frozen specimens from 90 patients operated on during 2019–2021 were collected at Zhejiang Provincial People’s Hospital. This study was approved by the Ethical Committee of Zhejiang Provincial People’s Hospital (Approval No. QT2022394). The study was conducted in accordance with the principles of the Declaration of Helsinki. All patients, their parents, or legal guardians signed informed consent forms. Total RNA was extracted from tissue samples using RNAiso Plus (Takara, Japan) and reverse transcribed using the PrimeScript RT Master Mix (Takara, Japan). Gene expression was verified using qPCR analysis and the Hieff® qPCR SYBR Green Master Mix (Yeasen Biotechnology, China), and ACTB levels were used as internal controls. Changes in gene expression were calculated using the 2-ΔΔCt method. Table 1 presents the primer sequences.
 |
Table 1 qRT-PCR Primer Sequences |
Western Blotting
The NOD1 inhibitor Nodinitib-1 (ML130, Topscience) was dosed for 24 h and the cells were lysed in protein lysis buffer (Cell lysis buffer for Western and IP) (Beyotime, China) containing the protease inhibitor PMSF. Equal amounts of protein were separated using SDS-PAGE and transferred to a PVDF. The signals were visualized using the ECL kit (Fude Biological, China). Antibodies used included Caspase3 (ab32351, Abcam, USA), c-Caspase3 (ET1602-47, HUABIO, China), PARP (9532, CST, USA), GSDME (ab215191, Abcam, USA), GAPDH (60004-1-Ig; Proteintech Group, USA), and NOD1 (ab215726, Abcam, USA).
Cck8
The CCK8 kit is used to analyze cell viability. TPC1 and BCPAP cells were seeded in 96-well plates at a density of 5000 cells/well. ML130 (0–150 μM) was added after 24 h, and CCK8 was added 24 h later to assay the cell viability. The optical density of each well was measured at 450 nm, and each experiment was repeated thrice.
Cloning Formation
We inoculated 2×10³ TPC-1 and BCPAP in 6-well plates, added different concentrations of ML130, incubated the cells in an incubator, and allowed the cells to multiply to the appropriate concentration. Subsequently, the plates were fixed with formaldehyde for 15 min, stained with crystalline violet, rinsed gently with PBS thrice, air dried, and photographed.
Wound Healing
The cell migration ability was evaluated using a wound-healing assay. We inoculated 3×10⁴ TPC-1 and BCPAP in 12-well plates with Culture-Insert (ibidi, Germany), and the Culture-Insert was removed after 24 h. Subsequently, ML130 was added at different concentrations to continue culturing in the incubator. At specific times, the wound area was counted using ImageJ software. Each experiment was repeated three.
Flow Cytometry
Cells in 6-well plates were digested with trypsin, and cell precipitates were collected and stained for 10 min by resuspension with 500 µL of binding buffer containing Annexin V-FITC and propidium iodide from the Apoptosis Detection Kit (MULTISCIENCES, China). The apoptosis rate was detected using flow cytometry. The data were analyzed using FlowJo software (TreeStar Inc., Ashland, OR, USA).
Immunohistochemical Staining
In brief, 4 μm thick sections were sliced from paraffin-embedded tissue blocks, then subjected to deparaffinization and rehydration before being treated with citrate buffer (pH 6.0) for antigen retrieval. Following a 30-minute incubation with 3% BSA, the samples were incubated with the specified primary antibody at 25°C for 1 hour, followed by incubation with the appropriate HRP-labeled secondary antibody at room temperature for 30 minutes. Nuclei were stained with hematoxylin (blue), and positive 3,3’-diaminobenzidine expression was visualized by a brownish-yellow color. Images were captured using a fluorescence microscope (Konfoong Biotech, Ningbo, China).
Statistical Analysis
Statistical analyses were conducted using GraphPad Prism software version 8. Differences between groups were assessed using one-way or two-way ANOVA, or t-tests as appropriate. Data are presented as mean ± SD for n = 3, with a P-value < 0.05 considered statistically significant.
Results
Bioinformatic Analysis
Data Acquisition and Screening
An overview of the general design scheme of our study is shown (Supplement Figure 1). Quantity control of the pooled GEO data was performed using previously described methods. Gene expression matrices from 338 samples (PTC = 195, normal = 143) were included in the final analysis as the test set, and 21,656 genes were included after combining the probes. The two validation datasets included a total of 32 samples, with 16 of them being PTC samples. Table 2. Show the clinicopathological characteristics of GEO database patients.
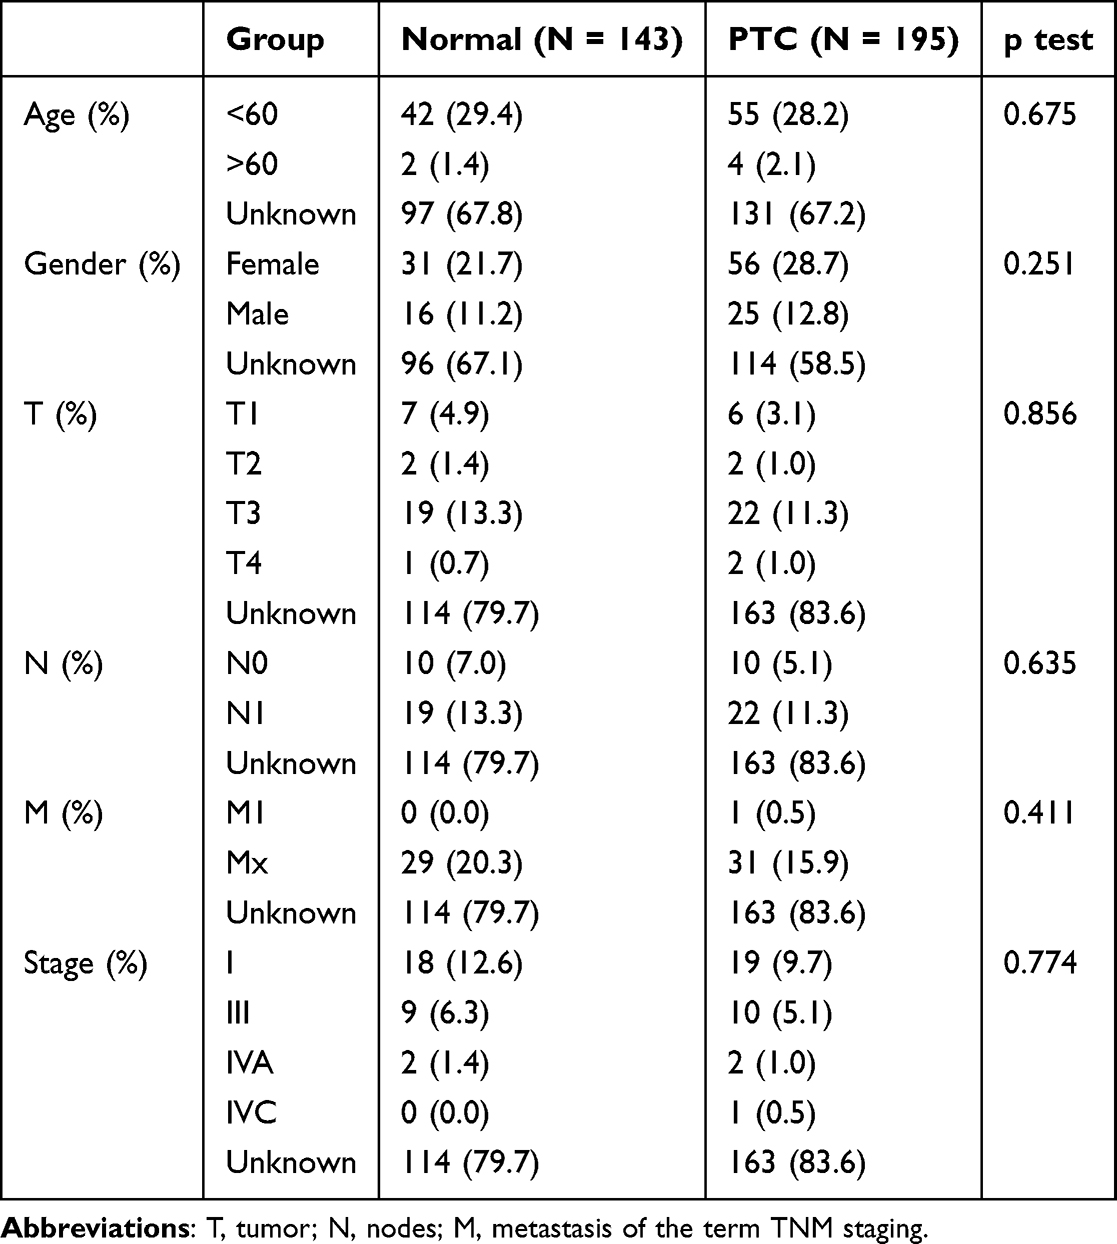 |
Table 2 Clinicopathological Characteristics of GEO Database Patients |
Differential Analysis of Cell Pyroptosis-Related Genes Between PTC and Healthy Controls
This study used 21,656 gene expression matrices from 338 patients; 33 cell pyroptosis-related genes21 were evaluated using PTC and normal samples to compare the differences between the two groups. Screening for differential genes (adj. p. val < 0.05) between the two groups was performed using the package limma 3.9.19 using the R language,17 resulting in 16 differential genes and subsequent analyses. Additionally, 16 significantly different genes (adjusted p-value < 0.05, Figure 1A and B) were identified using the t-test. We also performed a correlation analysis among the 16 significantly different genes, and the results suggested more significant correlations among genes (P < 0.05, Figure 1D).
 |
Figure 1 Correlation studies between patients with papillary thyroid carcinoma (PTC) and cellular pyroptosis gene expression: (A). Plot of significantly different volcanoes between PTC and normal populations. (B). Box plot of significantly different expression between PTC and normal populations. (C). Protein–protein interaction (PPI) network of 16 genes (Score >0.4). (D). Correlation analysis between significantly different 16 pyroptosis genes with 0 correlation pairs that are not significantly different in the figure; Coeffs are represented as percentages (Coeff% = Coeff*100). (E). Gene Ontology (GO) and Kyoto Encyclopedia of Genes and Genomes (KEGG) enrichment results of 16 pyroptosis genes (Top 5). **p < 0.01, ***p < 0.001. |
Based on the 16 genes with significant differences, KEGG and GO (BP, CC, and MF) pathway enrichment analyses were performed. The analysis results suggested more significant enrichment pathways, with the main enrichment pathways including pertussis, pathogenic Escherichia coli infection, Salmonella infection, NOD-like receptor signaling pathway, legionellosis, and others (Figure 1E). We also performed a protein–protein interaction network study of 16 pyroptosis-related genes to explore the gene co-expression network, and the analysis revealed significant associations between genes (Figure 1C), mainly in genes within the CASP community, such as CASP8, CASP6, CASP3, and CASP1.
Molecular Diagnostic Model of Cellular Pyroptosis in PTC
The study constructed a model for molecular diagnostic prediction based on the 16 pyroptosis-related genes with significant differences in PTC using the LASSO regression algorithm (Figure 2A) to explore the molecular diagnostic ability of the transcriptome of significantly different pyroptosis-related PTC genes. The model screened five pyroptosis-related genes to constitute the model (Figure 2C).
 |
Figure 2 Molecular diagnostic model construction for cell pyroptosis: (A). Least Absolute Shrinkage and Selection Operator (LASSO) feature screening. (B). Correlation analysis between 16 pyroptosis genes with significant differences, correlation pairs with 0 in the figure did not differ significantly; Coeff are treated as percentages (Coeff%. = Coeff*100). (C). Model coefficients for the five molecular diagnostic targets constructed using LASSO. (D). GO and KEGG enrichment results for 16 pyroptosis genes (Top 5). (E). PPI network for 16 genes (Score > 0.4). |

Subsequently, using the expression data from the five genes, the eigenvalues  were calculated for each sample using the equation above. The population was divided into high-risk (N = 169) and low-risk (N = 169) groups using the median eigenvalues. We observed a more significant difference in expression in the high-risk group than that in the low-risk group (Figure 2B). We also discovered that this predictive ability of this model for PTC could reach 0.96 using the ROC curve (Figure 2D, Supplement Figure 2A), in which the predictive AUC of single genes was above 0.6 (Figure 2D, Supplement Figure 2A).
This study used 32 validation pooled samples to evaluate the accuracy of this molecular diagnostic model using the expression values of five genes from this model, fitted with a linear model to obtain the characteristic equations here, LASSO model characteristic coefficients were used and grouped as high and low, the AUC was calculated; the AUC of the realistic validation pool could reach up to 0.792 (Figure 2E, Supplement Figure 2B), probably due to sample imbalance; hence, the AUC was measured using a refit). The CASP6 gene had the highest AUC for single genes, which could reach 0.75 (Figure 2E, Supplement Figure 2B).
Diagnostic Models and Immune Infiltration Studies
We evaluated the relationship between the grouping of diagnostic models (Risk Score) and the TME. Further, we explored the significant infiltration of 22 immune cells based on the expression matrix of all genes of the 365 samples, which showed that neutrophils were underrepresented in the tumor samples (Figure 3A). Subsequently, the immune cell expression activity was analyzed differentially between PTC and healthy populations, and the results suggested significant differences (P < 0.05) between the two groups in 13 immune cells (Supplement Figure 2C). Spearman correlation studies using the diagnostic model of five gene expression with 13 significantly differential immune cells suggested 42 significantly correlated pairs (P < 0.05, Figure 3B), with the NOD1 gene showing the highest correlation with resting dendritic cells (Coeff = 0.44, p < 2.2e −16, Figure 3B).
 |
Figure 3 Diagnostic model with immune infiltration study: (A). Distribution of 22 cellular infiltrates. (B). Significantly different immune infiltrating cells in PTC vs healthy group. (C). Heat map distribution of the three modules. (D). Box plot of significant differences in cellular autophagic pathways among the three subtypes. (E). ESTIMATE and CIBERS ORT analysis of differences among the three subtypes. (F). Distribution of 17 immune pathways among the three subtypes.*p < 0.05, **p < 0.01, ***p < 0.001. |
Analysis of Pyroptosis Molecular Subtype and Immune Cell Differences
In order to explore the role of the five cellular focal death modelling genes in the classification of patients with PTC, we first determined the best classification criteria by rank and used three methods, including cophenetic, dispersion and silhouette, to select three categories of classification situations as our classification (Supplement Figure 2D). Among them, 1 contained 96 samples, 2 contained 28 samples, and 3 contained 71 samples (Figure 3C). Furthermore, this study explored the pathway scores in which 33 pyroptosis-related genes were located using GSVA to explore the differences in the activity of the three isoforms in the cellular pyroptosis death pathway. Subsequently, a multi-group chi-square analysis was performed to examine the differences between the three groups to explore the differences in clinical characteristics among the three subtypes, and the results demonstrated that the age between the three groups was significantly different (P < 0.05, Figure 3D).
The degree of immune infiltration was evaluated using two immune infiltration methods, followed by ANOVA to test for differences among the three subtypes, and the results suggested nine significantly different cells (P < 0.05, Figure 3E). The following immune checkpoint gene expression matrices of PTC samples were extracted to explore the differences in the expression profiles of molecular diagnostic subtypes in immune checkpoints and HLA gene families (Supplement Figure 2E). ANOVA test results suggested significant differences among the three groups for eight immune checkpoints, including CD47, PDCD1, CTLA4, VTCN1, TIGIT, TNFRSF9, BTLA, and ICOS (Supplement Figure 2F).
GSVA scores were calculated for each PTC sample based on 17 immune categories to investigate the association between immunity and molecular diagnostic subtypes in depth. Additionally, variance between the three groups was analyzed using ANOVA, which revealed five significantly different immune pathways, including interleukins, interleukin receptors, interferon receptors, cytokines, and interferons (Figure 3F).
Molecular Functions of Pyroptosis Subtypes
Finally, this study conducted a two-by-two difference analysis of 21,656 gene expression matrices from 195 PTC samples based on three subgroups using the entire genome to explore the molecular functions of the three subtypes. The results suggested that 32 significantly different genes were shared among the three subclades (Figure 4A). Furthermore, the results suggested more significantly different loci, but the same difference was not observed in the three combined differences (Figure 4B–D).
 |
Figure 4 The molecular function of pyroptosis subtypes in cells. (A). Venn analysis between two differential genes. (B–D). Volcano map of the difference between the two genes. (E). Significantly different GO and KEGG enrichment studies. |
First, the study results identified 866 genes with significant differences (P < 0.05) between groups 1 and 2, including DCSTAMP, SLC27A6, and CLDN10. Second, the study’s results suggested that there were 3828 significantly different genes between groups 1 and 3 (P < 0.05), including PDZRN4, PRR15, and NELL2. Finally, the study’s results suggested 2169 significantly different genes between groups 2 and 3 (P < 0.05), including BCHE, TUNAR, and FAM155B. GO enrichment analysis was performed for the 32 genes intersected by the above differential genes. The results suggested significantly different pathways (P < 0.05), including nicotine addiction, circadian rhythm, collecting duct acid secretion, and steroid biosynthesis (Figure 4E).
Organisational Validation
Gene Expression in PTC Cases at Our Center
We collected specimens from 90 patients at our center and analyzed the expression levels of five genes, including NOD1, PRKACA, GSDMB, CASP6, and CASP9, using qRT-PCR. The results showed that the mRNA expression of NOD1, PRKACA, GSDMB, and CASP6 was significantly elevated in PTC tissues (P < 0.05). The expression of CASP9 decreased in PTC samples (P < 0.05) (Figure 5A). Moreover, we found that high NOD1 expression was associated with tumor size and lymph node metastasis with statistically significant differences (Table 3, P < 0.05). Further, the survival prognosis of patients with PTC analyzed by Kaplan–Meier analysis showed that patients with PTC with high NOD1 expression had worse progression-free-survival (PSF, Figure 5F, P < 0.05) than those with low NOD1 expression. Therefore, the tissue specimens were classified based on NOD1 expression and immunohistochemical and immunofluorescence staining was performed for CD68, CD47, CD3, CD8, PD-1, and NOD1 (Figure 5B–E and 5G), the results of immunohistochemical staining were also quantitatively analysed (Supplement Figure 3A–D). As a result, it was found that the expression of the after mentioned immune-related markers increased in tissue samples.
 |
Table 3 A Total of 90 PTC Cases at Our Center: Correlation Between the NOD1 Expression and Clinicopathological Features |
 |
Figure 5 Validation of clinical specimens at our center. (A). Gene expression in our center: reverse transcription-polymerase chain reaction (RT-PCR) to detect the expression of NOD1, PRKACA, GSDMB, CASP6, and CASP9 genes in our samples (n = 87). (B and C). Immunofluorescence staining for CD68 and CD47 in the clinical tissue specimens. (D and E). Immunohistochemical staining for CD3 and CD8 in the clinical tissue specimens. (F). The PSF of high NOD1 expression and low NOD1 expression. (G). Immunofluorescence staining for PD-1 and NOD-1 in the clinical tissue specimens. *p < 0.05, **p < 0.01, ***p < 0.001. |
In vitro Validation
NOD1 Inhibitor Inhibits the Proliferation and Migration of PTC Cells
NOD1 was used as the core gene of this diagnostic model, and we selected ML130, an inhibitor of NOD1, to verify the role of NOD1 in PTC tumor progression. First, we showed the background expression in three PTC cell lines, including IHH4, BCPAP, and TPC1, and observed the highest expression in TPC1 and the lowest expression in BCPAP (Figure 6A and B). Hence, we selected these two cells for subsequent experiments. CCK8 demonstrated that ML130 significantly inhibited TPC-1 and BCPAP cell proliferation, clone formation, and migration (Figure 6C–E, Supplement Figure 3E and F). This was supported by flow cytometry results from the annexin V-FITC/PI assay, which demonstrated that ML130 significantly induced cell death in a dose-dependent manner, with a noticeable increase in the proportion of both annexin V-positive and PI-positive cells (Figure 6F and Supplement Figure 3G). In addition, ML130 induced apoptosis and pyroptosis in TPC-1 and BCPAP cells by activating caspase3 cleavage of PARP and GSDME (Figure 6G). The results showed that inhibiting NOD1 activity significantly inhibited PTC cell activity.
 |
Figure 6 NOD1 inhibitor ML130 showed significant in vitro anti-PTC activity. (A and B). q-PCR and Western blot results of high expression of TPC1 in PTC cells. (C). Effect of ML130 application on TPC-1 and BCPAP cell viability using CCK8 assay. (D). TPC-1 and BCPAP clone formation and scratch assay to detect the effect of ML130 on cell proliferation and migration ability. (E). The effect of ML130 on cell proliferation and migration ability. (F). Flow assay to detect the effect of ML130 on TPC-1 and BCPAP death. (G). Western blot results demonstrated that TPC-1 and BCPAP showed apoptosis and pyroptosis after ML130 application. Data are shown as mean ± SD for n = 3. *p < 0.05, ***p < 0.001. |
Discussion
Recent research has highlighted the potential of leveraging pyroptosis as a mechanism for antitumor immunity. Many researchers are exploring strategies to integrate pyroptosis with other cancer treatments, aiming to regulate this process to inhibit the proliferation, migration, and invasion of tumor cells.22 We screened 16 pyroptosis death-related genes that were significantly different in PTC and selected five genes ((NOD1, PRKACA, GSDMB, CASP6, and CASP9) according to their diagnostic ability for PTC to construct a molecular diagnostic prediction model. The training and validation sets had good diagnostic effects for PTC. In addition, we delineated three reliable subgroups of pyroptosis subtypes using unsupervised clustering, which did not show similar differential loci. Since tumors are the result of the accumulation of genetic mutations, and there are differences in the mutation profiles of tumor genes in different patients, even if the same drug is effective in different patients, different patients may show different efficacy and toxicity.23 Our study revealed the molecular features of PTC by analysing the genes related to pyroptosis and constructed an effective PTC diagnostic model by using the genes related to pyroptosis protein deposition, which provides a basis for the diagnosis and treatment of PTC, thus providing a basis for individualized treatment plans for patients.
In addition, among the five genes included in the diagnostic model, PRKACA, one of the catalytic subunits encoding protein kinase A, has been studied in breast cancer and discovered to mediate resistance to HER2-targeted therapy through high PRKACA expression,24 suggesting that PRKACA may act as a biomarker for cancer. GSDMB is a member of the Gasdermin family of proteins involved in regulating pyroptosis,25 and its upregulation in clear cell renal carcinoma is associated with immune infiltration and poor prognosis.26 CASP6 and CASP9 belong to the caspase family, which are structurally related cysteine proteases found in cytoplasmic lysates. They both contain cysteine in the active site and specifically break the peptide bond after the aspartate residue. CASP9 is involved in apoptosis initiation, while CASP6 is involved in apoptosis execution. CASP6 may be a sensitive prognostic marker for patients with glioma and may predict their response to immunotherapy and temozolomide treatment.27 In this study, high expression of PRKACA, GSDMB, and CASP6 and low expression of CASP9 were observed in the GEO and our center’s databases, which are consistent with this diagnostic model, suggesting their important role in PTC progression.
The NOD1 receptor, a member of the NLRs family, is expressed in various tissue cells and localized in the cytoplasm and cell membrane. NOD1 has been involved in signaling after bacterial invasion of cells as part of the innate immune response. NOD1 is closely associated with inflammation and involved in various tumor development. However, NOD1 performs different roles in different tumor cells. NOD1 inhibits tumor development in oral cancer28,29 and promotes tumor progression in head and neck squamous cell carcinoma, liver, and prostate cancer.30–32 However, NOD1 exhibited completely opposite effects in colorectal and cervical cancers.33–36In this study, high NOD1 expression was discovered in GEO and our center’s databases. As studied by Shunsuke Kanno et al, increased expression of NOD1 leads to increased accumulation of macrophages and T cells.33–36We revealed that ML130 significantly inhibited PTC cell activity and induced caspase 3-dependent PARP and GSDME cleavage via apoptosis and pyroptosis using a potent selective NOD1 inhibitor (ML130, Nodinitib-1). Thus, NOD1 may be involved in regulating PTC pyroptosis and a potential indicator for PTC diagnosis.
Pyroptosis is a double-edged sword for cancer because it can promote and inhibit tumorigenesis. The pro-cancer effect of pyroptosis has been extensively studied;37 however, the relationship between pyroptosis and anticancer immunity is not fully understood.38,39 Our diagnostic model, which is based on five pyroptosis-related genes, revealed a correlation between PTC and immune cell infiltration and discovered that neutrophils were underrepresented in tumor samples. Further analysis revealed that NOD1 had the highest positive correlation with resting dendritic cells. Previous studies discovered that resting dendritic cells can induce immune tolerance,40 and NOD1 overexpression is associated with tumor development and enhanced immunosuppression in head and neck squamous cell carcinoma (HNSCC),30 esophageal squamous cell carcinoma,41 prostate cancer,32 and ovarian cancer.42 Our study discovered that the expression of resting dendritic cells increased when NOD1 was highly expressed, and inhibiting NOD1 induced pyroptosis in PTC cells in vitro, suggesting that NOD1 may be involved in forming PTC immunosuppressive microenvironment. Therefore, NOD1 could be a novel target for PTC immunotherapy.
However, our study had some limitations. First, the data used were from retrospective not prospective studies in the GEO database. Clinical institutions have not validated the model developed in this study for the early diagnosis of pyroptosis gene-associated PTC. Finally, survival information for PTC was unavailable in the geo cohort used; therefore, no prognostic-related validation was performed. Pyroptosis-related core genes must be validated in vivo and in vitro, and their mechanisms must be explored because there are only a few reports related to pyroptosis in thyroid cancer species.
Conclusions
We conducted a comprehensive bioinformatic study of pyroptosis death-related genes in PTC using the GEO database. We developed an early diagnostic model of five pyroptosis-related genes (NOD1, PRKACA, GSDMB, CASP6, and CASP9) using machine learning to predict the occurrence of early PTC, which was validated using a validation set with good predictive power. Subsequently, we divided these into three pyroptosis subtype clusters using unsupervised clustering and performed an in-depth analysis of differential genes and pyroptosis subtypes with immune cell infiltration, immune checkpoint, and HLA family genes to demonstrate the high practical value of our diagnostic model. Finally, the expression of five genes was validated at our center, and the role of the core gene NOD1 in the malignant phenotype of PTC and PFS was verified in an in vitro experiment. In addition, our study revealed the significant potential of pyroptosis-related genes, which provides new ideas and a theoretical basis for basic research, clinical diagnosis, and individualized PTC treatment.
Data Sharing Statement
The data used to support the findings of this study are available from the corresponding author upon request.
Funding
This work was supported by grants from the National Natural Science Foundation of China (82372618, 81802674, 82103199, 82403142); Key Research and Development Program of Zhejiang Province (2024C03166);Natural Science Foundation of Zhejiang Province (LY21H160049, LY23H160024); Medical Health Science and Technology Project of Zhejiang Provincial Health Commission (2021KY482,2020KY008, 2023RC001,2024KY034); Traditional Chinese Medicine Science and Technology Project of Zhejiang Provincial Health Commission (2023ZL240); and Zhejiang Province Postdoctoral Research Excellence Funding Project (ZJ2021167).
Disclosure
The authors report no conflicts of interest in this work.
References
1. Siegel RL, Miller KD, Fuchs HE, et al. Cancer statistics, 2022. CA Cancer J Clin. 2022;72(1):7–33. doi:10.3322/caac.21708
2. Zheng R, Zhang S, Zeng H, et al. Cancer incidence and mortality in China, 2016. J Natl CancerCent. 2022;2(1):1–9. doi:10.1016/j.jncc.2022.02.002
3. Haddad RI, Bischoff L, Ball D, et al. Thyroid carcinoma, version 2.2022, NCCN clinical practice guidelines in oncology. J Natl Compr Canc Netw. 2022;20(8):925–951. doi:10.6004/jnccn.2022.0040
4. Jonklaas J, Nogueras-Gonzalez G, Munsell M, et al. The impact of age and gender on papillary thyroid cancer survival. J Clin Endocrinol Metab. 2012;97(6):E878–887. doi:10.1210/jc.2011-2864
5. Amin M, Edge S, Greene F. AJCC Cancer Staging Manual. Springer International Publishing; 2017.
6. Rusinek D, Chmielik E, Krajewska J, et al. Current advances in thyroid cancer management. Are we ready for the epidemic rise of diagnoses? Int J Mol Sci. 2017;19(1):18. doi:10.3390/ijms19010018
7. Wang TS, Sosa JA. Thyroid surgery for differentiated thyroid cancer - recent advances and future directions. Nat Rev Endocrinol. 2018;14(11):670–683. doi:10.1038/s41574-018-0080-7
8. Xu W, Che Y, Zhang Q, et al. Apaf-1 pyroptosome senses mitochondrial permeability transition. Cell Metab. 2021;33(2):424–436e410. doi:10.1016/j.cmet.2020.11.018
9. Atabaki R, Khaleghzadeh-Ahangar H, Esmaeili N, et al. Role of pyroptosis, a pro-inflammatory programmed cell death, in epilepsy. Cell Mol Neurobiol. 2022;43(3):1049–1059. doi:10.1007/s10571-022-01250-3
10. Wang Y, Gao W, Shi X, et al. Chemotherapy drugs induce pyroptosis through caspase-3 cleavage of a gasdermin. Nature. 2017;547(7661):99–103. doi:10.1038/nature22393
11. Rogers C, Fernandes-Alnemri T, Mayes L, et al. Cleavage of DFNA5 by caspase-3 during apoptosis mediates progression to secondary necrotic/pyroptotic cell death. Nat Commun. 2017;8(1):14128. doi:10.1038/ncomms14128
12. Liu X, Xia S, Zhang Z, et al. Channelling inflammation: gasdermins in physiology and disease. Nat Rev Drug Discov. 2021;20(5):384–405. doi:10.1038/s41573-021-00154-z
13. Zhivaki D, Kagan JC. NLRP3 inflammasomes that induce antitumor immunity. Trends Immunol. 2021;42(7):575–589. doi:10.1016/j.it.2021.05.001
14. Nejman D, Livyatan I, Fuks G, et al. The human tumor microbiome is composed of tumor type-specific intracellular bacteria. Science. 2020;368(6494):973–980. doi:10.1126/science.aay9189
15. Liu Y, Guo Y, Zeng Q, et al. Prosapogenin A induces GSDME-dependent pyroptosis of anaplastic thyroid cancer through vacuolar ATPase activation-mediated lysosomal over-acidification. Cell Death Dis. 2024;15(8):586. doi:10.1038/s41419-024-06985-z
16. Guo YW, Zhu L, Duan YT, et al. Ruxolitinib induces apoptosis and pyroptosis of anaplastic thyroid cancer via the transcriptional inhibition of DRP1-mediated mitochondrial fission. Cell Death Dis. 2024;15(2):125. doi:10.1038/s41419-024-06511-1
17. Ritchie ME, Phipson B, Wu D, et al. limma powers differential expression analyses for RNA-sequencing and microarray studies. Nucleic Acids Res. 2015;43(7):e47. doi:10.1093/nar/gkv007
18. Wu T, Hu E, Xu S, et al. clusterProfiler 4.0: a universal enrichment tool for interpreting omics data. Innovation. 2021;2(3):100141. doi:10.1016/j.xinn.2021.100141
19. Chen B, Khodadoust MS, Liu CL, et al. Profiling tumor infiltrating immune cells with CIBERSORT. Methods Mol Biol. 2018;1711:243–259.
20. Zhang M, Ma L, Yu P. Dual-band Fourier domain optical coherence tomography with depth-related compensations. Biomed Opt Express. 2013;5(1):167–182. doi:10.1364/BOE.5.000167
21. Lin W, Chen Y, Wu B, et al. Identification of the pyroptosis‑related prognostic gene signature and the associated regulation axis in lung adenocarcinoma. Cell Death Discov. 2021;7(1):161. doi:10.1038/s41420-021-00557-2
22. Wei X, Xie F, Zhou X, et al. Role of pyroptosis in inflammation and cancer. Cell Mol Immunol. 2022;19:971–992.
23. McGranahan N, Swanton C. Clonal heterogeneity and tumor evolution: past, present, and the future. Cell. 2017;168(4):613–628. doi:10.1016/j.cell.2017.01.018
24. Moody SE, Schinzel AC, Singh S, et al. PRKACA mediates resistance to HER2-targeted therapy in breast cancer cells and restores anti-apoptotic signaling. Oncogene. 2015;34(16):2061–2071. doi:10.1038/onc.2014.153
25. Zhou Z, He H, Wang K, et al. Granzyme A from cytotoxic lymphocytes cleaves GSDMB to trigger pyroptosis in target cells. Science. 2020;368.
26. Cui Y, Zhou Z, Chai Y, et al. Upregulated GSDMB in clear cell renal cell carcinoma is associated with immune infiltrates and poor prognosis. J Immunol Res. 2021;2021:7753553. doi:10.1155/2021/7753553
27. Guo K, Zhao J, Jin Q, et al. CASP6 predicts poor prognosis in glioma and correlates with tumor immune microenvironment. Front Oncol. 2022;12:818283. doi:10.3389/fonc.2022.818283
28. Yang L, Tang Z, Zhang H, et al. PSMA7 directly interacts with NOD1 and regulates its function. Cell Physiol Biochem. 2013;31(6):952–959. doi:10.1159/000350113
29. Bai N, Liu C, Zhang X, et al. NOD1 activation promotes cell apoptosis in papillary thyroid cancer. Pathol Res Pract. 2022;233:153880. doi:10.1016/j.prp.2022.153880
30. Chan LP, Wang LF, Chiang FY, et al. IL-8 promotes HNSCC progression on CXCR1/2-meidated NOD1/RIP2 signaling pathway. Oncotarget. 2016;7(38):61820–61831. doi:10.18632/oncotarget.11445
31. Ma X, Qiu Y, Zhu L, et al. NOD1 inhibits proliferation and enhances response to chemotherapy via suppressing SRC-MAPK pathway in hepatocellular carcinoma. J Mol Med. 2020;98(2):221–232. doi:10.1007/s00109-019-01868-9
32. Groeger S, Wu F, Wagenlehner F, et al. PD-L1 up-regulation in prostate cancer cells by porphyromonas gingivalis. Front Cell Infect Microbiol. 2022;12:935806. doi:10.3389/fcimb.2022.935806
33. Jiang HY, Najmeh S, Martel G, et al. Activation of the pattern recognition receptor NOD1 augments colon cancer metastasis. Protein Cell. 2020;11(3):187–201. doi:10.1007/s13238-019-00687-5
34. Chen GY, Shaw MH, Redondo G, et al. The innate immune receptor Nod1 protects the intestine from inflammation-induced tumorigenesis. Cancer Res. 2008;68(24):10060–10067. doi:10.1158/0008-5472.CAN-08-2061
35. Liu X, Ma H, Fei L, et al. HPV-mediated down-regulation of NOD1 inhibits apoptosis in cervical cancer. Infect Agent Cancer. 2020;15(1):6. doi:10.1186/s13027-020-0272-3
36. Zhang Y, Li N, Yuan G, et al. Upregulation of NOD1 and NOD2 contribute to cancer progression through the positive regulation of tumorigenicity and metastasis in human squamous cervical cancer. BMC Med. 2022;20(1):55. doi:10.1186/s12916-022-02248-w
37. Xia X, Wang X, Cheng Z, et al. The role of pyroptosis in cancer: pro-cancer or pro-“host”? Cell Death Dis. 2019;10(9):650. doi:10.1038/s41419-019-1883-8
38. Xiao Y, Zhang T, Ma X, et al. Microenvironment-responsive prodrug-induced pyroptosis boosts cancer immunotherapy. Adv Sci. 2021;8(24):e2101840. doi:10.1002/advs.202101840
39. Yu P, Zhang X, Liu N, et al. Pyroptosis: mechanisms and diseases. Signal Transduct Target Ther. 2021;6(1):128. doi:10.1038/s41392-021-00507-5
40. Probst HC, McCoy K, Okazaki T, et al. Resting dendritic cells induce peripheral CD8+ T cell tolerance through PD-1 and CTLA-4. Nat Immunol. 2005;6(3):280–286. doi:10.1038/ni1165
41. Nomoto D, Baba Y, Liu Y, et al. Fusobacterium nucleatum promotes esophageal squamous cell carcinoma progression via the NOD1/RIPK2/NF-kappaB pathway. Cancer Lett. 2022;530:59–67. doi:10.1016/j.canlet.2022.01.014
42. Shen Y, Lin H, Chen K, et al. High expression of RIPK2 is associated with taxol resistance in serous ovarian cancer. J Ovarian Res. 2022;15(1):48. doi:10.1186/s13048-022-00986-2
 © 2024 The Author(s). This work is published and licensed by Dove Medical Press Limited. The
full terms of this license are available at https://www.dovepress.com/terms.php
and incorporate the Creative Commons Attribution
- Non Commercial (unported, 3.0) License.
By accessing the work you hereby accept the Terms. Non-commercial uses of the work are permitted
without any further permission from Dove Medical Press Limited, provided the work is properly
attributed. For permission for commercial use of this work, please see paragraphs 4.2 and 5 of our Terms.
© 2024 The Author(s). This work is published and licensed by Dove Medical Press Limited. The
full terms of this license are available at https://www.dovepress.com/terms.php
and incorporate the Creative Commons Attribution
- Non Commercial (unported, 3.0) License.
By accessing the work you hereby accept the Terms. Non-commercial uses of the work are permitted
without any further permission from Dove Medical Press Limited, provided the work is properly
attributed. For permission for commercial use of this work, please see paragraphs 4.2 and 5 of our Terms.