")
Back to Journals » Clinical Ophthalmology » Volume 19
Diagnostic Capability of Pattern Electroretinogram and Three Circumpapillary Retinal Nerve Fiber Layer Thickness Circle Diameter Scans in Glaucoma Suspects
Authors Tirsi A , Tsai J, Abizadeh A, Kacaj D, Procyk O, Gliagias V, Leung N, Yang H, Park SC, Tello C
Received 13 August 2024
Accepted for publication 7 November 2024
Published 22 January 2025 Volume 2025:19 Pages 235—247
DOI https://doi.org/10.2147/OPTH.S483055
Checked for plagiarism Yes
Review by Single anonymous peer review
Peer reviewer comments 2
Editor who approved publication: Dr Scott Fraser
Andrew Tirsi,1,2 Joby Tsai,3 Aaron Abizadeh,2 Danielle Kacaj,4 Oksana Procyk,1 Vasiliki Gliagias,2 Nicholas Leung,2 Hanwen Yang,2 Sung Chul Park,1,2 Celso Tello1,2
1Department of Ophthalmology, Manhattan Eye, Ear, and Throat Hospital/Northwell Health, New York, NY, USA; 2Donald and Barbara Zucker School of Medicine at Hofstra/Northwell Health, Hempstead, NY, USA; 3Broward Health, Department of Ophthalmology, Fort Lauderdale, FL, USA; 4Cornell University, Ithaca, NY, USA
Correspondence: Andrew Tirsi, Manhattan Eye Ear & Throat Hospital/Northwell Health, Department of Ophthalmology, 210 East 64th Street, New York, NY, 10065, USA, Tel +1 201 982 4168 ; +1 646 785 8217, Email [email protected]
Purpose: To assess the diagnostic capability of pattern electroretinography (PERG) and varying circumpapillary optical coherence tomography (OCT) scan diameters in glaucoma suspects (GS).
Methods: This is a prospective, cross-sectional study. Circumpapillary retinal nerve fiber layer thickness (RNFLT) was measured using spectral domain OCT in 49 eyes from 26 patients (36 normal, 13 GS) in three circle diameters (3.5, 4.1, and 4.7 mm). PERG measurements (Magnitude [Mag], MagnitudeD [MagD], MagnitudeD/Magnitude [MagD/Mag] ratio) were used. Based on clinical examination, participants were classified as controls or GS. Independent t-test and areas under the receiver operating characteristic curve (AUC) were obtained to determine the diagnostic capability of PERG and OCT.
Results: Independent t-test revealed significant differences between controls and GS in age, sex, central corneal thickness (CCT), all PERG parameters, and global RNFLT (gRNFLT) in three circle diameters. All PERG parameters were correlated to all RNFLT sectors (r > 0.291; p < 0.041), except in the temporal and nasal sectors of the three circle scans. Spearman rho was highest in 3.5 and lowest in 4.7 mm circle scan. AUC demonstrated 3.5 mm gRNFLT had the highest diagnostic capability (AUC = 0.877), followed by 4.1 mm gRNFLT (AUC = 0.852), and 4.7 mm gRNFLT (AUC = 0.821). MagD showed the foremost diagnostic capability (AUC = 0.81), followed by Mag (AUC = 0.799) and MagD/Mag (AUC = 0.762).
Conclusion: Global, superior, and inferior RNFLT in 3.5 and 4.1 mm diameters, and MagD performed best in discriminating GS from controls, suggesting that a larger scan of 4.1 mm may be equally useful in glaucoma diagnosis as the conventional 3.5 mm diameter. We recommend using PERG with OCT of 3.5 or 4.1 mm diameters for glaucoma suspect diagnosis.
Keywords: glaucoma suspects, glaucoma, PERG, SD-OCT, RNFL
Introduction
Glaucoma is one of the world’s leading causes of irreversible blindness.1 It is characterized by the death of retinal ganglion cells (RGC), optic neuropathy, and visual field defects.2 Glaucoma is often asymptomatic in its early stages and frequently not diagnosed until 35 % of the RGCs have died and the damage cannot be reversed.3,4 The hallmark of glaucoma is progressive neurodegeneration of the optic nerve and the loss of retinal ganglion cells leading to retinal nerve fiber layer (RNFL) thinning.5 However, RNFL thickness variations have been shown to exist in people with normal eyes as RNFL starts to thin as a person ages.6–8 In glaucoma, the RNFL starts thinning before any visual field changes.9 Ramanji S. et al demonstrates that 40 % to 50 % of the RNFL is lost before the visual field is affected.10 Therefore, a decrease of RNFL thickness (RNFLT) is the hallmark of glaucoma11 and glaucoma suspects (GS);12 and RNFL thinning precedes loss of vision in GS.13 Optical coherence tomography (OCT) detects early RNFL loss in glaucoma suspects in the absence of visual field deficits.13 Circumpapillary RNFLT is the most widely used OCT method for evaluating RNFL in glaucoma and consists of centering a circle scan on the optic nerve head,14,15 and compares the measurements to normative data.16 Time domain OCT (TD-OCT), an older generation device, uses a standard 3.4 mm circle scan diameter in detecting RNFL thinning in glaucoma patients, and it was reported to be more reproducible than scans with smaller (of 2.9 mm) or larger (4.5 mm) scan diameter.17 The newer generation spectral domain OCT (SD-OCT) does not yet have a definitively preeminent circle diameter scan,18 and both TD- and SD-OCT devices using a circle scan diameter of 3.4 mm conventionally for diagnosing glaucomatous changes in the RNFL.16,18,19 However, SD-OCT circle scans with diameters of 4.1 and 4.7 mm had diagnostic capabilities comparable with the conventional circle scan with a diameter of 3.5 mm in distinguishing glaucomatous from normal eyes.11 There is a lack of studies determining the best SD-OCT circle scan diameter for early detection of RNFLT changes in glaucoma suspect (GS) patients, crucial for assessing reversible structural or functional changes in the early stages of the disease. Thus, additional studies are needed to further evaluate the diagnostic abilities of each of the three circle diameters in GS.
Pattern electroretinogram (PERG) is an objective electrophysiological assessment used to evaluate the electrical function of the RGCs in response to a contrast-reversing pattern stimulus.20 It assesses the function of RGCs from the central 10° of the fovea and provides in vivo, electrophysiological assessments that are reliable, repeatable, and non-invasive.21 Since glaucoma is characterized by RGC dysfunction, PERG can be used to detect early changes in RGC function before structural changes in OCT RNFL thickness. Changes in PERG parameters are significantly associated with early RGC loss in glaucoma.22–31 Similarly, PERG has been reported to detect dysfunctional, but live, RGCs earlier than OCT in ocular hypertension cases, allowing for early treatment before irreversible damage.32 It has also been reported that there is a time lag of eight years between changes in PERG and RNFLT.33,34 Banitt et al have demonstrated that in a population of glaucoma suspects, it took an average of approximately 2 years for a 10 % change in PERG and 10 years to see a 10 % change in RNFL. In other words, it took eight years after PERG detected RGC dysfunction for RNFLT changes to get detected by OCT.
In the eight years during which RGC function is declining and RNFL is possibly thinning, and while visual field tests remain within normal limits, patients are diagnosed as GS. Few studies have evaluated RGC dysfunction or assessed the diagnostic capability of PERG in the GS population and its relationship with RNFLT change.35,36 In this study, we compared PERG with three circumpapillary circle diameter SD-OCT RNFLT scans and their ability to discriminate GS from normal eyes. Furthermore, we assessed the relationship between RGC function and its effects on the RNFLT measurements in the three circle scans with different diameters.
Materials and Methods
All eligible subjects were recruited from the Manhattan Eye Ear Throat Hospital Department of Ophthalmology between March and September 2017. Twenty-six patients (49 eyes) were included in this prospective cross-sectional observational study, as part of a larger longitudinal study where GS were monitored for 3 years for the progression of the disease. All participants underwent a complete ophthalmologic examination, including slit-lamp biomicroscopy, Goldmann tonometry, standard automated perimetry (Humphrey Field Analyzer II, 24–2 SITA-Standard strategy, 10–2 SITA-Standard strategy, Carl Zeiss Meditec Inc., Dublin, CA, USA), Spectralis SD-OCT (software version 5.4.7.0, Heidelberg Engineering, Heidelberg, Germany), and steady-state PERG (Diopsys Inc., Cedar Knolls, NJ, USA). The study was approved by the Institutional Review Board of Northwell Health System (IRB # 18–0397). Written informed consent was obtained from all subjects. The study followed the tenets of the Declaration of Helsinki and was conducted in accordance with the regulations of the Health Insurance Portability and Accountability Act.
Participants were diagnosed according to the following criteria: the presence of a suspicious glaucomatous optic nerve head appearance (increased cup-to-disc ratio > 0.4, cup-to-disc ratio asymmetry of > 0.2 between fellow eyes, neuroretinal rim thinning, notching or excavation); and a normal HFA 24–2 SITA-standard test at the baseline visit. Participants 20–80 years of age and with best corrected visual acuity (BCVA) better or equal to 20/40 (Snellen), any intraocular pressure (IOP) levels, and any type of angle were enrolled in this study. Individuals with documented and repeatable normal HFA 24–2, using the Humphrey 24–2 Swedish Interactive Threshold Algorithm, and defined by Glaucoma Hemifield test (GMT) “within normal limits” or pattern standard deviation (PSD) within 95 % confidence limits, and MD values ≥−2dB, were included. Other inclusion criteria included spherical refraction within ± 6.0 D, and cylinder correction within 3.0 D, as well as no IOP lowering treatment at the time of enrollment.
Participants with prior intraocular or posterior segment intraocular surgery, ocular trauma, ocular or systemic conditions that may affect the optic nerve head or retinal structure or function (eg, ischemic optic neuropathy, optic neuritis, papilledema, and corneal and retinal diseases) were not included in this study. Individuals with prior intraocular surgery in the study eye except for uncomplicated cataract extraction with posterior chamber intraocular lens (IOL) implant and no escape of vitreous to the anterior chamber, performed less than a year before enrollment, were excluded from this study. Individuals with unreliable HFA visual field results, with fixation losses, false positive rate, and false negative rate, each more than 20 %, as well as cases with possible juvenile open-angle glaucoma (JOAG) were excluded. Based on the inclusion/exclusion criteria, 1 eye with early age-related maculopathy and 2 eyes with MD 24–2 < -2 dB and GHT “outside normal limits” were excluded from this study. As a result, based on their comprehensive clinical examination, twenty-six participants (49 eyes) were recruited with normal HFA and normal OCT test results. Participants were classified as controls with normal RGC function or GS with borderline or abnormal RGC function, using PERG tests.
Tonometry
Goldmann applanation tonometry was used to measure IOP. It was performed by a glaucoma specialist, and two IOP readings were collected and averaged. The intra-class variation of the measurements was low and within the acceptable 1–2 mmHg.
Central Corneal Thickness Measurement
Many reports have shown that thinner than average corneas may underestimate the true IOP whereas thicker than average corneas may overestimate it. This effect has been found in the order of 1 mmHg correction for every 25 µm deviation from a central corneal thickness (CCT) of 550 µm. We used the handheld ultrasound PachPen (Accutome, Inc., Pennsylvania, USA) to determine CCT, and an average of 3 measurements were recorded. CCT measurements were considered in IOP estimations and RNFLT measurements.
Visual Field Testing
All participants in this study had prior experience with this examination, using a Humphrey perimeter (Humphrey Field Analyzer II, Carl Zeiss Meditec, Inc., Dublin, CA), and it has been described elsewhere.37 The SITA 24–2 and SITA 10–2 standard strategies were used and Global indices including mean Deviation (MD), Pattern Standard Deviation (PSD), as well as Visual Field indices (VFI) were provided on a statistical summary. Using HFA SITA 24–2 results, only participants with visual fields corresponding to stage 0 (no visual field losses) following the Glaucoma Staging System (GSS 2) were considered.38
Optical Coherence Tomography
Optic disc scans were obtained using Spectralis Heidelberg SD-OCT (software version 5.4.7.0, Heidelberg Engineering, Heidelberg, Germany). The newest SD-OCT Spectralis Glaucoma Module Premium Edition (GMPE) offers three circle scan diameters of 3.5 mm, 4.1 mm, and 4.7 mm and also includes the Anatomic Positioning System (APS) that automatically identifies two fixed structural landmarks on the retina: the center of the fovea and the center of Bruch’s membrane opening, and these landmarks are subsequently used to center the scans at the correct anatomic location for each individual eye according to the unique individual fovea-to-Bruch’s membrane opening center (FoBMOC) axis of the eye. As previously mentioned, this new technology increases the precision and repeatability of the placement of the scans for the best quadrant and sector selections accounting for the optic nerve head (ONH) positioning and the individual configuration of axons in each eye.
Spectralis SD-OCT has a scanning speed of 40,000 A-scans/second, and it has a transverse and axial resolution of 14 µm and 3.9 µm, respectively. RNFLT measurements are obtained by averaging 16 consecutive circular B-scans of 3.5, 4.1, or 4.7 mm circle scan diameters centered on the optic disc. The data are then compared with the normative database and RNFLT profiles, as well as RNFL measurements (in µm) corresponding to the 4 quadrants, as well as all nine RNFLT sectors. Additionally, Spectralis SD-OCT software provides additional RNFLT measurements (in µm) corresponding to six sectors and colored bars that will indicate the overall classification (within normal limits, borderline, or outside normal limits) (Figure 1). The Spectralis OCT image quality was achieved using the Q-score, and only scores ≥ 20 that were considered as good or excellent as by the manufacturer, were subsequently included in this study. Scans were well centered, with no movement artifacts and no segmentation errors.
 |
Figure 1 Retinal nerve fiber layer thickness Optical Coherence Tomography circle scans diameters 3.5mm, 4.1 mm and 4.7 mm in normal (OS) and glaucomatous eye (OD). |
Electrophysiology Testing
The steady-state pattern electroretinogram was recorded using a commercially available system, Diopsys® NOVA-PERG (Diopsys, Inc. Cedar Knolls, New Jersey, USA) module, as described previously.34–36,39–42 The forehead skin was cleaned using NuPerp® Skin Prep Gel (Weaver and Company, CO, USA) and the lower eyelids using OCuSOFT ® Lid Scrub Original (OCuSOFT® Inc., Rosenberg, TX, USA) to ensure good and stable electrical activity. Disposable hypoallergenic skin sensors Silver/Silver Chloride ink (Diopsys® proprietary Skin Sensor) were applied on the lower lid of both eyes, close to the lid margin and avoiding eyelashes. One ground sensor (Diopsys® EEG electrode) was applied in the central forehead area with a small amount of conductive paste (Ten20®, Weaver and Company) and then cables from the Diopsys NOVA device were connected to the electrodes. A total of 3 electrodes were used per test per patient (two active/reference and one ground electrode). Subjects were fitted with the appropriate correction for a viewing distance of 24 inches and were instructed to fixate on a target at the center of the monitor in front of them.
For each eye, three PERG measurements (Magnitude [Mag], MagnitudeD [MagD], MagnitudeD/Magnitude [MagD/Mag] ratio) were calculated. Mag (μV) represents the amplitude or the signal strength at the specific reversal rate of 15 Hz, in the frequency domain, while MagD indicates the amplitude of the PERG signal impacted by phase variability throughout the waveform recording. A recording where the phase of the response is consistent will produce a MagD value close to that of the Mag, whereas a recording where the phase of the response is affected by RGC dysfunction will produce a MagD value significantly lower than that of Mag. This is because averaging responses that are out-of-phase with each other will cause some degree of cancellation. The MagD/Mag ratio is a ratio that is a within-subject representation of the phase consistency of PERG. The SNR represents the level of electrical noise compared with the level of the PERG signal at 15 Hz.
Statistical Analysis
For all variables of interest, outliers with values ≥3 standard deviations from the mean were excluded from the analyses. Shapiro–Wilk test was used to determine the normality of the distribution for all important variables. Descriptive statistics were used to evaluate continuous and demographic data. Mean and standard deviation values were determined for each PERG parameter (Mag, MagD, and MagD/Mag ratio), HFA SITA standard (24–2) tests, and all RNFLT variables. Based on each subject’s clinical examination, participants were classified as controls or GS. Differences between groups were analyzed using independent t-tests for continuous variables and chi-square tests for categorical variables.
Spearman correlation coefficients were used to test the correlation between PERG measurements and RNFLT quadrants and sectors from different SD-OCT circle scan diameters. The Receiver Operating Characteristic (ROC) curves and areas under the receiver operating characteristic curve (AUC) were obtained to determine the diagnostic capability of each of the 3 PERG parameters and of each of the 7 RNFLT parameters in each of the 3 circle scans (3.5, 4.1 and 4.7 mm) to discriminate between normal and GS subjects. Statistical significance was defined as p < 0.05. Statistical analyses were performed with SPSS (ver.23.0; SPSS Inc, Chicago, IL, USA).
Results
We enrolled 49 eyes from 26 patients with a mean age of 58.96 ± 12.82 years, normal IOP and visual acuity, and slightly myopic spherical equivalent. The mean global RNFLT (gRNFLT) decreased significantly from 3.5 mm to 4.1 mm to 4.7 mm (98.08 ± 12.10, 84.00 ± 10.10, 72.90 ± 8.70 μm, respectively) (Table 1).
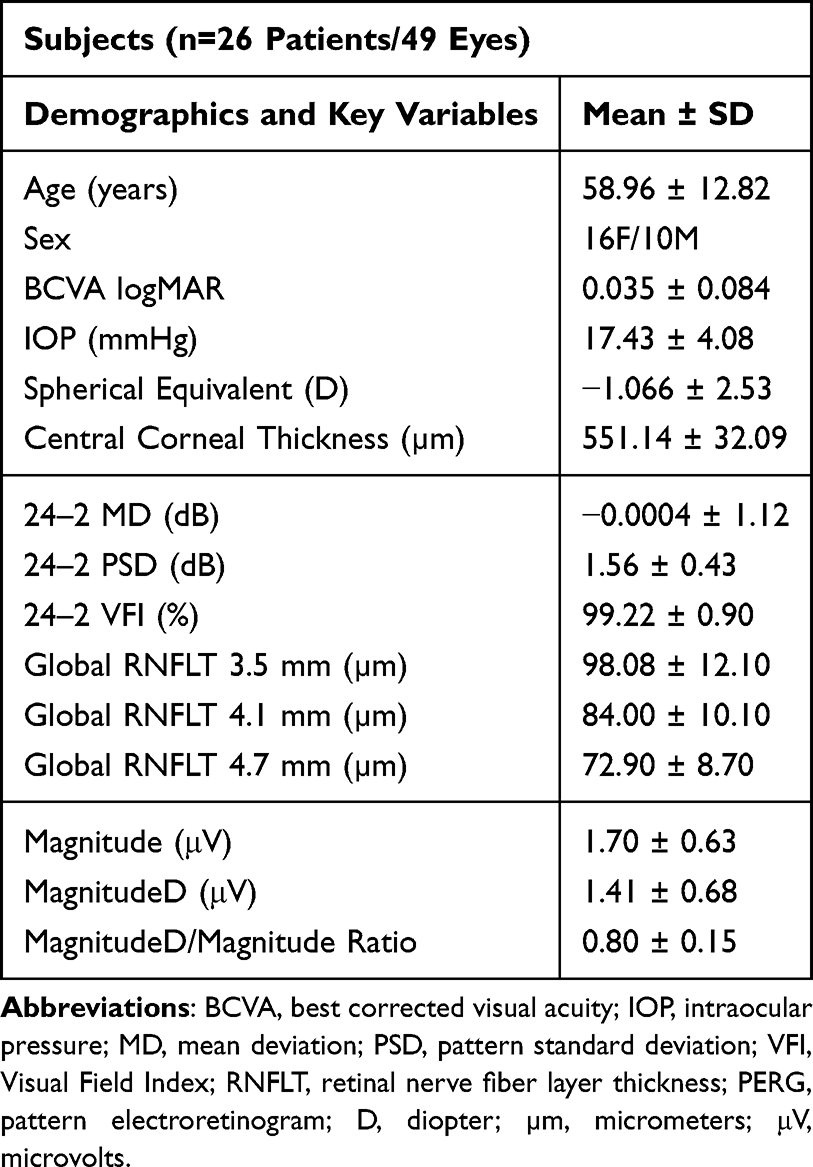 |
Table 1 Patient Demographics and Their Clinical Characteristics on Visual Field Test, RNFLT, and PERG Parameters |
Based on the subject’s clinical evaluation, 36 eyes were classified as normal and 13 eyes as GS (Table 2). The independent sample t-test analysis revealed significant differences between healthy controls and GS in the following variables: age, sex, CCT, all PERG parameters (Mag, MagD, MagD/Mag ratio), and RNFL global measurements in all three circle scan diameters. No significant differences were found between the control and GS groups in logMAR (0.03 vs 0.05), spherical equivalent (−0.95 vs −1.38 D), or IOP (17.33 vs 17.69 mmHg). However, there were significant differences between the control and GS groups in age (56.03 vs 67.08 years), sex (72.2 vs 62.5 % female), global RNFL measures for 3.5 mm (100.39 vs 85.46 μm), 4.1 mm (85.72 vs 75.31 μm), and 4.7 mm (73.28 vs 62.38 μm), and all PERG parameters consisting of Mag (1.85 vs 1.28 μv), MagD (1.57 vs 0.94 μV), and MagD/Mag Ratio (0.83 vs 0.71). All PERG parameters were significantly correlated to all RNFLT sectors (r > 0.291, p < 0.041), except in the temporal and nasal sectors of all three circle scans. This was expected since glaucomatous changes are usually found first in the superior and inferior sectors of the RNFL.43–45 The Spearman Rho was highest in the 3.5 mm circle scan analysis and lowest in the 4.7 mm circle scan (Table 3).
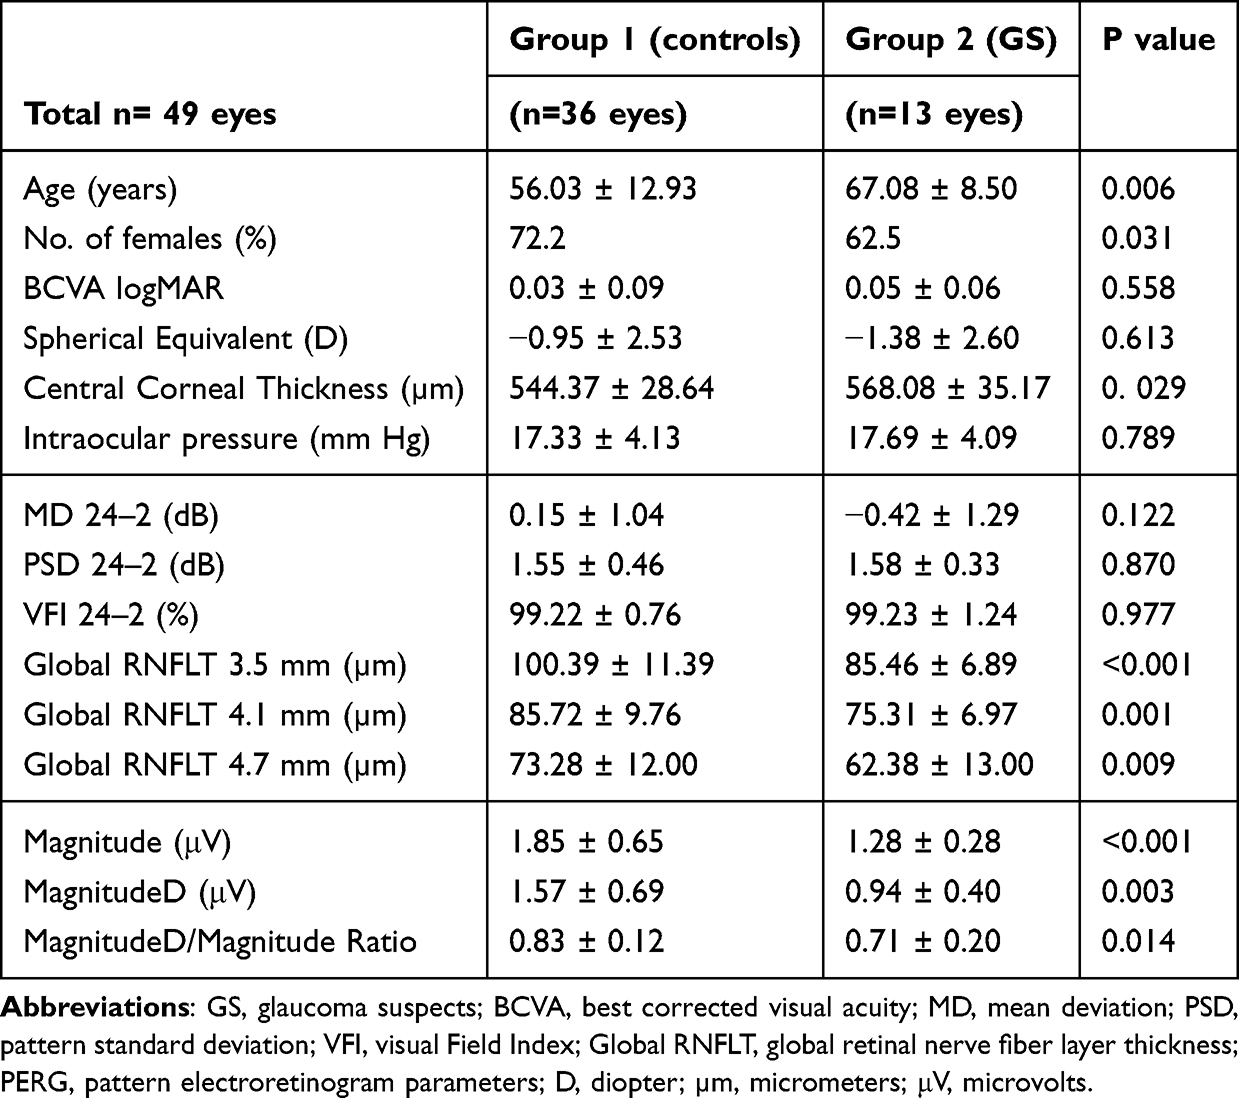 |
Table 2 Independent Sample t-Test Between Control and Glaucoma Suspect Subjects |
 |
Table 3 Spearman Correlation Between RNFLT Sectors and PERG Parameters |
AUC analysis demonstrated that gRNFLT for 3.5 mm circle diameter had the highest diagnostic capability (AUC = 0.877), followed by gRNFLT for 4.1 mm diameter (AUC = 0.852) and 4.7 mm diameter (AUC = 0.821). Of the PERG parameters, only MagD showed the foremost diagnostic capability (AUC = 0.81), followed by Mag (AUC = 0.799), and lastly MagD/Mag Ratio (AUC = 0.762) with the worst diagnostic capability (Table 4).
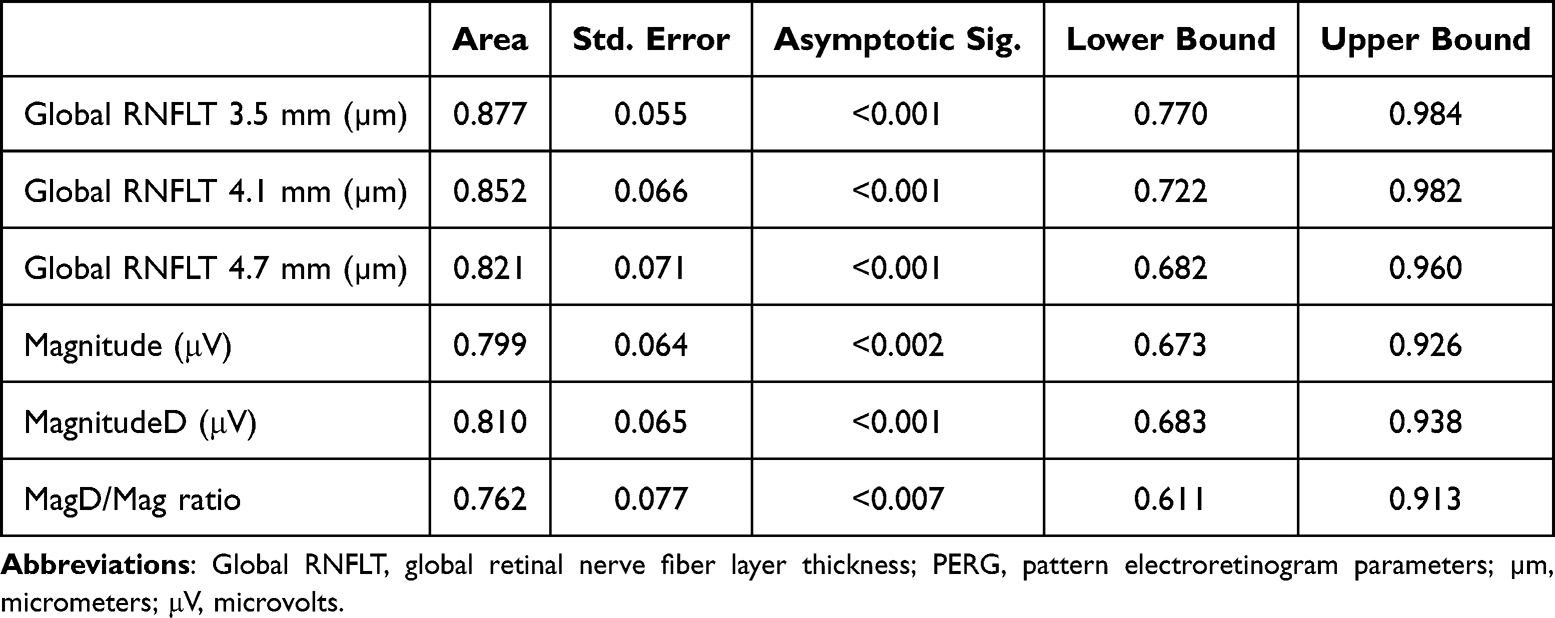 |
Table 4 Area Under the Receiver Operating Characteristic Curves of PERG and Global RNFLT Measurements from 3 Different Circle Scan Diameters in Glaucoma Suspect Subjects |
Figure 2 shows the AUCs for the three gRNFLT scans of 3.5, 4.1, and 4.7 mm diameters along with the three PERG parameters (Mag, MagD, MagD/Mag Ratio). The circle diameter scans of 3.5 mm and 4.1 mm had the greatest AUC values, and therefore are the best parameters for discriminating RNFL thinning between GS and control subjects. Table 5 demonstrates that all the RNFLT sectors and quadrants performed well except for the temporal quadrant. The global (AUC range: 0.821–0.877; p < 0.05) and superior (AUC range: 0.839–0.862; p < 0.05) quadrants overall had the best AUC values and therefore have the best diagnostic capability. The temporal quadrant had the lowest AUC values (AUC range: 0.596–0.604; p > 0.05) and is the least reliable quadrant to look at to discriminate RNFL thinning between GS and control subjects.
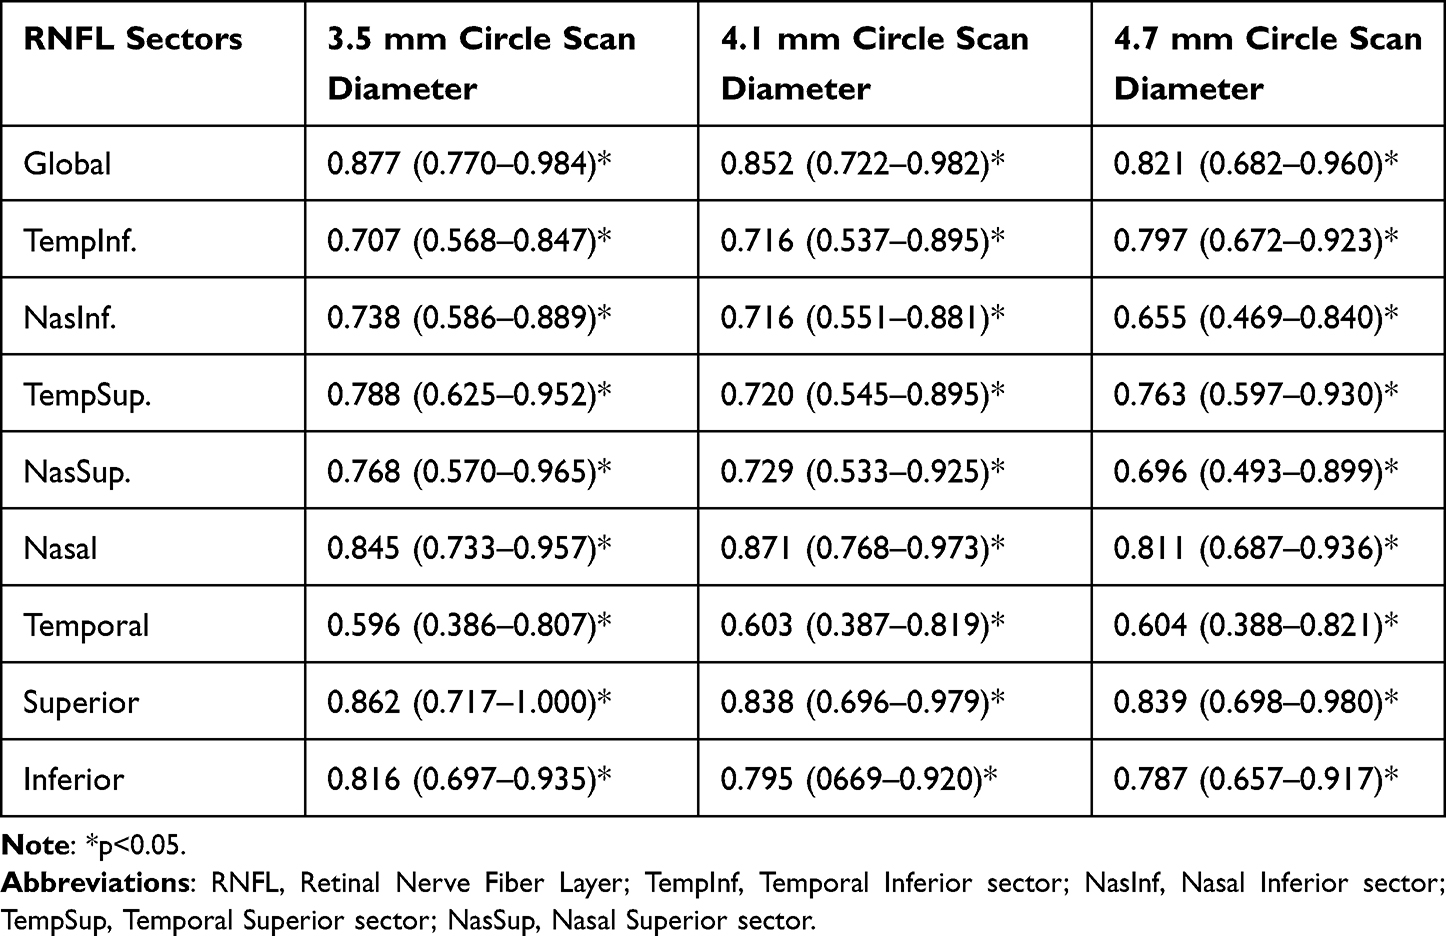 |
Table 5 Area Under the Receiver Operating Characteristics Curves of RNFLT Parameters in Circle Scans with Different Diameters |
 |
Figure 2 Area under the receiver operating characteristic curves. Abbreviations: RNFLT, retinal nerve fiber layer thickness; MagD/Mag ratio, MagnitudeD/Magnitude ratio. |
Discussion
The hallmark of glaucoma is the thinning of the RNFL, which can occur before visual field tests are abnormal.33 Recent research conducted by Ghassibi et al focused on determining which circle scan diameter provided by SD-OCT was the most effective at detecting RNFL thinning in glaucoma patients.11 They reported that the circle scan diameter of 4.1 mm was the best in detecting RNFL thinning in glaucoma patients, followed by 3.5 mm and 4.7 mm. However, there were no studies that have been reported to determine which of the SD-OCT circle scan diameters is the foremost in detecting early RNFLT changes to diagnose GS. As GS is in the early stages of the glaucoma spectrum, it is an especially important stage to evaluate for structural or functional changes in RNFL as these early changes are still reversible. Pattern electroretinogram was able to detect functional changes in subjects before the OCT was able to detect structural changes. More specifically, there is a lag time of eight years between changes in PERG and RNFLT.33 This lag of functional change before structural change makes for an opportune time to address reversible damage to RGCs. Furthermore, PERG has been demonstrated to predict glaucomatous progression in ocular hypertension at least one year ahead of conversion to glaucoma.22 However, few studies have assessed the diagnostic capability of PERG in GS or used PERG in conjunction with OCT, assessing the relationship between structure and function.35 To our knowledge, this is the first study to examine the diagnostic capability of PERG with the SD-OCT three different circle scan diameters and to assess the relationship between RGC dysfunction and its effects on RNFLT in GS participants.
In this study, we report that the smaller two SD-OCT circle diameters of 3.5 mm and 4.1 mm had the best diagnostic capability, while the 4.7 mm circle diameter had the lowest diagnostic capability in this population. Additionally, among the PERG parameters, MagD was best at discriminating between controls and GS subjects. This is in line with Ghassibi et al who reported that a 4.7 mm circle scan diameter had low diagnostic capability.11 This finding may be due to the RNFLT being thinner further away from the optic disc. We demonstrated that the gRNFLT in the 4.7 mm circle diameter scan was thinner than in the smaller circle diameter scans by 25.6 % (gRNFLT 3.5 mm = 98.08 μm; 4.7 mm = 72.90 μm). Therefore, we hypothesize that it is more difficult to detect subtle changes in thin RNFLT in the 4.7 mm circle scan diameter (Table 2). These difficulties could be associated with either OCT algorithm segmentation issues while measuring thin RNFL, or poorer detection rate of subtle glaucomatous change.11
Ghassibi et al’s study highlights the advantages of different circle scan diameters in retinal nerve fiber layer (RNFL) assessment. Smaller scans, such as the 3.5 mm diameter, display a more pronounced change in RNFL thickness due to their focused measurement area. Moreover, these smaller scans can more easily detect percent change, as they primarily measure the thickest RNFL closer to the optic nerve head. On the other hand, larger scans are effective in mitigating variability due to vessel distribution. Closer to the optic nerve, vessels show more variation due to vascular bifurcations, while further out, there is greater uniformity, making larger scans’ greater area of measurement less susceptible to this variability. Additionally, the influence of optic nerve head (ONH) size variation is noteworthy. A large ONH margin may lead to an overestimation of RNFL thickness with smaller scans, such as the 3.5 mm diameter, while larger scans like the 4.1 mm diameter, are less affected by this interindividual variability due to their larger area of measurement. Some benefits of the larger circle scans observed by Ghassibi et al included reduced interindividual variation in RNFLT measurements and minimized pathophysiologic artifacts produced by parapapillary atrophy and papilledema melanoma, as the scan is farther from the optic disc. Given the diagnostic deficiencies observed with the 4.7 mm circle scan diameter in our study, prioritizing the 4.1 mm diameter scan may offer a pragmatic approach, allowing for the potential benefits of larger scan diameters without sacrificing on the diagnostic ability of the scan in patients with such artifacts. Ideally, multiple different-size scans may be taken to gain a complete image of the patient’s overall condition, utilizing the benefits of each scan size collectively.
We demonstrated that PERG could discriminate GS from controls as evidenced by a reduction in Mag, indicating a possible RGC loss; a decreased MagD, demonstrating a delay in RGC response (an indirect measure of increased latency), and an overall decrease in MagD/Mag ratio, which could be explained by the simultaneous combination of RGC loss and dysfunctional cells. In this study, MagD performed better than the other PERG parameters in discriminating controls from GS, suggesting the presence of a significant RGC dysfunction. We found that there was a 36.99 % decrease in MagD, a 24.56 % decrease in Mag, and only a 15.66 % decrease in MagD/Mag Ratio when comparing controls to GS subjects.
The PERG technique has been used for over 25 years as an objective test for the RGC function in glaucoma. The recent introduction of overly sensitive electrodes and new technology have made this test very reproducible, but the interpretation of PERG results is still an object of discussion.46 After excluding retinal co-existent co-morbidities, PERG magnitude loss is associated with a loss of RGCs, sick RGCs, or a combination of the two conditions.35 Media opacities deteriorate the quality of the optical stimulus and therefore could lead to a magnitude loss as well.46 Less is known about the changes in the PERG latency (MagD), and these alterations have not been intensively investigated in glaucoma. Some studies reported that latency delays were rarely observed in glaucoma,28 while other studies, using a specific PERG paradigm, reported significant latency delays in their subjects.47 In line with Porciatti et al's study, our data suggested that PERG MagD delays (latency) were associated with pathophysiological mechanisms related to the RGCs undergoing morphological changes associated with stress and possible IOP or vascular-mediated insult. As a result, damaged RGCs show dendritic dysfunction, and/or delay of axonal transport. These conditions represent an opportunity to detect RGC dysfunction before cellular apoptosis and cell death is activated.46 At this stage, it is believed that RGC damage is potentially reversible.46 Porciatti et al were able to demonstrate the presence of temporarily induced reversible PERG amplitude losses and phase delays in some glaucoma suspects during head-down body tilt.48 Recent studies in experimental glaucoma have demonstrated that RGCs undergo morphologic changes before cell death, which is represented by a reduction of soma volume, axon size, and dendritic tree area.49 These changes are consistent with cell shrinkage as an explanation for the apparent survival of a specific type of RGCs, the midget cells, reported in earlier studies.50 In another study, Weber et al concluded that M-cells and P-cells were involved to a similar extent, demonstrating a reduction in thickness and complexity of the dendritic tree in primate glaucomatous retinas.49,51,52
While the axonal damage and its mechanisms are still not fully understood, the pattern of peripapillary and macular RNFL thinning is now well described by OCT studies.49 Thinning of the RNFL in glaucomatous eyes was first described by Schuman et al,53 where they reported the RNFL thinning to be more evident in the inferior quadrant. Subsequent studies have reported the greatest reductions at the superotemporal (11 o’clock) and inferotemporal (7 o’clock) sectors, demonstrating that these RNFLT defects were congruent with the distribution of the most reported visual field defects in glaucomatous eyes.54 Numerous OCT studies have confirmed the typical pattern of relative sparing of the peripapillary RNFL in the temporal quadrant. Studies have also recommended looking at the inferior (inferotemporal) and superior (superotemporal) RNFL quadrants to distinguish normal eyes from glaucomatous eyes.55 In this study, RGC dysfunction assessed using PERG testing demonstrated significant associations among PERG parameters with the superior and inferior RNFL quadrants, clearly illustrating predominant damage in these quadrants, which is in line with the described pattern by the previous OCT studies. The associations among PERG parameters remained significant with all 3 circumpapillary circle scan diameters, demonstrating a stronger association with 3.5 mm and 4.1 mm scan diameters. These associations are mostly due to the higher density and thickness of the RNFL closer to the border of the optic nerve.11
The PERG parameters were associated with global RNFLT and almost all RNFL sectors in all three scan diameters, except temporal and nasal sectors, indicating the presence of coexistent functional and structural damage in GS. In GS participants, the structural damage detected by OCT was still “in the green”, when compared to the normative data, underlying the challenges while diagnosing this stage of disease. By combining PERG and OCT, it is possible to obtain unique information on the reduced responsiveness of viable RGCs, and the three circle scan diameters confirm the damage patterns of RNFL in the specific sectors and open a window of interest into RGC axonal transport and mitochondrial dysfunctions in GS.56
This study had several advantages. First, in this prospective cross-sectional study, participants were tested with PERG and OCT on the same day as their routine examination, which allowed us to correlate functional and structural measurements with IOP levels and visual field tests. Second, subjects were allowed enough time to rest between the tests, and rewetting drops were used during PERG testing when needed. The control group was comprised of subjects who were classified as glaucoma suspects but with normal RGC function, which makes these comparisons even more interesting. To the best of our knowledge, this is the only study that assessed Mag and MagD separately and correlated their clinical significance with RNFLT in 3 different circle scans. We have demonstrated that PERG Mag and MagD were uncoupled and that these measures reflect distinct aspects of RGC activity. Lastly, no subjects with significant optical opacities were enrolled in the study; therefore, avoiding conditions that could reduce the magnitude of the PERG signal.46
This study also had several limitations. A small sample size of 26 patients and a total of 49 eyes were used. Larger cohorts are needed to better assess the diagnostic abilities of these tests across the whole spectrum of the disease, including healthy controls, glaucoma suspects, and early glaucoma. Further longitudinal studies should be conducted to monitor the longitudinal diagnostic capabilities of RNFLT and PERG. Future studies are also needed to gather and analyze data on race and ethnicity, which was not available for this study. In this study, we did not find any significant group difference in IOP, despite demonstrating thicker CCT in the GS group, highlighting the necessity to further investigate these relationships in future studies. Lastly, there were no cases with significant peripapillary atrophy to comment on the advantage of the larger 4.1 mm RNFLT circle scan diameter.
Our data supports the clinical potential of PERG as a complement to the standard of care screening for glaucoma while assessing all three PERG parameters together. We propose that future RNFLT assessments should be used with all three circle scan diameters of the OCT. Adding a few more OCT circle scans will not be limited by time or the patient’s discomfort. From our experience, the extra data could be very advantageous for follow-up studies. Ghassibi et al recommended using the smaller scan for glaucoma suspects, being more sensitive to detect glaucomatous change, and a larger scan diameter in subjects with parapapillary atrophy (PPA),11 that could measure RNFLT beyond the margin of PPA, by avoiding the affected area.
Conclusion
OCT parameters of global, superior, and inferior RNFLT in 3.5 and 4.1 mm scan diameters, and the PERG parameter of MagD performed best in detecting GS among all RNFLT sectors and quadrants as well as among all PERG parameters. These results suggest that a larger circumpapillary RNFL scan of 4.1 mm may be as useful in glaucoma diagnosis as the conventional ~3.4 mm circle scan diameter. We recommend that PERG, specifically MagD, be used in conjunction with OCT of 3.5 or 4.1 mm scan diameters to improve earlier glaucoma diagnosis and early intervention, especially in difficult cases with structural abnormalities such as tilted discs or peripapillary atrophy. Further studies are needed to investigate the impact of different circle scan diameters on improving the diagnostic capability of PERG for early diagnosis of glaucoma.
Data Sharing Statement
The data that support the findings of this study are available on request from the corresponding author, AT. The data are not publicly available due to their containing information that could compromise the privacy of research participants.
Ethics Approval and Informed Consent/Consent for Publication
Written informed consent was obtained from all subjects. The study was approved by the Institutional Review Board of Northwell Health System. Written informed consent was obtained from all subjects. The study followed the tenets of the Declaration of Helsinki and was conducted per the regulations of the Health Insurance Portability and Accountability Act.
Disclosures
Dr Andrew Tirsi is a consultant for Diopsys, Inc. The authors report no other conflicts of interest in this work.
Funding
This study was supported by the Hess Glaucoma Fund (# 591407). The device and software used for this investigation were provided by Diopsys Inc.
References
1. Tham YC, Li X, Wong TY, Quigley HA, Aung T, Cheng CY. Global prevalence of glaucoma and projections of glaucoma burden through 2040: a systematic review and meta-analysis. Ophthalmology. 2014;121(11):2081–2090. doi:10.1016/j.ophtha.2014.05.013
2. Weinreb RN, Aung T, Medeiros FA. The pathophysiology and treatment of glaucoma: a review. JAMA. 2014;311(18):1901–1911. doi:10.1001/jama.2014.3192
3. Kreft D, Doblhammer G, Guthoff RF, Frech S. Prevalence, incidence, and risk factors of primary open-angle glaucoma - a cohort study based on longitudinal data from a German public health insurance. BMC Public Health. 2019;19(1):851. doi:10.1186/s12889-019-6935-6
4. Kim YS, Yi MY, Hong YJ, Park KH. The impact of visual symptoms on the quality of life of patients with early to moderate glaucoma. Int Ophthalmol. 2018;38(4):1531–1539. doi:10.1007/s10792-017-0616-1
5. He S, Stankowska DL, Ellis DZ, Krishnamoorthy RR, Yorio T. Targets of neuroprotection in glaucoma. J Ocul Pharmacol Ther. 2018;34(1–2):85–106. doi:10.1089/jop.2017.0041
6. Leung CK, Yu M, Weinreb RN, et al. Retinal nerve fiber layer imaging with spectral-domain optical coherence tomography: a prospective analysis of age-related loss. Ophthalmology. 2012;119(4):731–737. doi:10.1016/j.ophtha.2011.10.010
7. Leung CKS, Ye C, Weinreb RN, Yu M, Lai G, Lam DS. Impact of age-related change of retinal nerve fiber layer and macular thicknesses on evaluation of glaucoma progression. Ophthalmology. 2013;120(12):2485–2492. doi:10.1016/j.ophtha.2013.07.021
8. Vianna JR, Danthurebandara VM, Sharpe GP, et al. Importance of normal aging in estimating the rate of glaucomatous neuroretinal rim and retinal nerve fiber layer loss. Ophthalmology. 2015;122(12):2392–2398. doi:10.1016/j.ophtha.2015.08.020
9. Alasil T, Wang K, Yu F, et al. Correlation of retinal nerve fiber layer thickness and visual fields in glaucoma: a broken stick model. Am J Ophthalmol. 2014;157(5):953–959. doi:10.1016/j.ajo.2014.01.014
10. Sihota R, Sony P, Gupta V, Dada T, Singh R. Diagnostic capability of optical coherence tomography in evaluating the degree of glaucomatous retinal nerve fiber damage. Invest Ophthalmol Vis Sci. 2006;47(5):2006–2010. doi:10.1167/iovs.05-1102
11. Ghassibi MP, Chien JL, Patthanathamrongkasem T, et al. Glaucoma diagnostic capability of circumpapillary retinal nerve fiber layer thickness in circle scans with different diameters. J Glaucoma. 2017;26(4):335–342. doi:10.1097/IJG.0000000000000610
12. Miki A, Medeiros FA, Weinreb RN, et al. Rates of retinal nerve fiber layer thinning in glaucoma suspect eyes. Ophthalmology. 2014;121(7):1350–1358. doi:10.1016/j.ophtha.2014.01.017
13. Gupta A, Chaku M, Hughes BA, Juzych MS, Kim C. Relationship of retinal nerve fiber layer to visual field in glaucoma, glaucoma suspect and normal patients. Invest Ophthalmol Vis Sci. 2006;47(13):3662.
14. Tsang SH, Sharma T. Optical coherence tomography. Adv Exp Med Biol. 2018;1085:11–13.
15. Vizzeri G, Weinreb RN, Gonzalez-Garcia AO, et al. Agreement between spectral-domain and time-domain oct for measuring rnfl thickness. Br J Ophthalmol. 2009;93(6):775–781. doi:10.1136/bjo.2008.150698
16. Hougaard JL, Heijl A, Bengtsson B. Glaucoma detection by stratus oct. J Glaucoma. 2007;16(3):302–306. doi:10.1097/IJG.0b013e318032e4d4
17. Schuman JS, Pedut-Kloizman T, Hertzmark E, et al. Reproducibility of nerve fiber layer thickness measurements using optical coherence tomography. Ophthalmology. 1996;103(11):1889–1898. doi:10.1016/S0161-6420(96)30410-7
18. Sehi M, Grewal DS, Sheets CW, Greenfield DS. Diagnostic ability of Fourier-domain vs time-domain optical coherence tomography for glaucoma detection. Am J Ophthalmol. 2009;148(4):597–605. doi:10.1016/j.ajo.2009.05.030
19. Leite MT, Rao HL, Zangwill LM, Weinreb RN, Medeiros FA. Comparison of the diagnostic accuracies of the spectralis, cirrus, and rtvue optical coherence tomography devices in glaucoma. Ophthalmology. 2011;118(7):1334–1339. doi:10.1016/j.ophtha.2010.11.029
20. Ventura LM, Porciatti V. Pattern electroretinogram in glaucoma. Curr Opin Ophthalmol. 2006;17(2):196–202. doi:10.1097/01.icu.0000193082.44938.3c
21. Kudrna JJ, Ferguson TJ, Swan RJ, et al. Short-term steady-state pattern electroretinography changes using a multi-pressure dial in ocular hypertensive, glaucoma suspect, and mild open-angle glaucoma patients: a randomized, controlled, prospective, pilot study. Ophthalmol Ther. 2020;9:981–992. doi:10.1007/s40123-020-00302-5
22. Bach M, Unsoeld AS, Philippin H, et al. Pattern erg as an early glaucoma indicator in ocular hypertension: a long-term, prospective study. Invest Ophthalmol Vis Sci. 2006;47(11):4881–4887. doi:10.1167/iovs.05-0875
23. Cvenkel B, Sustar M, Perovsek D. Ganglion cell loss in early glaucoma, as assessed by photopic negative response, pattern electroretinogram, and spectral-domain optical coherence tomography. Doc Ophthalmol. 2017;135(1):17–28. doi:10.1007/s10633-017-9595-9
24. Graham SL, Wong VA, Drance SM, Mikelberg FS. Pattern electroretinograms from hemifields in normal subjects and patients with glaucoma. Invest Ophthalmol Vis Sci. 1994;35(9):3347–3356.
25. Karaskiewicz J, Drobek-Slowik M, Lubinski W. Pattern electroretinogram (perg) in the early diagnosis of normal-tension preperimetric glaucoma: a case report. Doc Ophthalmol. 2014;128(1):53–58. doi:10.1007/s10633-013-9414-x
26. Kreuz AC, de Moraes CG, Hatanaka M, Oyamada MK, Monteiro MLR. Macular and multifocal perg and fd-oct in preperimetric and hemifield loss glaucoma. J Glaucoma. 2018;27(2):121–132. doi:10.1097/IJG.0000000000000857
27. Wilsey LJ, Fortune B. Electroretinography in glaucoma diagnosis. Curr Opin Ophthalmol. 2016;27(2):118–124. doi:10.1097/ICU.0000000000000241
28. Bach M, Hoffmann MB. Update on the pattern electroretinogram in glaucoma. Optom Vis Sci. 2008;85(6):386–395. doi:10.1097/OPX.0b013e318177ebf3
29. Amarasekera DC, Resende AF, Waisbourd M, et al. Steady-state pattern electroretinogram and short-duration transient visual evoked potentials in glaucomatous and healthy eyes. Clin Exp Ophthalmol. 2018;46(1):54–61. doi:10.1111/ceo.13006
30. Papst N, Bopp M, Schnaudigel OE. The pattern evoked electroretinogram associated with elevated intraocular pressure. Graefes Arch Clin Exp Ophthalmol. 1984;222(1):34–37. doi:10.1007/BF02133775
31. Resende AF, Sanvicente CT, Eshraghi H, et al. Test-retest repeatability of the pattern electroretinogram and flicker electroretinogram. Doc Ophthalmol. 2019;139(3):185–195. doi:10.1007/s10633-019-09707-5
32. Turkey E, Elsanabary ZSE, Elshazly LHM, Osman MH. Role of pattern electroretinogram in ocular hypertension and early glaucoma. J Glaucoma. 2019;28(10):871–877. doi:10.1097/IJG.0000000000001325
33. Banitt MR, Ventura LM, Feuer WJ, et al. Progressive loss of retinal ganglion cell function precedes structural loss by several years in glaucoma suspects. Invest Ophthalmol Vis Sci. 2013;54(3):2346–2352. doi:10.1167/iovs.12-11026
34. Tirsi A, Gliagias V, Sheha H, et al. Retinal Ganglion cell functional recovery after intraocular pressure lowering treatment using prostaglandin analogs in glaucoma suspects: a prospective pilot study. J Curr Glaucoma Pract. 2023;17(4):178–190. doi:10.5005/jp-journals-10078-1423
35. Tirsi A, Wong A, Zhu D, Stoffels G, Derr P, Tello Md C. Pattern electroretinogram parameters and their associations with optical coherence tomography in glaucoma suspects. J Curr Glaucoma Pract. 2022;16(2):96–104. doi:10.5005/jp-journals-10078-1365
36. Tirsi A, Gliagias V, Moehringer J, et al. Pattern electroretinogram parameters are associated with optic nerve morphology in preperimetric glaucoma after adjusting for disc area. J Ophthalmol. 2021;2021:8025337. doi:10.1155/2021/8025337
37. Wen JC, Lee CS, Keane PA, et al. Forecasting future Humphrey visual fields using deep learning. PLoS One. 2019;14(4):e0214875. doi:10.1371/journal.pone.0214875
38. Brusini P, Filacorda S. Enhanced glaucoma staging system (gss 2) for classifying functional damage in glaucoma. J Glaucoma. 2006;15(1):40–46. doi:10.1097/01.ijg.0000195932.48288.97
39. Tirsi A, Gliagias V, Zhu D, et al. Correlations between steady-state pattern electroretinogram and Humphrey visual field analyzer global indices and their associations with retinal Ganglion cell layer-inner plexiform layer thickness in glaucoma suspects. J Ophthalmol. 2024;2024:2443887. doi:10.1155/2024/2443887
40. Orshan D, Tirsi A, Sheha H, et al. Structure-function models for estimating retinal ganglion cell count using steady-state pattern electroretinography and optical coherence tomography in glaucoma suspects and preperimetric glaucoma: an electrophysiological pilot study. Doc Ophthalmol. 2022;145(3):221–235. doi:10.1007/s10633-022-09900-z
41. Tirsi A, Shah PP, Gliagias V, et al. Posterior pole asymmetry analysis as a diagnostic tool in glaucoma suspects: an electrophysiological approach. Clin Ophthalmol. 2023;17:1777–1787. doi:10.2147/OPTH.S411647
42. Tirsi A, Orshan D, Wong B, et al. Associations between steady-state pattern electroretinography and estimated retinal ganglion cell count in glaucoma suspects. Doc Ophthalmol. 2022;145(1):11–25. doi:10.1007/s10633-022-09869-9
43. Kanamori A, Nakamura M, Escano MF, Seya R, Maeda H, Negi A. Evaluation of the glaucomatous damage on retinal nerve fiber layer thickness measured by optical coherence tomography. Am J Ophthalmol. 2003;135(4):513–520. doi:10.1016/S0002-9394(02)02003-2
44. Nouri-Mahdavi K, Hoffman D, Tannenbaum DP, Law SK, Caprioli J. Identifying early glaucoma with optical coherence tomography. Am J Ophthalmol. 2004;137(2):228–235. doi:10.1016/j.ajo.2003.09.004
45. Varma R, Skaf M, Barron E. Retinal nerve fiber layer thickness in normal human eyes. Ophthalmology. 1996;103(12):2114–2119. doi:10.1016/S0161-6420(96)30381-3
46. Porciatti V, Ventura LM. Physiologic significance of steady-state pattern electroretinogram losses in glaucoma: clues from simulation of abnormalities in normal subjects. J Glaucoma. 2009;18(7):535–542. doi:10.1097/IJG.0b013e318193c2e1
47. Ventura LM, Porciatti V, Ishida K, Feuer WJ, Parrish RK. Pattern electroretinogram abnormality and glaucoma. Ophthalmology. 2005;112(1):10–19. doi:10.1016/j.ophtha.2004.07.018
48. Ventura LM, Golubev I, Lee W, et al. Head-down posture induces perg alterations in early glaucoma. J Glaucoma. 2013;22(3):255–264. doi:10.1097/IJG.0b013e318232973b
49. La Morgia C, Di Vito L, Carelli V, Carbonelli M. Patterns of retinal ganglion cell damage in neurodegenerative disorders: parvocellular vs magnocellular degeneration in optical coherence tomography studies. Front Neurol. 2017;8:710. doi:10.3389/fneur.2017.00710
50. Weber AJ, Chen H, Hubbard WC, Kaufman PL. Experimental glaucoma and cell size, density, and number in the primate lateral geniculate nucleus. Invest Ophthalmol Vis Sci. 2000;41(6):1370–1379.
51. Weber AJ, Kaufman PL, Hubbard WC. Morphology of single ganglion cells in the glaucomatous primate retina. Invest Ophthalmol Vis Sci. 1998;39(12):2304–2320.
52. Weber AJ, Harman CD. Structure-function relations of parasol cells in the normal and glaucomatous primate retina. Invest Ophthalmol Vis Sci. 2005;46(9):3197–3207. doi:10.1167/iovs.04-0834
53. Schuman JS, Hee MR, Puliafito CA, et al. Quantification of nerve fiber layer thickness in normal and glaucomatous eyes using optical coherence tomography. Arch Ophthalmol. 1995;113(5):586–596. doi:10.1001/archopht.1995.01100050054031
54. Leung CK, Chan WM, Yung WH, et al. Comparison of macular and peripapillary measurements for the detection of glaucoma: an optical coherence tomography study. Ophthalmology. 2005;112(3):391–400. doi:10.1016/j.ophtha.2004.10.020
55. Leung CK, Cheung CY, Weinreb RN, et al. Evaluation of retinal nerve fiber layer progression in glaucoma: a study on optical coherence tomography guided progression analysis. Invest Ophthalmol Vis Sci. 2010;51(1):217–222. doi:10.1167/iovs.09-3468
56. Davis BM, Crawley L, Pahlitzsch M, Javaid F, Cordeiro MF. Glaucoma: the retina and beyond. Acta Neuropathol. 2016;132(6):807–826. doi:10.1007/s00401-016-1609-2
 © 2025 The Author(s). This work is published and licensed by Dove Medical Press Limited. The
full terms of this license are available at https://www.dovepress.com/terms.php
and incorporate the Creative Commons Attribution
- Non Commercial (unported, 3.0) License.
By accessing the work you hereby accept the Terms. Non-commercial uses of the work are permitted
without any further permission from Dove Medical Press Limited, provided the work is properly
attributed. For permission for commercial use of this work, please see paragraphs 4.2 and 5 of our Terms.
© 2025 The Author(s). This work is published and licensed by Dove Medical Press Limited. The
full terms of this license are available at https://www.dovepress.com/terms.php
and incorporate the Creative Commons Attribution
- Non Commercial (unported, 3.0) License.
By accessing the work you hereby accept the Terms. Non-commercial uses of the work are permitted
without any further permission from Dove Medical Press Limited, provided the work is properly
attributed. For permission for commercial use of this work, please see paragraphs 4.2 and 5 of our Terms.
Recommended articles
Morphological and Functional Assessment of the Optic Nerve Head and Retinal Ganglion Cells in Dry vs Chronically Treated Wet Age-Related Macular Degeneration
Wichrowska M, Wichrowski P, Kocięcki J
Clinical Ophthalmology 2022, 16:2373-2384
Published Date: 28 July 2022
A Novel Biomarker in Primary Glaucoma: Aqueous Humor and Serum Levels of Ischemia Modified Albumin (IMA)
Rusmayani E, Artini W, Sasongko MB, Suhardjo, Viona V
Clinical Ophthalmology 2022, 16:4075-4087
Published Date: 10 December 2022