")
Back to Journals » Journal of Inflammation Research » Volume 18
Elucidating Molecule-Crosstalk of Neutrophil Extracellular Traps Between Cardiovascular Disease and Psoriasis: Insights Into Mendelian Randomization, Single-Cell RNA Analysis, Shared Targets and the Role of Resveratrol
Authors Jin X, Zhang Y, Qin G, Fang X, Zhang X, Sun J, Zhou M, Tong X , Xue Y , Yang H, Tian W
Received 18 September 2024
Accepted for publication 28 February 2025
Published 17 March 2025 Volume 2025:18 Pages 3913—3935
DOI https://doi.org/10.2147/JIR.S493416
Checked for plagiarism Yes
Review by Single anonymous peer review
Peer reviewer comments 2
Editor who approved publication: Professor Ning Quan
Xiaojun Jin,1,2,* Yun Zhang,3,* Gaofeng Qin,4 Xinyan Fang,5 Xinnan Zhang,6 Jialin Sun,5 Min Zhou,1 Xuecheng Tong,1 Yuan Xue,1 Hui Yang,1 Weihong Tian1
1Department of Clinical Technology Laboratory, Changzhou Clinical College of Xuzhou Medical University, Changzhou Third People’s Hospital, Changzhou, Jiangsu, 213000, People’s Republic of China; 2Department of Clinical Medicine, School of Medicine, Ningbo University, Ningbo, Zhejiang, People’s Republic of China; 3Department of Ophthalmology, The Third Affiliated Hospital of Southern Medical University, Southern Medical University, Guangzhou, Guangdong, 510000, People’s Republic of China; 4Department of Life Science Institute, Jinzhou Medical University, Jinzhou, Liaoning, 121001, People’s Republic of China; 5School of Statistics, East China Normal University, Shanghai, 200062, People’s Republic of China; 6School of Teacher Education, Ningbo University, Ningbo, Zhejiang, 315000, People’s Republic of China
*These authors contributed equally to this work
Correspondence: Weihong Tian, Changzhou Clinical College of Xuzhou Medical University, Changzhou Third People’s Hospital, Changzhou, Jiangsu, 213000, People’s Republic of China, Email [email protected]
Background: Left ventricular hypertrophy (LVH) associated with hypertension and psoriasis (PSO) are linked by poor prognosis. Neutrophil extracellular traps (NETs) are implicated in both conditions, but the mechanisms remain unclear.
Methods: We integrated bulk and single-cell RNA sequencing, mendelian randomization, immune microenvironment analysis, and molecular docking to explore the molecular interactions between LVH and PSO, focusing on NET-related pathways. Prediction models were also developed, and gene function was validated through in vivo and in vitro experiments.
Results: Our findings identified NETs-associated genes, AKT serine/threonine kinase 1 (AKT1), and receptor-interacting protein kinase 1 (RIPK1), regulating inflammation, fibroblast activation, and apoptosis in LVH and PSO. Functional enrichment analysis revealed mitochondrial metabolic disorders and extensive inflammation as the most prominent shared features of LVH and PSO diseases. Additionally, resveratrol exhibited a high binding affinity to the AKT1 and RIPK1 proteins. Functional validation showed that knockdown of AKT1 reduced LVH cell hypertrophy and PSO cell apoptosis.
Conclusion: This study highlights molecular pathways linking LVH and PSO, suggesting novel targets for treating cardiac involvement in PSO patients with LVH.
Keywords: molecular crosstalk, hypertrophy, psoriasis, neutrophil extracellular traps, molecular docking
Introduction
A well-known risk factor for heart failure, hypertensive-associated left ventricular hypertrophy (LVH) shows a progressive loss of heart function; as myocardial remodeling starts, prolonged cardiac enlargement finally results in irreversible organ failure and death.1 There are several cellular cues that regulate the intricate pathophysiology of LVH. Therefore, it is imperative to determine the chemical changes that could cause LVH.
The global prevalence of psoriasis (PSO), a chronic cutaneous illness caused by a complex interaction of immunological, environmental, and hereditary variables, ranges between 0.09 and 5.1% of the adult population.2 Systemic inflammation has been documented in psoriatic individuals in addition to cutaneous inflammation. In psoriatic individuals, the inflammatory cutaneous-to-systemic expansion may trigger the resurgence of immune-mediated changes in the system, which could lead to significant comorbidities like diabetes mellitus, metabolic disorders like hypertension, and cardiovascular diseases.3 The relationship between psoriasis and an increased incidence of major adverse cardiovascular events has been observed in multiple epidemiologic studies. McDonald and Calabresi first demonstrated that the risk associated with vascular diseases was 2.2 times higher in more than 300 hospitalized patients with psoriasis than in controls with other dermatologic conditions.4 Numerous epidemiologic studies have found a link between psoriasis and a higher incidence of serious adverse cardiovascular events. More than 300 hospitalized psoriasis patients had a 2.2-fold increased risk of vascular disorders compared to controls with other dermatological conditions, as first shown by McDonald and Calabresi.5 These findings suggest that when psoriasis develops in an LVH patient, systemic inflammation and psoriatic condition may work together to raise cardiovascular risk, which in turn exacerbates preexisting cardiac damage. Because the underlying biological pathways driving LVH and psoriasis remain unclear. Developing novel intervention tactics will be aided by a deeper comprehension of the molecular crosstalk and interactions between these two states.
Activated neutrophils create NET-like structures called neutrophil extracellular traps (NETs) that are made of proteins and DNA histones and are used to catch microbes.6 According to reports, NETs have the ability to speed up the proliferation of vascular smooth muscle cells and are linked to hypertension, a major pathogenic factor that causes LVH. PSO is characterized by the invasion of epidermal neutrophils. A prior work demonstrated the significance of NETs in PSO by demonstrating their ability to activate epidermal TLR4/IL-36R crosstalk and induce inflammatory responses in PSO.7,8 Consequently, in order to suggest potential mechanisms for concurrent PSO-induced cardiac involvement and deterioration in LVH patients, it is imperative to identify and validate NET and NETosis biomarker-related disruption of molecules in LVH and PSO patients.
Precision medicine is accelerated by the integration and reanalysis of RNA-sequencing data using bioinformatics tools, which improves the accuracy of predicting the molecular pathophysiology of diseases. The genes associated with NETs that were differentially expressed in the two disorders were retrieved from public databases in order to provide light on the possible pathophysiologic mechanisms that connect PSO to LVH. This led to the identification of the gene, molecular network, and signaling pathway common profiles between PSO and LVH.
Materials and Methods
Mendelian Randomization (MR) Analysis of Ventricular Septal Thickness in LVH and PSO
Ventricular septal thickness is an important indicator reflecting the severity of LVH; We conducted a dual sample MR analysis to investigate the causal relationship between PSO and interventricular septal thickness. PSO (exposure, finn-b-L12_PSORI_VULG) and Interventricular septum thickness (outcome, bbj-a-2). The summary data comes from the IEU OpenGWAS database (https://gwas.mrcieu.ac.uk). The number of PSO queue cases is (212242 control samples and 2802 disease samples); The sample size of the interventricular septum thickness queue is 19318 In terms of instrumental variable (IV) selection criteria, firstly, single nucleotide polymorphisms (SNPs) with genome-wide significance (p < 5 × 10E-6) were selected from the PSO dataset. Secondly, to ensure the independence of SNPs, we performed linkage disequilibrium (LD) clustering (r2<0.001, window size=10000 kb) to select independent significant SNPs. Thirdly, quantify the strength of genetic variation by using the F-statistic. SNPs with F-statistic less than 10 are discarded, indicating insufficient strength of genetic variation. Following the above steps, the remaining SNPs are ultimately used as IV. For MR analysis, the standard deviation inverse weighting (IVW) method is used as the main MR method, and MR Egger is a further supplementary method for MR. The Cochran’s Q test is used to evaluate heterogeneity between estimates of a single genetic variation. When the p-value of Cochran’s Q test is below 0.05, we use a random effects model for the final MR analysis in IVW; Otherwise, choose a fixed effects model. For sensitivity analysis, the MR Egger intercept term is used to evaluate horizontal pleiotropy, with P>0.05 indicating the absence of horizontal pleiotropy. Heterogeneity was evaluated using Cochran’s Q test (P > 0.05), indicating no heterogeneity. The MR-PRESSO method is used to exclude horizontal multi-effect outliers that may seriously affect the estimation results. Perform a sensitivity analysis by sequentially removing each SNP to determine if they have an impact on the results. In addition, MR Steiger-directed testing was used to further evaluate the correlation between exposure and outcomes.9
Acquiring and Processing Data
RNA sequencing data from PBMCs of PSO (GSE141804) and LVH (GSE74144) were acquired from the Gene Expression Omnibus database. Further details surrounding the sample numbers of the individual study cohorts are provided separately as follows: LVH cohort (LVH samples: 14 cases; healthy cases: 8 cases) and PSO cohort (PSO samples: 12 cases; healthy cases: seven cases). Supporting data of single-cell RNA-Seq of the LVH mouse heart are available in the BioStudies database (http://www.ebi.ac.uk/biostudies) under accession number E-MTAB-8810, which is including two saline-control model and four angiotensin-2-induced LVH model.10,11
The information underwent log2 conversion and average standardization. Genes that were expressed differently (DEGs) were determined by comparing groups with a P-value <0.05 using the limma package, and then displayed using heatmap plots.
Sing-Cell RNA Sequencing Analysis
The R Seurat package was used to process the scRNA-sequencing data. After merging the Seurat objects into a single object, the PercentFeatureSet method was employed to determine the proportions of mitochondrial genes in each cell. Cells meeting the following criteria were excluded: those with more than 30% unique molecular IDs from mitochondrial genes, fewer than 200 genes per cell, and more than 2500 genes per cell. After log-transforming the filtered count matrix, the FindVariableFeatures tool was used to determine the top 2000 genes with variable expression. Prior to further reduction using t-distributed stochastic neighbour embedding (t-SNE), each gene expression was scaled, and principal components analysis was carried out using the top 2000 variable genes. Clustering was carried out with a resolution parameter of 0.5 using the FindCluster function. Subsequently, Cell-type annotation was subsequently performed using the Singler. This study utilized mean software to assess the NETs activity of each cell at the single-cell level and calculate the total NETs activity. Additionally, we utilized the default CellChat as the ligand-receptor database and integrated gene expression data via CellChat to evaluate the differences in the proposed intercellular communication modules.
Identification of Molecular Subtypes and Construction of Weighted Gene Co-Expression Networks
Samples from PSO and LVH were grouped together using k-means clustering analysis based on the expression patterns of NETs signature, with the k-value ranging from 2 to 9. The optimal number of clusters was determined using the consensus matrix and cumulative distribution function curves. Weighted correlation network analysis (WGCNA) was widely used to discover a distinct gene set associated with clinical trials. Utilizing the R WGCNA package, the WGCNA method was utilized to analyze gene expression data from PSO and LVH, aiming to elucidate the relationship between gene expression and various cluster traits, ultimately unveiling the genetic signature of NET-related molecular clusters in LVH and Subnormal samples assessed using hierarchical clustering, then creating a scale-free network. A neighboring matrix was generated with the selected soft threshold, derived from the pick soft function analysis and transformed into a corresponding topological overlap matrix (TOM). Hierarchical clustering was performed on the gene network using TOM as the distance metric to identify gene groups (module eigengenes, ME) exhibiting differential expression levels across clinical characteristics. Modules with correlations above 0.75 were combined. Pearson correlation analysis was utilized to establish associations between modules and clinical traits.
Neutrophil-Associated Functional Analysis Between Different Clusters
Enrichment scores for molecular pathways associated with neutrophils were computed for each sample using the ssGSEA algorithm in the gene set variation analysis package, utilizing gene sets pertaining to neutrophils from the Molecular Signatures Database. Each enrichment score indicated how much the molecular functions in the gene set were either increased or decreased in a sample. For each cohort, the enrichment scores differences between disease and healthy groups were compared using the GSVA and limma packages. Additionally, we utilized the immunedeconv R package to analyze cell-type fractions and identify the immune composition across various clusters by integrating six algorithms (xCell,12 TIMER,13 quantiseq,14 MCP counter,15 Epic,16 and CIBERSORT absolute mode).17
Utilizing Machine Learning Algorithms for the Purpose of Selecting Features and Creating Visual Representations
Predicting the risk of LVH and PSO onset and progression relies heavily on consistent and notable characteristics. We utilized a combination of 10 different machine-learning techniques, including CoxBoost, stepwise Cox, Lasso, Ridge, Enet, survival-SVMs, GBMs, SuperPC, plsRcox, and RSF to identify characteristic genes from NETs gene sets. Machine learning algorithms such as stepwise Cox, RSF, CoxBoost, and Lasso enhance predictive accuracy by transforming weak variables into strong ones. During the model construction phase, the LVH cohort was utilized as the training dataset for initial model development while the PSO cohort served as an independent testing dataset.
Evaluation of the Immune Cells, NETs and Metabolism Biological Process
The ssGSEA was proposed as a way to capture the function of specific pathways and immune cells through the combination of gene expression features. Gene sets containing the genes referring to activated dendritic cell, macrophage, monocyte and NETs initial biomarkers, as well as the metabolism pathways biomarkers, were acquired from GSEA database and subjected to the ssGSEA algorithm implemented in the GSVA package. The value of each gene set was enumerated as activated dendritic cells score, plasmacytoid dendritic cell score, macrophages score, natural killer cells score, regulatory T cells score, follicular helper T cells score, NETs score and metabolism score, respectively. Spearman correlations were utilized to establish the relationships between the scores of immune cell enrichment and Nets. Furthermore, a Spearman correlation test was conducted to analyze the associations between the expression levels of AKT1 and RIPK1 genes and the metabolic score in the disease group of each cohort.
Correlations Between the AKT1 and RIPK1 Gene Expression and Immunomodulators
Various immunomodulators, such as immune inhibitors and immunostimulators, were obtained from the TISIDB website at http://cis.hku.hk/TISIDB/index.php. Spearman correlations were utilized to establish the associations between AKT1 and RIPK1 expression and the expression patterns of immunomodulators in the disease group of every cohort.
Small Molecule Drugs Screening and Molecular-Ligand Docking Analyses
The connectivity map database (DGldb, https://www.dgidb.org/) is the drug-gene interaction rebuilding database, which is primarily utilized to explore the functional relationships among genes and small molecule compounds. The primary protein structures of the RIPK1 (4ITH, resolution: 2.25 Å) and AKT1 (3MV5, resolution: 2.47 Å) were obtained from the Protein Data Bank database (http://www.rcsb.org, PDB). The AutodockVina 1.2.2 docking software (http://autodock.scripps.edu/) was employed to analyze the binding affinities and modes of interaction. The molecular structure of resveratrol (ID: 445154) was retrieved from PubChem Compound (https://pubchem.ncbi.nlm.nih.gov/). The RIPK1 and AKT1 proteins and resveratrol molecular files were converted into PDBQT format with polar hydrogen atoms added and all water molecules were excluded for molecular-docking analysis. The grid box was set to 30 Å × 30 Å × 30 Å, and grid point distance was set to 0.05 nm.18 To validate the docking results, the molecular-ligand analyses of RIPK1 and AKTl proteins with resveratrol drug were also validated under CB dock2 software (https://cadd.labshare.cn/cb-dock2/index.php).
Construction of a Predictive Nomogram and Multilayer Perceptron (MLP)
A nomogram was constructed using the RMS software to predict the probability of LVH development by analyzing the overlapping gene expression profiles. Calibration graphs were used to assess the accuracy of the prediction model by comparing the predicted probability from the nomogram with the observed outcomes. MLP is a feedforward artificial neural network that includes an input layer, multiple hidden layers, and an output layer. The neurons in each layer are connected to the neurons in the next layer through weights and activation functions, thereby achieving complex nonlinear transformations of input data. Leveraging RIPK1 and AKT1, we constructed an MLP neural network model to assist in clinical diagnosis by determining the occurrence of LVH.
Immune Cells Analysis
The proportions of immune cells in each group were estimated using the LM22 gene signature via the CIBERSORT online tool, with a significance level set at P< 0.05. The relationship between the AKT1 and RIRK1 expression levels and the percentage of immune cells in PSO and LVH samples was analyzed through the Spearman correlation test.
Cell Culture and Transfection
Human keratinocyte cell lines, HaCat, were obtained from the cell bank of the Chinese Academy of Science (Shanghai, China). To create AC16 cells with reduced AKT1 levels (HaCat KD), cells were transfected with 100pM of siRNA targeting human AKT1 sequence from Gene-Pharma, China, using 4ul of Lipo8000 from Beyotime, China. The siRNA construct that was scrambled served as the negative control (HaCat NC). Cultured cells in minimal essential medium with 12.5% fetal bovine serum were transfected at 60% confluency, maintained at 37°C and 5% CO2.
Construction of in vitro PSO and Cardiac Hypertrophy Cell Models
The wild-type HaCat cells (5 × 10⁵ cells/well) were stimulated with TNF-α (50ng/mL) for 24 hours. Forty-eight hours after transfection, the cells from HaCat KD and HaCat NC groups were also stimulated with TNF-α (50ng/mL) for 24 hours. In the hypertrophy cell model, wild-type AC16 cells (5 × 10⁵ cells/well) were transfected with 100pM siRNA constructs targeting the human AKT1 gene. Forty-eight hours after transfection, the cells from AC16 knockdown and AC16 negative control groups were also stimulated with Ang-II (0.1ug/mL) for 24 hours.
Construction of PSO Animal Model
Male C57BL/6 mice weighing 22–25g were obtained from Beijing Vitalstar Biotechnology Co., Ltd. The mice were allocated into two groups: control and IMQ-induced PSO, each group consisting of 3 mice. Each mouse was kept in a room with controlled temperature and humidity, following a 12-hour light and 12-hour dark cycle. All animal experiments were conducted following the guidelines provided by the Ethics Committee of Jinzhou Medical University. Mice were treated with a daily application of 5% IMQ cream on a shaved area measuring 2.0 cm × 1.0 cm for 7 days in a row to create PSO-like skin lesions and establish a PSO mouse model. Control mice received the same treatment with a cream containing Vaseline.
Western Blot
The total protein quantity from HaCat cells was determined using the bicinchoninic acid assay. Subsequently, proteins were isolated via sodium dodecyl sulfate gel and then moved to polyvinylidene fluoride membranes. The proteins on the membranes were blocked and probed with primary antibodies against rabbit anti-AKT1 (Affinity), rabbit anti-CASPASE-3 (Affinity) and rabbit anti-GAPDH (Proteintech) overnight at 4°C, followed by incubation with the secondary antibodies against HRP-labeled sheep anti-rabbit immunoglobulin (Ig) G (Proteintech) for 1 h at room temperature. Enhanced chemiluminescence (Proteintech) was employed to visualize the bands.
Histological Analysis
Skin samples were collected and preserved in 10% formalin for a day, then embedded in paraffin and cut into 5 µm sections following the standard procedure outlined earlier. Following processing, hematoxylin and eosin staining were carried out using established protocols. For immunohistochemical detection of AKT1 expression in the skin tissue, sections of skin tissue were deparaffinized, hydrated, and subjected to high-temperature antigen retrieval; primary antibodies were then applied to the samples and incubated at 37°C for one hour. Subsequently, secondary antibodies were added and incubated at room temperature for 20 minutes.
Flow Cytometry
1×10⁵ cells were collected from two distinct groups and rinsed with PBS twice. Annexin V-FITC/PI (dilution ratio 1:200) was then added at room temperature for 1 h, and the percentage and type of dead cells in each group were quantified using flow cytometry. Cells were categorized into four groups: q1 for necrotic cells, q2 for early apoptotic cells, q3 for late apoptotic cells, and q4 for viable cells. Each cell was individually sorted and examined using a flow cytometer, with data processing performed using Flow Jo software.
Statistical Analysis
The data analyses were conducted using R software version 4.3.0. Student’s t-test was used for normally distributed variables, while the Wilcoxon rank-sum test was utilized for non-normally distributed variables in pairwise comparisons. A significance level of P < 0.05 was adopted to determine statistical significance.
Results
MR Analysis of Ventricular Septal Thickness and PSO
The results of the Mendelian randomization analysis are presented in Figure 1. The IVW results demonstrated that PSO was a risk factor for ventricular septal thickness (OR value: 1.034, P-value < 0.05); the MR Egger results also revealed that PSO was a risk factor for ventricular septal thickness (OR value: 1.067, P-value < 0.05). Furthermore, the results of Leave one out sensitivity and the effect size of each SNP show that the causal relationship between PSO and ventricular septal thickness is not affected by individual SNPs.
 |
Figure 1 Mendelian Randomization sensitivity and heterogeneity analysis of SNP effects on interventricular septum thickness. (A) To determine whether a single SNP is disproportionately influencing a connection, leave-one-out sensitivity analysis is carried out. The MR analysis that excludes a specific SNP is represented by each black spot in the forest plot. (B) A forest plot is used to show the estimated causal effect of exposure on outcome, which is based on the Wald ratio for each SNP separately. (C) Plotting SNP effects on the exposure versus SNP impacts on the outcome. (D) To evaluate heterogeneity, use a funnel plot. |
The Functional Heterogeneity and Perturbation of Pathways Existed in a Different Cohort
We quantified pathway activity in samples using the ssGSEA algorithm with reference gene sets “c2.cp.kegg.v7.4.symbols.gmt” and “c2.cp.go.v7.4.symbols.gmt” to determine perturbations in molecular pathways between LVH diseases and PSO patients. The GO enrichment analysis results indicated that LVH is associated with the regulation of voltage-gated potassium channel activity, regulation of atrial cardiac muscle cell membrane depolarization, and the apoptotic process involved in heart morphogenesis. The KEGG analysis of the LVH cohort revealed associations with olfactory transduction, linoleic acid metabolism, and adherens junction (Supplementary Figure S1A). The GO enrichment analysis results indicated that the PSO cohort is associated with the regulation of the development, contraction, and morphogenesis of cardiac muscle tissue. Furthermore, the KEGG analysis of the PSO cohort showed associations with primary bile acid biosynthesis, limonene degradation, and ascorbate and aldarate metabolism (Supplementary Figure S1B). These results suggest that PSO patients also have concurrent dysregulation of pathways related to cardiac function, which may further explain the exacerbation of myocardial injury in LVH patients on the basis of concurrent PSO.
The NETs Signature and Immune Cells of the Heart Diseases and PSO
During the transition from healthy heart muscle cells to a state of reduced function, various biological processes and immune cell types, including activated dendritic cells, plasmacytoid dendritic cells, macrophages, natural killer cells, regulatory T cells, and follicular helper T cells play a crucial role in the progression of heart diseases. Nets have been observed to impact the development of cardiovascular conditions by triggering the activation of antigen-presenting cells, T cells, and B cells, thereby inducing an inflammatory immune response. We used the ssGSEA algorithm to assess the correlation between NETs and immune cell characteristics in different heart diseases. The results indicated significant positive associations between NETs score and macrophages in the LVH and PSO patient groups, suggesting that conditions involving the heart and PSO with a high likelihood of triggering NETs also tended to have heightened immune cell activity in affected tissues (Figure 2A and B). Moreover, the findings demonstrated robust positive connections between NETs score and fibroblast, inflammation, and apoptosis in the LVH and PSO diseases group.
 |
Figure 2 Correlations between NETs score with biological response or immune cells activation. (A) Correlations between NETs score with biological response or immune cell activation in the overall disease samples. (B) Correlations between NETs score with biological response or immune cell activation in each disease type, including LVH and PSO. Hypertrophy: The LVH cohort (GSE74144). PSO: The psoriasis cohort (GSE141804). |
Single-Cell Sequencing Analysis Shows That NETs are Upregulated in LVH
As shown in Figure 3A, after grouping and annotation of mouse myocardial samples, a total of 11 distinct cell types were identified, including granulocytes, smooth muscle cells (SMC), fibroblasts, macrophages, B cells, Schwann cells, pericytes, endothelial cells, mesothelial cell, memory T and heart muscle cells, with the vast majority of non-parenchymal cell subpopulations occupying a significant proportion. Through cellchart software analysis, the results revealed extensive intercellular interactions between myocardial cells and non-parenchymal cells following the occurrence of myocardial hypertrophy lesions (Figure 3B); Among them, myocardial cells exhibited the strongest interaction with granulocytes and macrophages (Figure 3C). Furthermore, as depicted in Figure 3D, cardiomyocytes establish a connection with granulocytes through Col1a1-Cd44 and Col1a2-Cd44 ligand-receptor pairs. To assess the activity of NETs at the single-cell level after LVH, we used the mean algorithm to calculate the NETs activity for each individual cell. The mean algorithm results revealed that NETs exhibited heterogeneity in different cell types, with granulocytes showing the highest aggregation activity, followed by macrophages (Figure 3E). After inducing myocardial hypertrophy, the activity score of NETs in mouse heart tissue was significantly upregulated (Figure 3F). These findings underscore the crucial role of NETs in the progression and evolution of myocardial hypertrophy, as well as the extensive interaction between myocardial cells and immune cells, particularly granulocytes and macrophages after LVH occurs.
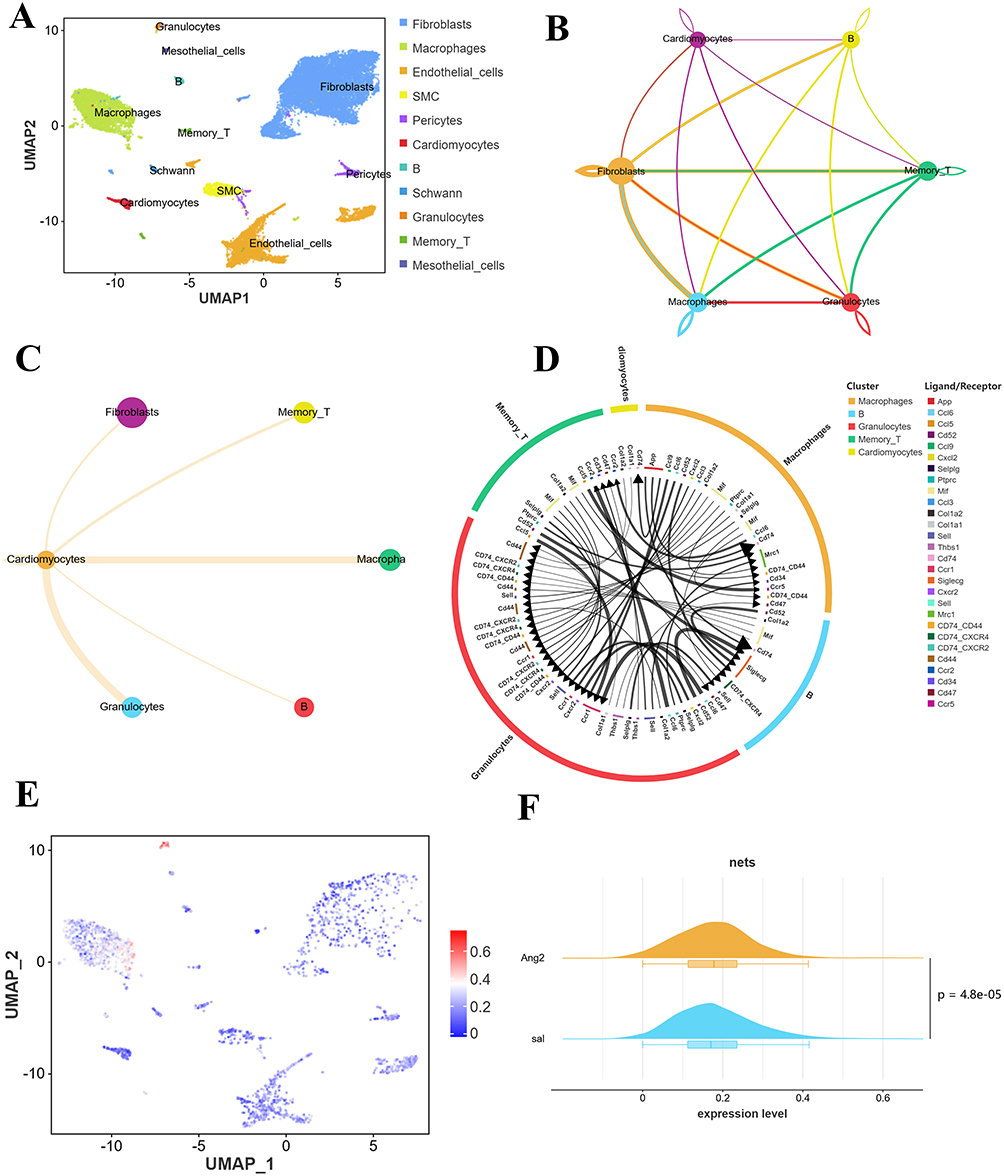 |
Figure 3 Single-cell analysis of cell subpopulations, interactions, and NETs activity in LVH samples. (A) UMAP plot presents the annotation results of cell subpopulations (B) The interaction relationship between cells after LVH. The thickness of the line segment reflects the number of receptor pairs. (C) Cell communication analysis between myocardial cells and other cells. (D) Specific ligand receptor pairs between different cell types in LVH samples. (E) The UMAP plot presents the distribution of NETs in different cell types. (F) The mountain chart presents a comparison of differences in NETs activity between two groups. |
NETs-Related Molecular Clusters Genetic Signature in LVH and PSO
Patients were classified into distinct groups according to the NETs-related molecular signature using the ConsensusClusterPlus R package. The optimal number of clusters was determined by analyzing the cumulative distribution function (CDF) and comparing it with the area curve. With a cluster number of 2, a consistent clustering outcome was observed in LVH (Figure 4A and B) and PSO cohort (Figure 5A and B), leading us to select k=2 for the identification of two unique NETs clusters (C1 and C2) in LVH and PSO cohort, respectively. We analyzed the differences in NETs expression across these subtypes. The results demonstrated that C2 patients exhibited higher expression levels of NETs-related molecular clusters genetic signature in LVH, including BST1, CD93, CSF3R, FPR2 and CXCR2 than C1 patients (Figure 4C); Additionally, it was also showed that C2 cluster had elevated NETs-related molecular clusters genetic signature in PSO, including CPPED1, S100A12, KCNJ15, G0S2 and MGAM (Figure 5C). The immune landscape atlas showed variations in the abundance of various immune cells among distinct patient subtypes from LVH (Figure 4E) and PSO (Figure 5E) cohorts.
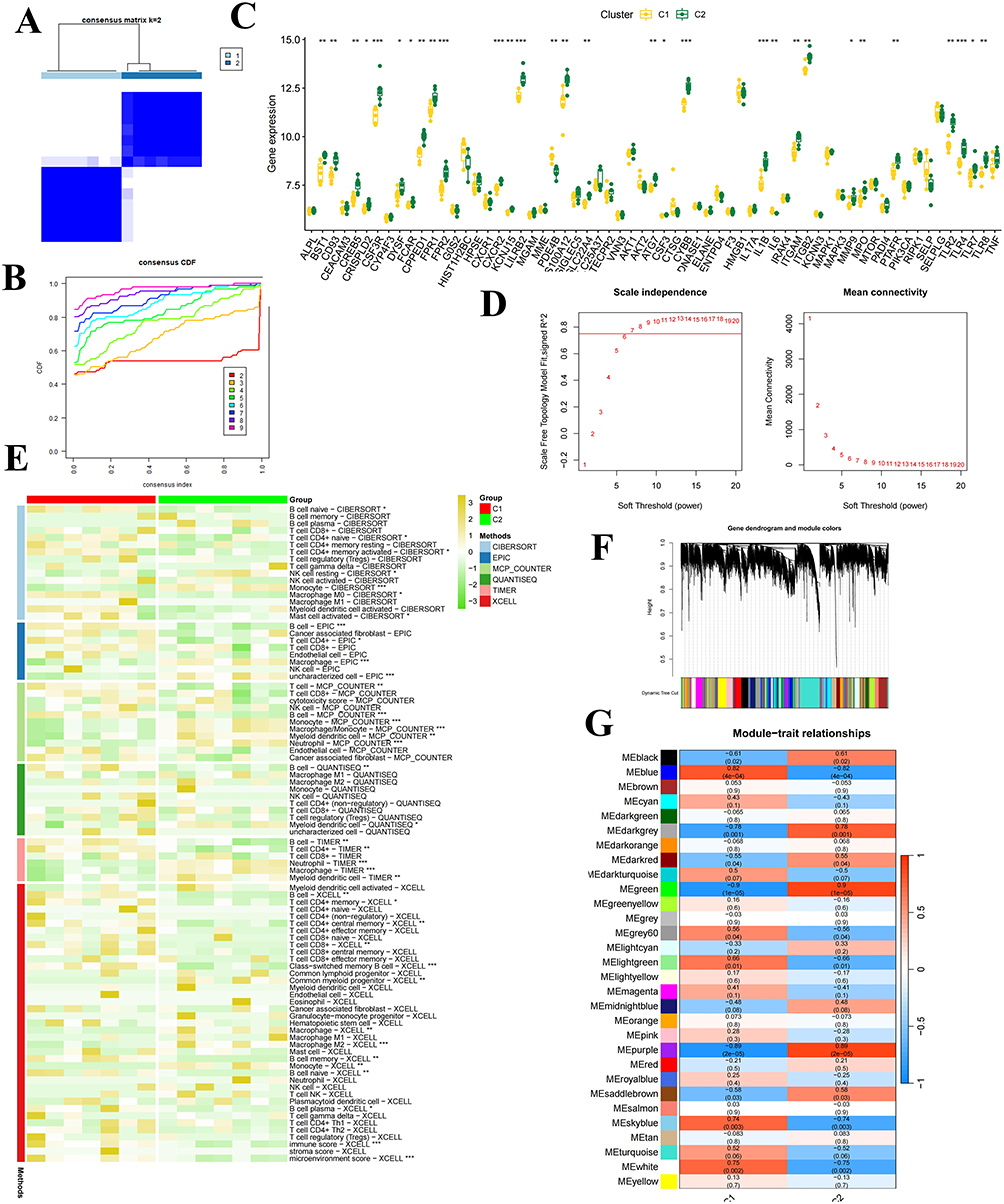 |
Figure 4 Identification of molecular subtypes and construction of Weighted Gene Co-expression Networks in LVH cohort. (A) Clustering heatmap when consensus k=2. (B) CDF curve and CDF delta area curve in LVH cohort. (C) Differences in the expression of NET-related genetic signature in C1 and C2. ***: P < 0.001, **: P < 0.01, *: P < 0.05. (D) Schematic representation of a scale-free index (left) and mean connectivity (right) under different soft-threshold powers. (E) Heatmap illustrates comprehensive immune cell composition profiling by combining six algorithms between C1 and C2 clusters from LVH patients. (F) Cluster dendrogram demonstrating co-expression developed by average linkage hierarchical clustering and dynamic hierarchical cut. (G) The heatmap of modules-trait relationship. |
 |
Figure 5 Identification of molecular subtypes and construction of Weighted Gene Co-expression Networks in PSO cohort. (A) Clustering heatmap when consensus k=2. (B) CDF curve and CDF delta area curve in PSO cohort. (C) Differences in the expression of NET-related genetic signature in C1 and C2. **: P < 0.01, *: P < 0.05. (D) Schematic representation of a scale-free index (left) and mean connectivity (right) under different soft-threshold powers. (E) Heatmap illustrates comprehensive immune cell composition profiling by combining six algorithms between C1 and C2 clusters from LVH patients. (F) Cluster dendrogram demonstrating co-expression developed by average linkage hierarchical clustering and dynamic hierarchical cut. (G) The heatmap of modules-trait relationship. |
Identification of Molecular Subtypes and Construction of WGCNA
In order to accurately identify the shared molecular changes related to NETs in PSO and LVH, we used WGCNA analysis to extract the genes that interact with NETs in both LVH and PSO. A soft threshold of 20 was applied to ensure a scale-free network topology, resulting in an R2 value of 0.85 and average connectivity (Figures 4D and 5D). By utilizing gene correlation, a dendrogram was constructed for hierarchical clustering of genes, revealing nine gene modules exhibiting similarities (Figures 4F and 5F). Subsequently, we ultimately pinpointed the module with a P-value less than 0.05, which includes 5117 genes in LVH (Figure 4G), compared to 1293 genes found in PSO (Figure 5G).
To explore the co-pathogenesis of LVH and PSO, we conducted the intersection of the genes screened by WGCNA, which identified a total of 499 overlapping genes (Figure 6A). We sought to investigate the potential biological changes between LVH and PSO. GO analysis of the intersected genes revealed these genes were linked to calcium homeostasis and mitochondria (Figure 6B). Besides, KEGG enrichment results were linked to neutrophil extracellular trap formation and several immune pathways (Figure 6C).
 |
Figure 6 The NET-related pathway perturbation linking PSO and LVH patients. (A) Venn diagram of the intersection of modules genes from LVH WGCNA and modules genes from PSO WGCNA. (B) The GO signaling pathways of intersection genes. (C) The KEGG signaling pathways of intersection genes. (D) The neutrophils-related disturbed pathways between LVH samples and control samples from the LVH cohort. (E) The neutrophils-related disturbed pathways between PSO samples and control samples from the PSO cohort. (E) The neutrophils-related disturbed pathways between PSO samples and control samples from the PSO cohort. |
The Disturbed Neutrophils-Related Pathways and NETs Activities Existed in Different Cohorts
The process of NETs is formed by neutrophils. To determine whether the mechanism underlying the studied cohort was indeed implicated in the NETs, we focused on the functional heterogeneity of the neutrophils-related pathways and NETs activities that existed among the studied cohorts by quantifying the activity of a pathway in a sample using ssGSEA.
As expected, Figure 6D and E showed that most abnormal pathways were notably increased in the disease groups across various cohorts. In the LVH cohort, the disease groups exhibited higher scores for neutrophil degranulation and neutrophil activation related to immune response, while the regulation of neutrophil-mediated cytotoxicity displayed a contrasting trend (Figure 6D). The score for negative regulation of neutrophil migration was higher in the disease groups in the PSO cohort (Figure 6E). These findings suggested that neutrophils and NETs were crucial in the development of LVH and PSO diseases.
AKT1 and RIPK1 Presented Aberrant Gene Expression Among Different Cohorts
To screen for characteristic NETs regulators, the NETs genes were initially screened by multiple kinds machine learning of prediction models. The AUC value of each model across LVH and PSO datasets was calculated, revealing that the RF+SVM combination was identified as the optimal model with the highest average AUC value (Figure 7A). Subsequently, a total of 11 characteristic genes were screened from PBMCs RNA sequencing in PSO and LVH cohorts by SVM+RF machine learning. From the resulting 11 characteristic genes, AKT1 and RIPK1 presented aberrant gene expression among both LVH and PSO cohorts (Figure 7B). Notably, of these cohorts, AKT1 and RIPK1 showed significantly up-regulated in both PSO and LVH groups compared with the corresponding healthy samples.
 |
Figure 7 The feature genes screening and the correlation between the level of RIPK1 and AKT1 expression and functional pathways in LVH and PSO cohorts. (A) Multiple machine learning models generate candidate feature genes from the NETs gene set. (B) Histogram exhibits the the expression difference of the candidate feature genes in LVH and PSO samples. Red and blue colors represent up-regulated and down-regulated NETs signatures, respectively. (C) Correlation between the proportion of immune cell infiltration and the level of RIPK1 expression based on CIBERSORT analysis. * P < 0.05, ** P < 0.01. (D) Correlation between the proportion of immune cell infiltration and the level of AKT1 expression based on CIBERSORT analysis. * P < 0.05, ** P < 0.01. (E) Correlation between the level of RIPK1 expression and NET-related pathways, (The results of P < 0.05). (F) Correlation between the level of RIPK1 expression and metabolism pathways, (The results of P < 0.05). |
AKT1 and RIPK1 Presented Multiple Associations with Immune Cells Among Different Disease Cohorts
CIBERSORT findings indicated a positive association between CD8+ T cells and activated NK cells with RIPK1 gene expression in PSO samples, as illustrated in Figure 7E, while a negative correlation was observed between regulatory helper T cells in LVH samples, as depicted in Figure 7C. Furthermore, negative correlations were found between the proportion of M0 macrophages, memory-resting CD4+ T cells, and activated dendritic cells, and the expression level of the AKT1 gene in LVH samples (Figure 7D).
Functional Analysis and Its Correlation with AKT1 Among Overall Cohort
In the PSO cohort, significantly studied immune and metabolism pathways had negatively small to moderate correlations with RIPK1 (Figure 7E and F); conversely, AKT1 exhibited significant positive correlations with most of the studied immune and metabolism pathways in the LVH cohort (Figure 8A and B). Furthermore, in the PSO cohort, AKT1 showed only weak correlations with a few of the studied pathways (Figure 8A). Notably, a positive association was found between AKT1 expression and ssGSEA scores of glycerophospholipid metabolism in the LVH and PSO cohorts in the interpretation of associations among AKT1 and pathway co-involvement in various cohorts (Figure 8B).
 |
Figure 8 The correlation between the level of AKT1 and RIPK1 expression and functional pathways and immunomodulators in LVH and PSO cohorts. (A) Correlation between the level of AKT1 expression and NET-related pathways, (The results of P < 0.05). (B) Correlation between the level of AKT1 expression and metabolism pathways, (The results of P < 0.05). (C) Correlation between the level of RIPK1 expression and immunoinhibitors, (The results of P < 0.05). (D) Correlation between the level of RIPK1 expression and immunostimulators, (The results of P < 0.05). (E) Correlation between the level of AKT1 expression and immunoinhibitors, (The results of P < 0.05). (F) Correlation between the level of AKT1 expression and immunostimulators, (The results of P < 0.05). |
AKT1 and RIPK1 Might Have Synergistic or Antagonist Effects with Immunomodulators
As anticipated in Figure 8C and D, RIPK1 was positively correlated with TNFSF18 and CD86, while RIPK1 was negatively correlated with TNFRSF18 and IL6 in LVH samples. As for PSO samples, RIPK1 exhibited a positive correlation with TGFB1, LAG3, TNFRSF8 and CD70; conversely, it displayed a negative correlation with TNFSF.
As anticipated in Figure 8E and F, AKT1 was positively correlated with HAVCR2, TNFSF13 and C10orf54, while AKT1 was negatively correlated with CD96, BTLA, CD28, TNFRSF25 and TNFSF4 in LVH samples. As for PSO samples, AKT1 was strongly positive correlated with LGALS9 and CSF1R, while AKT1 was negatively correlated with CD160 (Figure 8E).
AKT1 and RIPK1 Expression Pattern Presented a Nomogram and an MLP Neutral Model
The nomogram was generated after combining the AKT1 and RIPK1 expression patterns for quantitatively predicting the risk of LVH occurrence in patients (Figure 9A). The calibration and DCA curves plots demonstrated a remarked agreement between predicted and actual outcomes (Figure 9B and C). In addition, we constructed a neural network model related to MLP to determine the occurrence of LVH, which can alleviate the tedious process of clinical doctors in diagnosing LVH disease to a certain extent. The MLP model structure we designed comprises an input layer, several hidden layers, and an output layer. The input layer is responsible for receiving the feature data of AKT1 and RIPK1, and after nonlinear transformations in multiple hidden layers, the output layer provides the final classification results such as LVH or normal. Each layer is connected through fully connected layers, and the Rectified Linear Unit activation function is used to enable the model to handle nonlinear relationships (Figure 9D). From the reverse cumulative distribution graph, it can be observed that most samples exhibit small residuals, indicating that the model can fit the data well in most cases. The samples with residuals below 0.3 account for about 90% of the total, indicating that the deviation between the predicted results and the actual results is small, and the model fitting effect is good (Figure 9E) Herin, Notably, the importance of feature genes “RIPK1” and “AKT1” in the output of the model is 0.343906 and 0.233345, respectively. This indicates that these features play a crucial role in predicting the target variable (Figure 9F).
 |
Figure 9 Construction and validation of the LVH diseases diagnostic model. (A) Nomogram are used to predict the risk of LVH. (B) Curve of calibration to assess the clinical value of the nomogram. (C) DCA curves to assess the clinical value of the nomogram. (D) Schematic diagram of MLP neural network structure (E) Reverse cumulative distribution map (F) Importance map of characteristic genes. |
Resveratrol Targeted on RIPK1 and AKT1 and Molecular Docking Landscape
According to the results presented in Supplementary Table S1, RIPK1 and AKT1 proteins could be targeted by resveratrol. Molecular docking is an important method for structure-based drug design and screening by finding the optimal conformation of small molecule compounds interacting with target molecules. The binding poses and sites of resveratrol and RIPK1 are shown (Figure 10A and B), and the docking score was −6.185 kcal/mol, which suggests a favorable binding affinity of resveratrol with RIPK1. As for AKT1, the binding poses and sites are shown (Figure 10C and D), resveratrol binds to the AKT1 protein target through visible hydrogen bonding and strong electrostatic interactions, and the docking score was −7.262 kcal/mol, which exhibited an excellent binding. Furthermore, the molecular docking landscape was also validated with CB DOCK2 software (Figure S2 and Supplementary Table S2). These findings suggest that resveratrol can be used as a potential treatment for LVH patients with PSO. However, given the limitations of molecular docking, such as reliance on protein structure accuracy and lack of experimental validation, these findings should be interpreted cautiously. Further in vitro and functional studies are needed to confirm these results, which we plan to explore in a follow-up study.
 |
Figure 10 Crystal structures and interaction site analysis of resveratrol with RIPK1 and AKT1. (A) The crystal structure of small molecule compounds and the overlapping molecular characteristics of their targets exhibit a binding mode between resveratrol and RIPK1. (B) The interaction site relationship between resveratrol and RIPK1 target, with dashed lines representing the surrounding forces. (C) The crystal structure of small molecule compounds and the overlapping molecular characteristics of their targets exhibit a binding mode between resveratrol and AKT1. (D) The interaction site relationship between resveratrol and AKT1 target, with dashed lines representing the surrounding forces. |
AKT1 Knockdown Affected the Expression of Caspase-3 and MYH7 in PSO and Hypertrophy Cell Models
To further assess the effect of AKT1, synthetic siRNA or siRNA controls were used to stimulate HaCat and AC16 cells for 48 h. The protein level of AKT1 was significantly reduced by WB analysis (Figure 11A). The results in Figure 11B indicate that Caspase-3 production, which was induced by TNF-α, is obviously reversed by AKT1 siRNA, while the results in Figure 11C indicate that MYH7 expression, which is inhibited by Ang-II, is downregulated by AKT1 siRNA. The expression of AKT1 under TNF-α treatment was elevated than that in the controlled group (Figure 11D), which was consistent with the result of bioinformatics. As anticipated in Figure 11E, AKT1 knockdown reduced the induced hypertrophy (Relative surface area size of cells) in AC16 cell lines, confirming that AKT1 is involved in the mechanism of cardiomyocyte hypertrophy. Notably, Figure 11F exhibited a notable decrease in the percentage of apoptotic cells in the Hacat knockdown group compared to the control group, with statistical significance (P < 0.05).
 |
Figure 11 AKT1 knockdown attenuates hypertrophic phenotype in LVH-induced cell lines and reduces apoptosis in PSO models. (A) siRNA transfection (20 nM for 48 h) inhibited the AKT1 expression in HaCat and AC16 by Western blot analysis. (B) Western blot analysis of Caspase-3 expression after siRNA transfection (20 nM for 48 h) in PSO cell model. (C) Western blot analysis of MHY-7 expression after siRNA transfection (20 nM for 48 h) in LVH cell model. (D) Western blot analysis confirmed the up-expression AKT1 in PSO cell model. (E) Fluorescence staining analysis of cardiomyocyte hypertrophy induced by Ang-II following AKT1 knockout. (F) Flow cytometry detection of HaCat cell apoptosis before and after the intervention of AKT1 expression. Data are presented as the mean ± SD. n = 3. *P < 0.05. (G) PSO-like skin lesions induced by imiquimod (bottom). (H) Representative images of H&E staining and baker score showing the skin tissue pathology of NC (top) and IMQ-induced PSO mouse (bottom). (I) Representative images of immunohistochemical staining showing a markedly increased level of AKT1 in the skin of IMQ-induced PSO mouse (bottom) compared with control mouse (top). |
AKT1 Is Upregulated in IMQ-Induced PSO Mouse Model
To confirm the pathological observations of patients with PSO, we established a PSO-like mice model by topically applying imiquimod (IMQ) to the skin on the back of C57BL mice for 7 consecutive days (Figure 11G). As depicted in Figure 11I. In IMQ-treated mice (bottom), symptoms of erythema, scaling, and skin thickening developed, while Control mice (top) did not manifest these symptoms. After 7 days of IMQ treatment, the H&E staining revealed a significant rise in epidermal thickness and mononuclear cell infiltration (Figure 11H, bottom). Subsequently, we analyzed the levels of AKT1 in skin biopsy samples from mice. In comparison to the control group (Figure 11I, top), immunohistochemistry staining revealed a high expression of AKT1 in the skin lesions of the PSO mouse model induced by IMQ (Figure 11I, bottom).
Discussion
Concurrent PSO illness has been demonstrated to exacerbate the manifestations and symptoms of severe or even fatal cardiac injuries.19 Moreover, patients with pre-existing cardiovascular conditions exhibit poorer outcomes following PSO development. However, the molecular pathways shared between PSO and LVH disorders remain poorly understood. For the first time, we combined the transcriptomes from the public database in our analysis to identify putative genes that interact between PSO and LVH. The study’s functional enrichment analysis revealed that metabolic abnormalities, immunological activation associated with neutrophils, and inflammatory response were key features of both PSO and LVH disorders. The presence of LVH injury in PSO patients may be reflected in the enrichment of phrases connected to the heart, such as cardiac muscle cell contraction and cardiac muscle tissue regeneration.
Furthermore, the only source of molecular subgroups that can be identified is a patient’s transcriptome, which utilizes consensus clustering to map to various clinical symptoms. A growing body of research has demonstrated that the variability of disease molecules significantly impacts therapy response, clinical outcome, and local cellular function. Our pathway enrichment analysis revealed associations between the diverse immune response, calcium-mediated pathway preferences, and NET-related PSO and LVH clusters. The subsequent section provides further elaboration on representative elements of the interactions between PSO and LVH disorders highlighted by this study. In addition to its crucial role in maintaining cellular homeostasis, aberrant mitochondrial metabolism has also been implicated in various cardiovascular disorders.20 Under healthy conditions, the primary means of ATP synthesis for cardiomyocytes is fatty acid-driven oxidative phosphorylation. However, the presence of cardiomyocytes is associated with ATP depletion and elevated reactive oxygen species, which may directly compromise cardiac function in a number of cardiomyopathies.21 Since both cardiac and arterial contraction depend on transient changes in cellular calcium concentration, calcium flux plays a critical role in both cardiomyocytes and vascular smooth muscle cells. Inflammatory cytokines, such as TNF-α, which mediate chronic inflammation in psoriasis, impede calcium influx into cardiomyocytes.22 Alterations in intracellular calcium balance trigger an inflammatory response leading to a cytokine storm and tissue damage. Widespread and irreversible mitochondrial dysfunction, resulting in altered mitochondrial membrane permeability, plays a pivotal role in mitochondrial-mediated cell death that ultimately exacerbates cardiomyocyte damage. These findings may reflect the NET-related coherence damage of LVH injury in PSO patients, suggesting that patients with both LVH and PSO lesions could benefit from treatment targeting these pathways.
NETs have the capacity to inhibit inflammatory responses induced by vascular endothelial cells and promote endothelium death and angiogenesis.23,24 We discovered that fibroblast activation, apoptosis, and inflammation are synchronized with the creation of neural epithelial cells (NETs) by the assessment of the activity of biological pathways connected to disease. Previous research demonstrated that neutrophils stimulated by angiopoietin-2 produced an elevated quantity of NETs compared to their resting state. Consequently, this resulted in patients being able to coagulate more easily, increased the risk of vascular microthrombosis, and caused cardiac damage such as cardiac fibrosis and cardiomyocyte apoptosis.25 The coherence between our study’s disease-related biological pathways score and NETs score may help to explain these results.
Furthermore, AKT1 and RIRK1, the NET-related DEGs linked to the shared pathophysiology of PSO and LVH diseases that were found in this work to explain the crosstalk, were all increased in both illnesses. A particular serine/threonine protein kinase involved in numerous biological processes is encoded by the gene AKT1. According to our data, AKT1 in PSO was substantially positive with LGALS9. Notably, according to a study by Chagan-Yasutan et al, psoriasis patients had considerably higher protein levels of LGALS9, and LAGLS9 expression may have an impact on the disease state of psoriasis.26 Furthermore, it has been documented that the activated endothelium releases the LAGLS9 protein, which acts as a soluble molecule immobilizing neutrophils and contributing to leukocyte recruitment in various inflammatory contexts.27 Additionally, our findings demonstrate that AKT1 knockdown inhibited PSO cell apoptosis and cardiac hypertrophy, supporting the possible involvement of the shared genes we found in the pathophysiology of LVH and PSO disorders.
RIRK1, a member of the receptor-interacting serine/threonine-protein kinase family, has emerged as a pivotal regulator of apoptosis, inflammation and necroptosis pathways. Previous studies have reported thatRIPK1 downregulation enhances neutrophil extracellular traps in psoriasis and shows significant upregulation and localization in all layers of the epidermis in psoriatic lesions.25,28 Our results were consistent with previously published studies. Additionally, previous research reported that adoptive Tregs transfer resulted in a marked reduction in cardiac CD4+, CD8+, and CD69+ cells and macrophages infiltration and attenuate inflammation, to ameliorate Ang II–induced cardiac damage.28,29 Our analysis revealed a negative correlation between RIPK1 and Tregs, suggesting that RIPK1 may play a role in regulating the transfer of Tregs to mediate LVH-associated cardiac injury. Furthermore, previous studies have demonstrated that all-trans retinoic acid can prevent development of heart remodeling in aortic banded rats by inhibiting the renin-angiotensin system, suppressing Ang II- and mechanical stretch-induced reactive oxygen species generation and reducing cardiomyocyte apoptosis.30 The retinoic acid route and RIPK1 are linked, which implies that RIPK1 may interact with the pathway to influence the fate of cardiomyocytes. Regarding the RIPK1 connection to PSO, intra-epidermal CD8+ T cells are considered highly pathogenic due to their pathological interaction with keratinocytes, particularly in the epidermis, and because the accumulation of epidermal T cells coincides with the rise in proliferating keratinocytes in vivo.31 The results of our investigation showed a negative correlation between RIPK1 and CD8+ T cells in PSO, which may mean that RIPK1’s targeting of CD8+ T cells contribute to the advancement of PSO. Furthermore, RIPK1/RIPK3/MLKL-mediated suppression of keratinocyte necroptosis protects against psoriatic inflammation, and RIPK1 expression is markedly increased and localized in all levels of the epidermis in psoriatic lesions.32 Our findings are consistent with previous research. Previous research has shown that TGFβ1 overexpression produced or attracted numerous molecules involved in the pathogenesis of psoriasis, and that TGFβ1 overexpression combined with ensuing molecular alterations results in an inflammation of the skin that resembles psoriasis.33 Here, our study discovered that in PSO, RIPK1 and TGFB1 had a high positive association.
By utilizing AKT1 and RIRK1 as molecular crosstalk biomarkers, a simple and non-invasive nomogram model was developed to reliably predict the risk of LVH and PSO incidence, respectively. While echocardiography exclusively focuses on LVH diagnosis without addressing risk assessment and prediction, our nomograms and MLP model can be highly valuable when combined with clinical parameters at the microscopic level. Although our model needs more validation in a broader and more diverse group of patients with LVH and PSO, it still has significant implications for early risk warning prior to disease development.
Conclusion
In conclusion, this work is crucial for understanding the molecular interactions between PSO and LVH disorders, elucidating the mechanisms underlying cardiac damage caused by PSO, and identifying the factors influencing prognosis deterioration in LVH patients with a history of PSO disease. However, due to constraints on the data and sample, there are several limitations associated with this study. Specifically-sequencing data were only obtained from patients diagnosed with either PSO or LVH alone rather than those presenting both illnesses. Furthermore, in order to verify the expression of crucial genes, we were unable to get cardiac tissue samples from patients suffering with LVH and PSO illnesses. Owing to these limitations, further data on patients with cardiac injury connected to patients with pre-existing PSO disease must be gathered, and the connection between PSO-related inflammation and the future development of cardiac involvement must be investigated. To ascertain its potential implications, additional research on the predictive nomogram and MLP in a broader patient group is required.
Abbreviations
PSO, Psoriasis; LVH, Left ventricular hypertrophy; NETs, Neutrophil extracellular traps; DEGs, Differentially expressed genes; ME, Module eigengene; MM, Module membership; WGCNA, Weighted correlation network analysis.
Data Sharing Statement
The corresponding author can provide the datasets used and analyzed in the current study upon reasonable request. The information backing the findings of the present research can be found on the Gene Expression Omnibus platforms.
Ethics Statement
Animal study procedures were followed by the National Institutes of Health Guide for Care and Use of Laboratory Animals and approved by the Medical Ethics Committee of Jinzhou Medical University.
Author Contributions
All authors contributed to data analysis, drafting or revising the article, have agreed on the journal to which the article will be submitted, gave final approval of the version to be published, and agree to be accountable for all aspects of the work.
Funding
This study was financially supported by grants from: 1. The Project of Changzhou Science and Technology (CJ20220220, QN202238); 2. The Geriatric Project of Jiangsu Health Commission (LKM2023036); and 3. The “14th Five-Year Plan” High-Level Talents Training Project of Changzhou Health Commission (2024CZBJ021).
Disclosure
The authors declare that the research was conducted in the absence of any commercial or financial relationships that could be construed as a potential conflict of interest.
References
1. Nwabuo CC, Vasan RS. Pathophysiology of hypertensive heart disease: beyond left ventricular hypertrophy. Curr Hypertens Rep. 2020;22(2):11. doi:10.1007/s11906-020-1017-9
2. Herster F, Bittner Z, Archer NK, et al. Neutrophil extracellular trap-associated RNA and LL37 enable self-amplifying inflammation in psoriasis. Nat Commun. 2020;11(1):105. doi:10.1038/s41467-019-13756-4
3. Weber B, Merola JF, Husni ME, Di Carli M, Berger JS, Garshick MS. Psoriasis and cardiovascular disease: novel mechanisms and evolving therapeutics. Curr Atheroscler Rep. 2021;23(11):67. doi:10.1007/s11883-021-00963-y
4. McDonald CJ, Calabresi P. Psoriasis and occlusive vascular disease. Br J Dermatol. 1978;99(5):469–475. doi:10.1111/j.1365-2133.1978.tb02012.x
5. Gong X, Wang W. Profiles of innate immune cell infiltration and related core genes in psoriasis. Biomed Res Int. 2021;2021:6656622. doi:10.1155/2021/6656622
6. Zhang Y, Guo L, Dai Q, et al. A signature for pan-cancer prognosis based on neutrophil extracellular traps. J Immunother Cancer. 2022;10(6):e004210. doi:10.1136/jitc-2021-004210
7. Lee KH, Kronbichler A, Park DD, et al. Neutrophil extracellular traps (NETs) in autoimmune diseases: a comprehensive review. Autoimmun Rev. 2017;16(11):1160–1173. doi:10.1016/j.autrev.2017.09.012
8. Shao S, Fang H, Dang E, et al. Neutrophil extracellular traps promote inflammatory responses in psoriasis via activating epidermal TLR4/IL-36R crosstalk. Front Immunol. 2019;10:746. doi:10.3389/fimmu.2019.00746
9. Tian Y, Shi XQ, Shui JW, et al. Exploring the causal factor effects of hypothyroidism on ischemic stroke: a two-sample Mendelian randomization study. Front Neurol. 2024;15:1322472.
10. Sarkans U, Gostev M, Athar A, et al. The BioStudies database—one stop shop for all data supporting a life sciences study. Nucleic Acids Res. 2018;46(D1):D1266–D70. doi:10.1093/nar/gkx965
11. McLellan MA, Skelly DA, Dona MSI, et al. High-resolution transcriptomic profiling of the heart during chronic stress reveals cellular drivers of cardiac fibrosis and hypertrophy. Circulation. 2020;142(15):1448–1463. doi:10.1161/CIRCULATIONAHA.119.045115
12. Aran D, Hu Z, Butte AJ. xCell: digitally portraying the tissue cellular heterogeneity landscape. Genome Biol. 2017;18(1):220. doi:10.1186/s13059-017-1349-1
13. Li B, Severson E, Pignon JC, et al. Comprehensive analyses of tumor immunity: implications for cancer immunotherapy. Genome Biol. 2016;17(1):174. doi:10.1186/s13059-016-1028-7
14. Finotello F, Mayer C, Plattner C, et al. Molecular and pharmacological modulators of the tumor immune contexture revealed by deconvolution of RNA-seq data. Genome Med. 2019;11(1):34. doi:10.1186/s13073-019-0638-6
15. Becht E, Giraldo NA, Lacroix L, et al. Erratum to: estimating the population abundance of tissue-infiltrating immune and stromal cell populations using gene expression. Genome Biol. 2016;17(1):249. doi:10.1186/s13059-016-1113-y
16. Racle J, de Jonge K, Baumgaertner P, Speiser DE, Gfeller D. Simultaneous enumeration of cancer and immune cell types from bulk tumor gene expression data. Elife. 2017;6:e26476.
17. Newman AM, Liu CL, Green MR, et al. Robust enumeration of cell subsets from tissue expression profiles. Nat Methods. 2015;12(5):453–457. doi:10.1038/nmeth.3337
18. Morris GM, Huey R, Olson AJ. Using AutoDock for ligand-receptor docking. Curr Protoc Bioinformatics. 2008;24:8–14. doi:10.1002/0471250953.bi0814s24
19. Orlando G, Molon B, Viola A, Alaibac M, Angioni R, Piaserico S. Psoriasis and cardiovascular diseases: an immune-mediated cross talk? Front Immunol. 2022;13:868277. doi:10.3389/fimmu.2022.868277
20. Bonora M, Wieckowski MR, Sinclair DA, Kroemer G, Pinton P, Galluzzi L. Targeting mitochondria for cardiovascular disorders: therapeutic potential and obstacles. Nat Rev Cardiol. 2019;16(1):33–55. doi:10.1038/s41569-018-0074-0
21. Schulze PC, Drosatos K, Goldberg IJ. Lipid use and misuse by the heart. Circ Res. 2016;118(11):1736–1751. doi:10.1161/CIRCRESAHA.116.306842
22. Gawałko M, Balsam P, Lodziński P, et al. Cardiac arrhythmias in autoimmune diseases. Circ J. 2020;84(5):685–694. doi:10.1253/circj.CJ-19-0705
23. Döring Y, Soehnlein O, Weber C. Neutrophil extracellular traps in atherosclerosis and atherothrombosis. Circ Res. 2017;120(4):736–743. doi:10.1161/CIRCRESAHA.116.309692
24. Aldabbous L, Abdul-Salam V, McKinnon T, et al. Neutrophil extracellular traps promote angiogenesis: evidence from vascular pathology in pulmonary hypertension. Arterioscler Thromb Vasc Biol. 2016;36(10):2078–2087. doi:10.1161/ATVBAHA.116.307634
25. Li B, Liu Y, Hu T, et al. Neutrophil extracellular traps enhance procoagulant activity in patients with oral squamous cell carcinoma. J Cancer Res Clin Oncol. 2019;145(7):1695–1707. doi:10.1007/s00432-019-02922-2
26. Chagan-Yasutan H, He N, Arlud S, Fang J, Hattori T. The elevation of plasma galectin-9 levels in patients with psoriasis and its associations with inflammatory and immune checkpoint molecules in skin tissues. Hum Immunol. 2024;85(1):110741. doi:10.1016/j.humimm.2023.110741
27. Iqbal AJ, Krautter F, Blacksell IA, et al. Galectin-9 mediates neutrophil capture and adhesion in a CD44 and β2 integrin-dependent manner. FASEB J. 2022;36(1):e22065. doi:10.1096/fj.202100832R
28. Feng G, Bajpai G, Ma P, et al. CCL17 aggravates myocardial injury by suppressing recruitment of regulatory T cells. Circulation. 2022;145(10):765–782. doi:10.1161/CIRCULATIONAHA.121.055888
29. Kvakan H, Kleinewietfeld M, Qadri F, et al. Regulatory T cells ameliorate angiotensin II-induced cardiac damage. Circulation. 2009;119(22):2904–2912. doi:10.1161/CIRCULATIONAHA.108.832782
30. Choudhary R, Baker KM, Pan J. All-trans retinoic acid prevents angiotensin II- and mechanical stretch-induced reactive oxygen species generation and cardiomyocyte apoptosis. J Cell Physiol. 2008;215(1):172–181. doi:10.1002/jcp.21297
31. Tanaka R, Ichimura Y, Kubota N, et al. Activation of CD8 T cells accelerates anti-PD-1 antibody-induced psoriasis-like dermatitis through IL-6. Commun Biol. 2020;3(1):571. doi:10.1038/s42003-020-01308-2
32. Duan X, Liu X, Liu N, et al. Inhibition of keratinocyte necroptosis mediated by RIPK1/RIPK3/MLKL provides a protective effect against psoriatic inflammation. Cell Death Dis. 2020;11(2):134. doi:10.1038/s41419-020-2328-0
33. Li AG, Wang D, Feng XH, Wang XJ. Latent TGFbeta1 overexpression in keratinocytes results in a severe psoriasis-like skin disorder. EMBO J. 2004;23(8):1770–1781. doi:10.1038/sj.emboj.7600183
 © 2025 The Author(s). This work is published and licensed by Dove Medical Press Limited. The
full terms of this license are available at https://www.dovepress.com/terms.php
and incorporate the Creative Commons Attribution
- Non Commercial (unported, 3.0) License.
By accessing the work you hereby accept the Terms. Non-commercial uses of the work are permitted
without any further permission from Dove Medical Press Limited, provided the work is properly
attributed. For permission for commercial use of this work, please see paragraphs 4.2 and 5 of our Terms.
© 2025 The Author(s). This work is published and licensed by Dove Medical Press Limited. The
full terms of this license are available at https://www.dovepress.com/terms.php
and incorporate the Creative Commons Attribution
- Non Commercial (unported, 3.0) License.
By accessing the work you hereby accept the Terms. Non-commercial uses of the work are permitted
without any further permission from Dove Medical Press Limited, provided the work is properly
attributed. For permission for commercial use of this work, please see paragraphs 4.2 and 5 of our Terms.