")
Back to Journals » Journal of Pain Research » Volume 17
Eosinophil-to-Lymphocyte Ratio and Eosinophil Count as New Predictive Markers for Osteoarthritis
Authors Di J, Song L, Liu Y , Zhang Z, Wu Y, Chen T , Xiang C
Received 24 July 2024
Accepted for publication 13 November 2024
Published 16 November 2024 Volume 2024:17 Pages 3803—3815
DOI https://doi.org/10.2147/JPR.S480925
Checked for plagiarism Yes
Review by Single anonymous peer review
Peer reviewer comments 2
Editor who approved publication: Dr Alaa Abd-Elsayed
Jingkai Di,1,2,* Liying Song,2,3,* Yaru Liu,2,4,* Zhibo Zhang,1,2 Yawen Wu,2 Tingting Chen,2,5 Chuan Xiang1
1The Second Hospital of Shanxi Medical University, Taiyuan, People’s Republic of China; 2Shanxi Medical University, Taiyuan, People’s Republic of China; 3The First Hospital of Shanxi Medical University, Taiyuan, People’s Republic of China; 4The Third Hospital of Shanxi Medical University, Taiyuan, People’s Republic of China; 5The Fifth Hospital of Shanxi Medical University, Taiyuan, People’s Republic of China
*These authors contributed equally to this work
Correspondence: Chuan Xiang, The Second Hospital of Shanxi Medical University, Taiyuan, People’s Republic of China, Tel +86 15903410351, Email [email protected]
Purpose: Despite the association between peripheral blood inflammatory biomarkers and a range of inflammatory diseases, the role of these biomarkers in osteoarthritis (OA) progression remains unclear. Additionally, whether alterations in these inflammatory markers impact the prognosis of OA patients remains an understudied area. The aim of our study was to investigate the specific associations between peripheral blood inflammatory markers and OA progression and OA-related mortality.
Methods: Data were obtained from the National Health and Nutrition Examination Survey (NHANES) database from 1999 through 2018. The primary outcomes were all-cause mortality, cardiac mortality, and renal disease mortality, with information on the corresponding mortality rates for each participant obtained through association with the National Death Index (NDI). Multivariate logistic regression models were used to examine the relationship between peripheral blood lymphocyte counts and OA, and restricted cubic spline (RCS) analysis was utilized to assess whether there was a nonlinear relationship with OA and mortality of OA patients. Interaction and stratified analyses were employed to explore the association between peripheral blood leukocyte counts and OA.
Results: This study included 1077 OA patients and 21,612 non-OA participants. In model 3 fully adjusted for covariates, eosinophil-to-lymphocyte ratio (ELR) and eosinophil (EOS) were positive risk factors promoting the development of OA (OR = 3.26, 95% CI: 1.49– 7.14; OR = 1.79, 95% CI: 1.12– 2.88). In stratified models for age, sex, BMI, smoking status, and alcohol consumption, the associations of ELR and EOS with OA were significantly different. RCS curves showed a J-shaped relationship between ELR and EOS and all-cause mortality in patients with OA. ELR was also found to significantly up-regulate cardiac mortality and renal mortality in patients with OA (OR = 3.92, 95% CI: 1.68– 9.14; OR = 22.55, 95% CI: 6.55– 77.70), while EOS was only significantly positively correlation (OR = 3.68, 95% CI: 1.94– 7.01).
Conclusion: A significant relationship was found between ELR, EOS and OA. In addition, ELR and EOS were identified as potential predictors of mortality from different causes in patients with OA.
Keywords: eosinophil to lymphocyte ratio, osteoarthritis, eosinophil, all-cause mortality
Introduction
Osteoarthritis (OA) is a burdensome degenerative disease that can lead to irreversible progressive destruction of articular cartilage.1 It is characterized by meniscal degeneration, subchondral bone remodeling, infrapatellar fat pad fibrosis and inflammation, which severely limits the quality of life of those affected.2,3 Data from the UK OA Survey suggest that up to 8.75 million people in the population have symptomatic OA, for which there is no cure other than non-steroidal anti-inflammatory drugs to relieve symptoms.4,5 OA is a growing public health problem worldwide, affecting more than half of the population over the age of 65.6 An estimate of the burden in 2018 put the total annual cost of treating OA at $8.6 billion in Australia, $20.9 billion in the UK, and as high as $142.1 billion in the US.7 Unfortunately, OA is currently diagnosed on the basis of pain and radiographic findings, both of which are usually seen in the later stages of the disease when it is more difficult to treat.8 Therefore, the identification of new potential bioindicators or risk factors for OA is urgent and necessary.
OA is a complex chronic disease. One of the most evident reasons in the pathogenesis of osteoarthritis is frequently age, but as research has advanced, it has become clear that other moderate to severe risk factors include heredity, obesity, and pre-existing traumas.9–11 Furthermore, it has been demonstrated that inflammatory activity plays a significant role in the advancement of OA, with earlier research indicating the involvement of several inflammatory factors.12 For example, the family of inflammatory factors known as matrix metalloproteinases (MMPs) has been studied as an important player in the pathogenesis of OA.13 Furthermore, interleukin-1β (IL-1β), interleukin-6 (IL-6) and tumor necrosis factor-α (TNF-α) have been implicated in the pathophysiological process of OA.14 As a result, there is a consensus that indicators of inflammation can serve as reliable biomarkers for OA.15 However, there is a lack of cost-effective and readily available biomarkers for the pathogenesis of OA, and it is controversial whether patients with OA present with a systemic inflammatory immunophenotype.
Routine blood tests are the most readily available clinical tests in which the numbers of inflammatory cells in a wide range of peripheral blood and their ratios to each other have been found to correlate with the progression of various diseases.16,17 For instance, the neutrophil-to-lymphocyte ratio (NLR), platelet-to-lymphocyte ratio (PLR) and monocyte-to-lymphocyte ratio (MLR) have been found to correlate linearly or non-linearly with the onset of depression.18 The neutrophil-to-albumin ratio (NPAR), another peripheral blood immunocyte ratio, was reported to have a predictive value of 0.81 for the diagnosis of NAFLD.19 To the best of our knowledge, prior research has documented a correlation between peripheral inflammatory indicators and OA; however, these studies were lacking in subgroup analyses, were inadequate, and concentrated on a single marker.20,21 Furthermore, inflammatory cellular changes in peripheral blood have not gotten enough attention, although some research concentrating on different OA-related mortality.22 Therefore, after clarifying the effect of peripheral blood on the progression of OA, we further investigated the effect of peripheral blood on mortality in patients with OA. This study aimed to investigate how these blood biomarkers of inflammation are related to OA and to mortality in OA patients.
Methods
Data Source
Data from the publicly available National Health and Nutrition Examination Survey (NHANES) database between 1999 and 2018 were collected for this study (Figure 1). NHANES is designed to assess the health and nutritional status of adults and children in the United States and is conducted by the National Center for Health Statistics (NCHS). This survey collected data from a variety of sources, including interviews, medical examinations and laboratory tests. The detailed methodology can be found on the official website (http://www.cdc.gov/nchs/nhanes.htm, accessed on 2 January 2024). The data were released for research purposes, all participants signed an informed consent form, and the NCHS permitted the researchers to use the data.23 This study was deemed exempt by the review committee of the Second Hospital of Shanxi Medical University.
 |
Figure 1 The flow chart portraying participant inclusion and exclusion in the current study. |
Exclusion criteria included minors, individuals with missing blood cell data and individuals with missing education level, BMI, hypertension, diabetes, smoking and alcohol consumption. Individuals with missing activity metabolic equivalent (MET) and poverty income ratio (PIR) were also excluded. We also omitted people with other types of arthritis and those who did not respond to the questionnaire. The flowchart of the above process is presented in Figure 1.
Definition of Primary Variates
For the inclusion of OA patients, our study only included respondents who self-reported OA and were older than 18 years old. “Did the doctor ever tell you that you have arthritis?” When the answer to this question is yes, it is regarded as being an arthritis patient. Then, through “which type of arthritis?” This problem identifies and distinguishes “osteoarthritis” from other arthritis. As a common chronic disease, self-reported information is considered reliable in 85% of cases.24
All volunteers recruited for NHANES had a blood sample taken at the start of the study to facilitate the construction of a complete blood count (CBC) profile. The NLR is calculated by dividing the absolute total neutrophil count by the absolute total lymphocyte count, and the ELR is similarly calculated by dividing the absolute total eosinophil count by the absolute lymphocyte count. NPAR is calculated using the formula Neutrophil percentage (%)100/albumin (g/dL).16
All-cause mortality, cardiac mortality, and renal cause mortality were the main results. The National Center for Health Statistics (NCHS) has linked data collected from several NCHS population surveys with death certificate records from the National Death Index (NDI). Data on each participant’s mortality status were obtained using probabilistic matching between NHANES and NDI death certificate records. A limited-use version of the Associated Mortality file (LMF) is available through the NCHS Research Data Center (RDC), which has been updated with mortality follow-up data as of 31 December 2019. Mortality data can be found at https://www.cdc.gov/nchs/datalinkage/mortality-public.htm.
Covariates
Data on physical activity were examined using the WHO’s analytical guidelines. Metabolic equivalent (MET) minutes of moderate-to-intense exercise per week were calculated from physical activity.
Age (continuous), sex (male or female), and race/ethnicity (non-Hispanic white, non-Hispanic black, Mexican American, other Hispanic, and other/mixed race) were the demographic covariates. The evaluation of socioeconomic position was based on two factors: the ratio of poverty to income (<1.3, 1.3–3.5, >3.5) and the educational attainment (less than 9th grade, 9th-11th grade, high school graduate, some college, college and above). Body mass index (BMI) ranges from underweight (<18.49 kg/m2) to normal (18.50–24.99 kg/m2), overweight (25.00–29.99 kg/m2), or obese (≥30.00 kg/m2); blood glucose (DM, IFG, IGT, and No); hypertension (Yes or No); smoking status (former, current, and never smoker); and alcohol consumption (light, moderate, heavy, never, and former) were among the lifestyle and health-related factors involved. Covariate data that were missing were not included.
Statistical Analysis
Sample weights were assigned to each participant to mask variance between them, in accordance with the CDC’s NHANES guidelines for complex data analysis. Continuous variables were expressed as means (SE), while categorical variables were expressed as percentages. Analysis of variance (ANOVA) is used to test the significance of the difference between the means of two or more samples. Specifically, ANOVA is categorized as one-way or two-way ANOVA. One-way ANOVA is used to investigate whether different levels of a control variable have a significant effect on an observed variable. To examine differences between groups, weighted chi-squared tests and weighted one-way ANOVA were utilized for categorical and continuous variables, respectively. Multivariate logistic regression was used to test the association between peripheral blood lymphocyte count and OA. Model 1 was an unadjusted model, model 2 was adjusted for four covariates: age, race, education level, income level, and sex. Model 3 was a fully adjusted model. In addition, interaction and stratified analyses were performed to examine the effects of several common factors, including age, BMI, sex, smoking, and alcohol consumption. R (version 4.3.2) and accompanying versions of Rtools and RStudio were used for data organization and statistical analysis.
Results
Baseline Characteristics
Data from 22,689 individuals in the NHANES database were analyzed for the study, including 1077 OA patients and 21,612 non-OA participants. Our study explored the discrepancies between the two groups of participants (Table S1). Regarding demographic characteristics, the study found significant differences between the two groups in terms of age, sex, race, and income (P < 0.05). However, there were no significant differences in the level of education (P > 0.05). Furthermore, the analysis of peripheral blood cells showed significant differences in EOS, PLT, ALB, NLR, NPAR, and ELR between the two groups (P < 0.05), while there were no significant differences in WBC, LYM, and NEU (P > 0.05). NLR, NPAR, and ELR were categorized into tertiles, with tertile 1 (Q1) representing the low value and tertile 3 (Q3) representing the high value. The results indicated that NLRQ, NPARQ, and ELRQ were all significantly different between the two populations (P < 0.05). The metabolic equivalents (METs) were a unit of measurement used to determine the energy expenditure of a participant after completing a specific activity. It was an important indicator of relative energy metabolism levels and exercise intensity. One MET was the equivalent of 3.5 mL O2kg−1min−1. When measuring exercise intensity in MET, a significant difference was found between the two groups (P < 0.0001). Additionally, there were notable distinctions between the two groups in terms of their medical history, including hypertension and diabetes, BMI categorization, smoking and alcohol habits, and survival status (P < 0.05).
Association of Peripheral Blood Cells with OA
Three models were constructed to examine the relationship between peripheral blood cells and OA in this study (Table 1). In Model 1, when not controlling for covariates, ALB showed a significant negative association with OA. Meanwhile, EOS, NLR, NPAR, and ELR showed a significant positive association with OA. However, in Model 2, which adjusted for age, race, education level, income level, and sex, as well as in fully adjusted Model 3, only EOS and ELR had significant positive correlations with OA.
 |
Table 1 Association Between Peripheral Blood Cells and OA |
Stratified Analyses
Table 2 showed the results of the stratified analysis on the relationship between ELR and OA risk. There was no significant difference between ELR and OA when stratified by subgroup (P for interaction >0.05). Table 3 displayed the results of the stratified analysis on the relationship between EOS and OA risk. There was no interaction between ELR and OA when stratified by subgroup, except for drinking status (P for interaction >0.05). When EOS levels were higher, individuals with mild drinking had a greater risk of OA compared to those with other drinking statuses (P for interaction = 0.03).
 |
Table 2 Stratified Analysis of the Associations Between ELR and OA |
 |
Table 3 Stratified Analysis of the Associations Between EOS and OA |
The results of stratified analyses in the relationship between ELRQ and OA risk were shown (Table 4). In the age stratified analysis, a significant positive correlation between ELRQ Q3 and OA was found in the <60 years subgroup in Model 1. The same correlation was found in Model 2, but not in Model 3. In the sex subgroup, ELRQ and OA showed a significant positive correlation in all three models. In the stratified analysis of BMI, a significant positive correlation between ELRQ and OA was observed in normal, overweight, and obese individuals in model 1. However, in Models 2 and 3, this association was only present in the overweight population. In a stratified analysis of smoking status, ELRQ was positively correlated with OA in Model 1 and Model 2. However, this trend was not significant for the subgroup of participants who reported never smoking in Model 3. In the stratified analysis of drinking status, ELRQ was positively correlated with OA in all three models for the subgroup of participants who reported mild drinking. In all meaningful stratification models, there was a linear trend between ELRQ and OA, except for the former subgroup in the stratification of drinking status. The specific OR values are shown in Table 4.
 |
Table 4 Stratified Analysis of the Associations Between ELRQ and OA |
Associations of the ELR or EOS with Mortality of OA Patients
Previous studies have suggested that the inflammatory response within the joints of OA patients may affect inflammatory pathways, thereby altering the systemic inflammatory milieu, which may affect their mortality.25 In addition, on the basis of the above we investigated the relationship between all-cause mortality, cardiac mortality and renal mortality and ELR or EOS in patients with OA (Table 5). ELR was significantly positively associated with all-cause mortality, cardiac mortality and renal mortality in models 1 and 2, with a statistically significant linear trend observed. In Model 3, a similar trend was observed. The correlation was particularly pronounced for renal mortality (OR = 22.55, 95% CI: 6.55–77.70). The same conclusion did not apply to EOS (Table 6). Results showed a favorable correlation between EOS and all-cause mortality, cardiac mortality and renal mortality, exclusively in model 1. In model 2, EOS was positively associated with cardiac and renal mortality only. EOS was found to have a significant positive correlation with renal mortality only in model 3 (OR = 3.68, 95% CI: 1.94–7.01).
 |
Table 5 Association of ELR with Mortality |
 |
Table 6 Association of EOS with Mortality |
Nonlinear Relationships of ELR or EOS with OA and Mortality of OA Patients
We used restricted cubic spline (RCS) to assess the non-linear association between ELR or EOS and OA (Figure 2A and B). The results indicated a notable overall correlation between ELR or EOS and osteoarthritis, with no evidence of a non-linear connection.
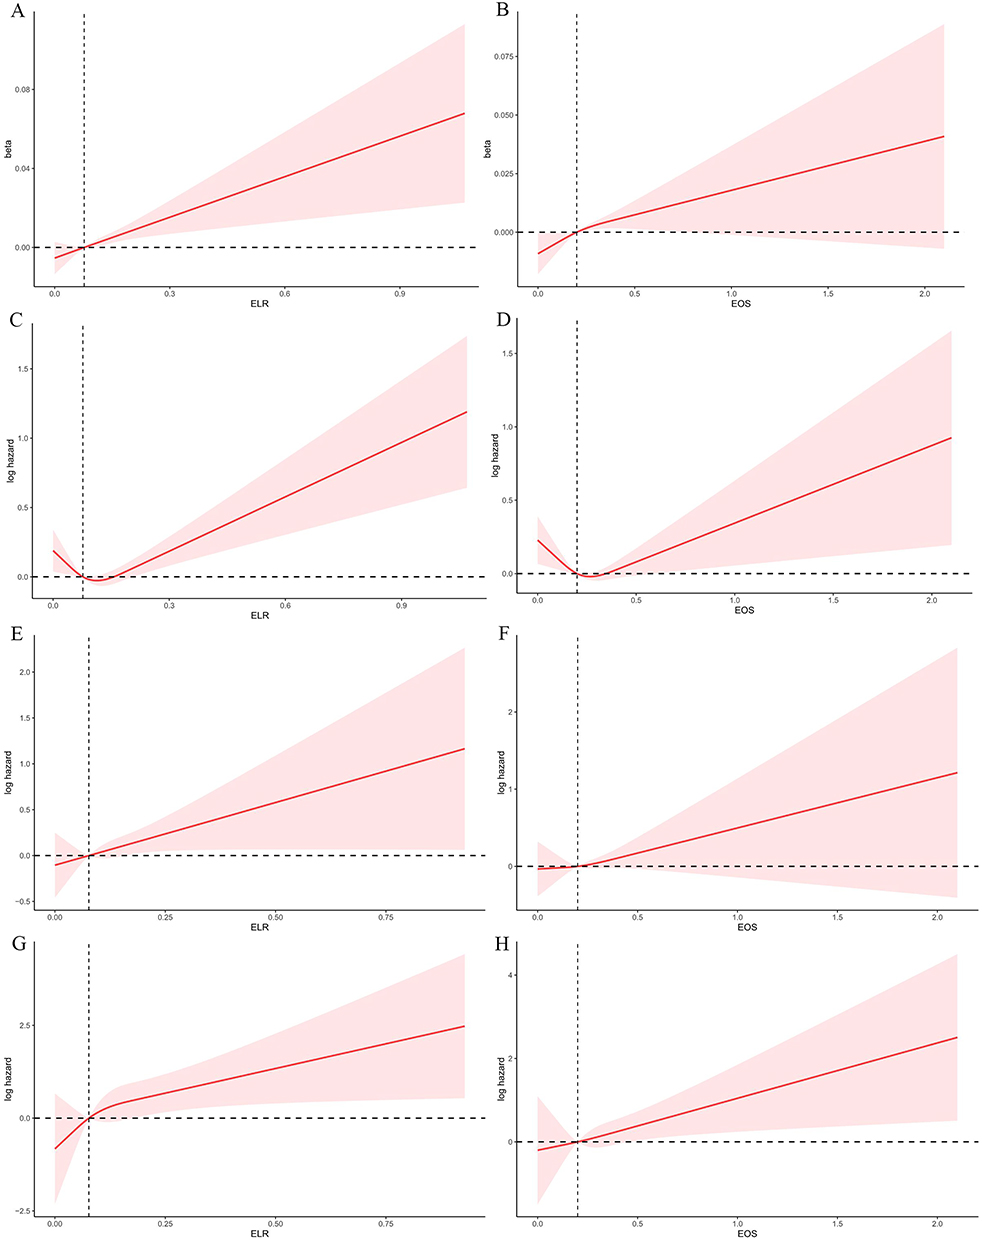 |
Figure 2 The association of OA with ELR (A) and EOS (B) was visualized by RCS. RCS illustrated the association of all-cause mortality with ELR (C) and EOS (D), cardiac mortality with ELR (E) and EOS (F), and renal mortality with ELR (G) and EOS (H) in participants with OA. Abbreviations: OA, Osteoarthritis; NHANES, National Health and Nutrition Examination Survey; MLF, Mortality Linkage File; RCS, Restricted cubic spline; ELR, Eosinophil-to-lymphocyte ratio; EOS, Eosinophil; MMPs, Matrix metalloproteinases; NLR, Neutrophil-to-lymphocyte ratio; PLR, Platelet-to-lymphocyte ratio; MLR, Monocyte-to-lymphocyte ratio; NPAR, Neutrophil-to-albumin ratio; NCHS, National Center for Health Statistics; MET, Missing activity metabolic equivalent; PIR, Poverty income ratio; CBC, Complete blood count; MLFs, Mortality linkage files; NDI, National Death Index; MET, Metabolic equivalent; BMI, Body mass index; ANOVA, Analysis of variance; PAF, Platelet-Activating Factor. |
Moreover, we also used the RCS to estimate the non-linear relationship between the ELR or EOS and the mortality of OA patients. The relationship between ELR and all-cause mortality appears to follow a J shape (Figure 2C), as does the relationship between EOS and all-cause mortality (Figure 2D). Until the ELR hit a low of 0.11, the connection between ELR and all-cause mortality was not statistically significant (p = 0.21). Subsequently, when ELR grew, so did all-cause mortality, and there was a strong positive association between the two (p < 0.0001). Meanwhile, with EOS, all-cause mortality first declined as EOS climbed, but it then increased as EOS increased after the nadir (0.26) was exceeded (Table 7). All of the correlations were statistically significant at p < 0.05. The overall trend for ELR and EOS to be linked with cardiac mortality (Figure 2E and F) and renal mortality (Figure 2G and H) was substantial, but no non-linear connection was found.
 |
Table 7 Analysis of All-Cause Mortality Before and After the RCS Inflection Point |
Discussion
OA is a chronic degenerative joint condition characterized by synovial inflammation and articular cartilage degradation. In osteoarthritic joints, anabolic and catabolic pathway imbalance is the underlying cause of cartilage degradation.26,27 Our study initially identified ELR and EOS as risk factors for OA. This was an innovative finding, which suggested that eosinophils were necessary players in the progression of OA. Eosinophils are highly specialized hemopoietic effector cells that generate, accumulate, and secrete a variety of bioactive compounds. Under different physiological and pathological conditions, eosinophils migrate to their target organs to discharge their products, thereby encouraging local inflammation and even causing tissue damage.28 It has been discovered that comparable cytokines, such as IL-4, IL-10, and CCL11, mediate the migration, adhesion, survival, and activation of eosinophils.29 These cytokines induce eosinophils to migrate to the lesion site in the osteoarthritic joints of OA patients, where they emit the cytokine IL-1, which is involved in cartilage destruction.30 Additionally, Platelet-Activating Factor(PAF) produced by eosinophils effectively stimulates macrophages, which in turn secrete cytokines, growth factors, and MMPs, among other factors leading to inflammation and subsequent degradation of the cartilage.31,32 These results provided credence to the possible involvement of ELR and EOS in OA.
Leukocyte counts and/or their related ratios are frequently chosen as a measure to assess the existence of inflammation due to their affordability and convenience. Previous studies have demonstrated the predictive role of ELR in several diseases33,34 According to a study on asthma, individuals with long-term uncontrolled asthma had an inflammatory phenotype that was accurately predicted by ELR.35 In addition to predicting disease progression, ELR could also be applied to indicate drug efficacy.36 Furthermore, as a separate component, the eosinophil count has a biological function. For instance, it was discovered that there is a strong correlation between the occurrence of coronary artery disease and EOS.37 Meanwhile, EOS was found to be positively associated with coronary artery calcification in a cross-sectional study of 1363 consecutive participants with clinically suspected coronary artery disease and may serve as a provisional new marker for CAC.38 Interestingly, we found that ELR and EOS had distinct functions even in the same condition. While EOS has been proposed to function as a measure of eosinophilic deterioration, ELR was utilized in COPD to evaluate eosinophilic airway inflammation during acute exacerbations.39,40
In addition to ELR and EOS, neutrophil-to-lymphocyte ratio (NLR) is a common predictor of systemic inflammation.41 Relevant prior research has demonstrated that blood NLR could serve as a gauge for the severity of OA.20,42 Our research, however, did not discover a connection between NLR and OA, indicating that the previous conclusion may not be entirely trustworthy. It must be recognized that numerous studies provide evidence for the critical role that neutrophils play in the pathophysiology of OA, even though the exact involvement of NLR in this process is still unclear. According to a study, neutrophils stimulated osteoclasts and released degradative proteases, such as neutrophil elastase, to encourage bone resorption and advance OA.43 Furthermore, it has been discovered that neutrophil and macrophage populations collaborate in the development and course of OA, regulating the inflammatory milieu of OA joints in conjunction with an array of inflammatory cytokines.44 Nevertheless, it is difficult to suppose that the NLR has a similar biological role in the development of OA. Further, large sample analyses of the relationship between NLR and OA are considered necessary to continue exploring the potential interactions.
Meanwhile, noting that the mortality rate of OA patients was higher than normal people, we analyzed the correlation between ELR and EOS and all-cause mortality, cardiac mortality, and renal mortality in OA patients.45 The findings demonstrated a non-linear relationship between ELR and EOS and all-cause mortality, as did EOS. A positive connection with all-cause mortality in ELR required the achievement of a specific threshold; however, it would be more accurate to refer to the EOS inflection point as a cut-off number. This was due to the observation that all-cause mortality rises with rising EOS beyond the inflection point but falls with growing EOS before it. This showed that there may be more going on here than a simple linear association between ELR and EOS and all-cause mortality, and further research was needed to establish this relationship in clinical settings. More importantly, it indicated that ELR and EOS can serve as distinct and significant clinical markers for predicting all-cause mortality in patients with OA. In the meantime, it was discovered that ELR and EOS may have a prognostic role in both cardiac and renal causes of death. However, the biological efficacy of ELR and EOS are not identical. Previous research has demonstrated that T cells regulate the expression of MMP/TIMP and cardiac fibroblast collagen, which in turn affects organ fibrosis.46 Furthermore, a study discovered a favorable correlation between all-cause and CVD mortality and greater circulating T cell numbers.47 A 3-year follow-up report showed a positive correlation between CD8 cell counts and all-cause mortality in the elderly.48 These results showed that eosinophils were not the only factor contributing to patient cardiac mortality, which may help to explain why the ELR and EOS perform differently in terms of mortality prediction.
The correlation between heart disease and eosinophils has garnered significant interest. It has been found that peripheral blood eosinophilia is often accompanied by cardiac involvement and cardiovascular complications, which in turn increase patient mortality.49 The heart is one of the organs most frequently implicated in cases of persistent eosinophilia, according to a substantial number of cases.50 This offers a potential explanation for the noteworthy association found in patients with OA between ELR and EOS and cardiac cause death. Furthermore, it has been found that as eosinophil counts increase, the prevalence of chronic kidney disease and diabetes mellitus, in addition to cardiac arrhythmias, increases.51 Reports of renal involvement in eosinophilic patients are common.52 Peripheral eosinophilia was found to be an independent predictor of tissue eosinophilia and the eventual development of end-stage renal disease, according to case-control research.53 Furthermore, eosinophilia has been linked to quite a few illnesses that frequently impair renal function, including uremia, diabetes mellitus, and cholesterol-embolizing syndromes.54 These findings implied that eosinophils and renal injury may be tightly related, increasing the risk of renal cause mortality in patients.
Our study has several limitations. To begin with, this study did not allow causal inferences to be drawn about the causal relationship between ELR, EOS and outcomes. Also, despite the inclusion of a large number of covariates, there may be unknown confounders, and their influence on the results cannot be excluded. In addition, the ELR and EOS were only obtained from a routine blood test, which is less reliable. Finally, the generalizability to other populations may be limited because the study population consisted of US adults.
Conclusion
Overall, our research showed a significant relationship between ELR, EOS and OA, highlighting the prognostic power of ELR and EOS for patient mortality. More prospective research is highly advised in order to validate the prediction functions of ELR and EOS and to offer information regarding the prognosis of patients with OA.
Data Sharing Statement
All data generated or analysed during this study are included in this published article.
Acknowledgments
We would like to thank the participants and researchers at the e National Health and Nutrition Examination Survey database.
Author Contributions
All authors made a significant contribution to the work reported, whether that is in the conception, study design, execution, acquisition of data, analysis and interpretation, or in all these areas; took part in drafting, revising or critically reviewing the article; gave final approval of the version to be published; have agreed on the journal to which the article has been submitted; and agree to be accountable for all aspects of the work.
Funding
This work was supported by the Central Guidance of Local Science and Technology Development Funds [NO. YDZJSX20231A062] and Shanxi Provincial Scientific and Technological Achievement Transformation Guidance Special Program [NO. 202204021301067].
Disclosure
The authors report no conflicts of interest in this work.
References
1. Murphy MP, Koepke LS, Lopez MT, et al. Articular cartilage regeneration by activated skeletal stem cells. Nat Med. 2020;26(10):1583–1592. doi:10.1038/s41591-020-1013-2
2. Brosseau L, Yonge KA, Robinson V, et al. Thermotherapy for treatment of osteoarthritis. Cochrane Database Syst Rev. 2003;2003(4):CD004522. doi:10.1002/14651858.CD004522
3. Elliott KS, Chapman K, Day-Williams A, et al. Evaluation of the genetic overlap between osteoarthritis with body mass index and height using genome-wide association scan data. Ann Rheum Dis. 2013;72(6):935–941. doi:10.1136/annrheumdis-2012-202081
4. Tachmazidou I, Hatzikotoulas K, Southam L, et al. Identification of new therapeutic targets for osteoarthritis through genome-wide analyses of UK Biobank data. Nat Genet. 2019;51(2):230–236. doi:10.1038/s41588-018-0327-1
5. Li K, Yan G, Huang H, et al. Anti-inflammatory and immunomodulatory effects of the extracellular vesicles derived from human umbilical cord mesenchymal stem cells on osteoarthritis via M2 macrophages. J Nanobiotechnol. 2022;20(1):38. doi:10.1186/s12951-021-01236-1
6. Musumeci G, Aiello FC, Szychlinska MA, Di Rosa M, Castrogiovanni P, Mobasheri A. Osteoarthritis in the XXIst century: risk factors and behaviours that influence disease onset and progression. Int J Mol Sci. 2015;16(3):6093–6112. doi:10.3390/ijms16036093
7. O’Brien KM, van Dongen JM, Williams A, et al. Economic evaluation of telephone-based weight loss support for patients with knee osteoarthritis: a randomised controlled trial. BMC Public Health. 2018;18(1):1408. doi:10.1186/s12889-018-6300-1
8. Cutcliffe HC, DeFrate LE. Comparison of cartilage mechanical properties measured during creep and recovery. Sci Rep. 2020;10(1):1547. doi:10.1038/s41598-020-58220-2
9. Biz C, Maso G, Gambato M, et al. Challenging surgical treatment of displaced articular tibial plateau fractures: do early knee radiographic features have a predictive value of the mid-term clinical functional outcomes. Orthop Surg. 2019;11(6):1149–1162. doi:10.1111/os.12577
10. Belluzzi E, El Hadi H, Granzotto M, et al. Systemic and local adipose tissue in knee osteoarthritis. J Cell Physiol. 2017;232(8):1971–1978. doi:10.1002/jcp.25716
11. Aubourg G, Rice SJ, Bruce-Wootton P, Loughlin J. Genetics of osteoarthritis. Osteoarthritis Cartilage. 2022;30(5):636–649. doi:10.1016/j.joca.2021.03.002
12. Kwon YJ, Koh IH, Chung K, Lee YJ, Kim HS. Association between platelet count and osteoarthritis in women older than 50 years. Ther Adv Musculoskelet Dis. 2020;12:1759720X20912861. doi:10.1177/1759720X20912861
13. Hawkins KE, DeMars KM, Yang C, Rosenberg GA, Candelario-Jalil E. Fluorometric immunocapture assay for the specific measurement of matrix metalloproteinase-9 activity in biological samples: application to brain and plasma from rats with ischemic stroke. Mol Brain. 2013;6:14. doi:10.1186/1756-6606-6-14
14. He Q, Sun C, Lei W, Ma J. SOCS1 regulates apoptosis and inflammation by inhibiting IL-4 signaling in IL-1β-stimulated human osteoarthritic chondrocytes. Biomed Res Int. 2017;2017:4601959. doi:10.1155/2017/4601959
15. Patra D, Sandell LJ. Recent advances in biomarkers in osteoarthritis. Curr Opin Rheumatol. 2011;23(5):465–470. doi:10.1097/BOR.0b013e328349a32b
16. Nøst TH, Alcala K, Urbarova I, et al. Systemic inflammation markers and cancer incidence in the UK biobank. Eur J Epidemiol. 2021;36(8):841–848. doi:10.1007/s10654-021-00752-6
17. Yang X, Zhao S, Wang S, et al. Systemic inflammation indicators and risk of incident arrhythmias in 478,524 individuals: evidence from the UK Biobank cohort. BMC Med. 2023;21(1):76. doi:10.1186/s12916-023-02770-5
18. Meng F, Yan X, Qi J, He F. Association of neutrophil to lymphocyte ratio, platelet to lymphocyte ratio, and monocyte to lymphocyte ratio with depression: a cross-sectional analysis of the NHANES data. J Affect Disord. 2022;315:168–173. doi:10.1016/j.jad.2022.08.004
19. Liu CF, Chien LW. Predictive role of neutrophil-percentage-to-albumin ratio (NPAR) in nonalcoholic fatty liver disease and advanced liver fibrosis in nondiabetic US adults: evidence from NHANES 2017-2018. Nutrients. 2023;15(8):1892. doi:10.3390/nu15081892
20. Taşoğlu Ö, Bölük H, Şahin OŞ, Taşoğlu İ, Özgirgin N. Is blood neutrophil-lymphocyte ratio an independent predictor of knee osteoarthritis severity. Clin Rheumatol. 2016;35(6):1579–1583. doi:10.1007/s10067-016-3170-8
21. Marius I, Vermesan D, Haragus H, Suciu OL, Fruja D. Association of neutrophil to lymphocyte ratio with patient reported outcomes in knee osteoarthritis. Appl Sci. 2020;10(22):8173.
22. Fu K, Cai Q, Jin X, et al. Association of serum calcium, vitamin D, and C-reactive protein with all-cause and cause-specific mortality in an osteoarthritis population in the UK: a prospective cohort study. BMC Public Health. 2024;24(1):2286. doi:10.1186/s12889-024-19825-8
23. Neves JS, Leitão L, Magriço R, et al. Caffeine consumption and mortality in diabetes: an analysis of NHANES 1999-2010. Front Endocrinol. 2018;9:547. doi:10.3389/fendo.2018.00547
24. March LM, Schwarz JM, Carfrae BH, Bagge E. Clinical validation of self-reported osteoarthritis. Osteoarthritis Cartilage. 1998;6(2):87–93. doi:10.1053/joca.1997.0098
25. Sun C, Chang K, Fleming BC, et al. Alpha-2-macroglobulin attenuates posttraumatic osteoarthritis cartilage damage by inhibiting inflammatory pathways with modified intra-articular drilling in a Yucatan minipig model. Am J Sports Med. 2024;52(11):2882–2892. doi:10.1177/03635465241272401
26. Poole AR. An introduction to the pathophysiology of osteoarthritis. Front Biosci. 1999;4:D662–70. doi:10.2741/Poole
27. Hedbom E, Häuselmann HJ. Molecular aspects of pathogenesis in osteoarthritis: the role of inflammation. Cell Mol Life Sci. 2002;59(1):45–53. doi:10.1007/s00018-002-8404-z
28. O’Sullivan JA, Bochner BS. Eosinophils and eosinophil-associated diseases: an update. J Allergy Clin Immunol. 2018;141(2):505–517. doi:10.1016/j.jaci.2017.09.022
29. Valent P, Degenfeld-Schonburg L, Sadovnik I, et al. Eosinophils and eosinophil-associated disorders: immunological, clinical, and molecular complexity. Semin Immunopathol. 2021;43(3):423–438. doi:10.1007/s00281-021-00863-y
30. Del Pozo V, De Andres B, Martin E, et al. Murine eosinophils and IL-1: alpha IL-1 mRNA detection by in situ hybridization. Production and release of IL-1 from peritoneal eosinophils. J Immunol. 1990;144(8):3117–3122. doi:10.4049/jimmunol.144.8.3117
31. Gleich GJ, Adolphson CR, Leiferman KM. The biology of the eosinophilic leukocyte. Annu Rev Med. 1993;44:85–101. doi:10.1146/annurev.me.44.020193.000505
32. Zhang H, Cai D, Bai X. Macrophages regulate the progression of osteoarthritis. Osteoarthritis Cartilage. 2020;28(5):555–561. doi:10.1016/j.joca.2020.01.007
33. Liao QQ, Mo YJ, Zhu KW, et al. Platelet-to-lymphocyte ratio (PLR), neutrophil-to-lymphocyte ratio (NLR), monocyte-to-lymphocyte ratio (MLR), and eosinophil-to-lymphocyte ratio (ELR) as biomarkers in patients with acute exacerbation of chronic obstructive pulmonary disease (AECOPD). Int J Chron Obstruct Pulmon Dis. 2024;19:501–518. doi:10.2147/COPD.S447519
34. Chen H, Chen S, Huang Z, et al. Relationship between blood parameters and Clonorchis sinensis infection: a retrospective single center study. Int Immunopharmacol. 2018;59:120–126. doi:10.1016/j.intimp.2018.04.003
35. Zhang XY, Simpson JL, Powell H, et al. Full blood count parameters for the detection of asthma inflammatory phenotypes. Clin Exp Allergy. 2014;44(9):1137–1145. doi:10.1111/cea.12345
36. Hagino T, Saeki H, Fujimoto E, Kanda N. The eosinophil-to-lymphocyte ratio acts as an indicator for improvement of clinical signs and itch by upadacitinib treatment in atopic dermatitis. J Clin Med. 2023;12(6):2201. doi:10.3390/jcm12062201
37. Prentice RL, Szatrowski TP, Fujikura T, Kato H, Mason MW, Hamilton HH. Leukocyte counts and coronary heart disease in a Japanese cohort. Am J Epidemiol. 1982;116(3):496–509. doi:10.1093/oxfordjournals.aje.a113434
38. Tanaka M, Fukui M, Tomiyasu K, et al. Eosinophil count is positively correlated with coronary artery calcification. Hypertens Res. 2012;35(3):325–328. doi:10.1038/hr.2011.191
39. Schleich F, Corhay J-L, Louis R. Blood eosinophil count to predict bronchial eosinophilic inflammation in COPD. Eur Respir J. 2016;47(5):1562–1564. doi:10.1183/13993003.01659-2015
40. Greulich T, Vogelmeier CF. Blood eosinophils as a marker of eosinophilic exacerbations in COPD. Lancet Respir Med. 2018;6(5):e17. doi:10.1016/S2213-2600(18)30095-X
41. Zahorec R. Ratio of neutrophil to lymphocyte counts--rapid and simple parameter of systemic inflammation and stress in critically ill. Bratisl Lek Listy. 2001;102(1):5–14.
42. Büyükavcı R, Aktürk S, Sağ S. Comparison of blood platelet distribution width and neutrophil-lymphocyte ratio in patients with different grades of knee osteoarthritis. J Back Musculoskelet Rehabil. 2018;31(6):1035–1039. doi:10.3233/BMR-171028
43. Chaney S, Vergara R, Qiryaqoz Z, Suggs K, Akkouch A. The involvement of neutrophils in the pathophysiology and treatment of osteoarthritis. Biomedicines. 2022;10(7):1604. doi:10.3390/biomedicines10071604
44. Hsueh MF, Zhang X, Wellman SS, Bolognesi MP, Kraus VB. Synergistic roles of macrophages and neutrophils in osteoarthritis progression. Arthritis Rheumatol. 2021;73(1):89–99. doi:10.1002/art.41486
45. Constantino de Campos G, Mundi R, Whittington C, Toutounji MJ, Ngai W, Sheehan B. Osteoarthritis, mobility-related comorbidities and mortality: an overview of meta-analyses. Ther Adv Musculoskelet Dis. 2020;12:1759720X20981219. doi:10.1177/1759720X20981219
46. Wei L. Immunological aspect of cardiac remodeling: t lymphocyte subsets in inflammation-mediated cardiac fibrosis. Exp Mol Pathol. 2011;90(1):74–78. doi:10.1016/j.yexmp.2010.10.004
47. Phillips AC, Carroll D, Gale CR, Drayson M, Batty GD. Lymphocyte cell counts in middle age are positively associated with subsequent all-cause and cardiovascular mortality. QJM. 2011;104(4):319–324. doi:10.1093/qjmed/hcq199
48. Provinciali M, Moresi R, Donnini A, Lisa RM. Reference values for CD4+ and CD8+ T lymphocytes with naïve or memory phenotype and their association with mortality in the elderly. Gerontology. 2009;55(3):314–321. doi:10.1159/000199451
49. Tian Z, Fang Q, Zhao D-C, et al. [The clinico-pathological manifestation of cardiac involvement in eosinophilic diseases].. Zhonghua Nei Ke Za Zhi. 2010;49(8):684–687.
50. Chusid MJ, Dale DC, West BC, Wolff SM. The hypereosinophilic syndrome: analysis of fourteen cases with review of the literature. Medicine. 1975;54(1):1–27. doi:10.1097/00005792-197501000-00001
51. Pongdee T, Manemann SM, Decker PA, et al. Rethinking blood eosinophil counts: epidemiology, associated chronic diseases, and increased risks of cardiovascular disease. J Allergy Clin Immunol Glob. 2022;1(4):233–240. doi:10.1016/j.jacig.2022.09.001
52. Motellón JL, Bernis C, García-Sánchez A, Gruss E, Traver JA. Renal involvement in the hypereosinophilic syndrome. Nephrol Dial Transplant. 1995;10(3):401–403.
53. Tariq A, Okamato K, Tariq A, et al. Eosinophilia and risk of incident end stage kidney disease. BMC Nephrol. 2020;21(1):14. doi:10.1186/s12882-020-1685-3
54. Gauckler P, Shin JI, Mayer G, Kronbichler A. Eosinophilia and kidney disease: more than just an incidental finding. J Clin Med. 2018;7(12):529. doi:10.3390/jcm7120529
 © 2024 The Author(s). This work is published and licensed by Dove Medical Press Limited. The
full terms of this license are available at https://www.dovepress.com/terms.php
and incorporate the Creative Commons Attribution
- Non Commercial (unported, 3.0) License.
By accessing the work you hereby accept the Terms. Non-commercial uses of the work are permitted
without any further permission from Dove Medical Press Limited, provided the work is properly
attributed. For permission for commercial use of this work, please see paragraphs 4.2 and 5 of our Terms.
© 2024 The Author(s). This work is published and licensed by Dove Medical Press Limited. The
full terms of this license are available at https://www.dovepress.com/terms.php
and incorporate the Creative Commons Attribution
- Non Commercial (unported, 3.0) License.
By accessing the work you hereby accept the Terms. Non-commercial uses of the work are permitted
without any further permission from Dove Medical Press Limited, provided the work is properly
attributed. For permission for commercial use of this work, please see paragraphs 4.2 and 5 of our Terms.