")
Back to Journals » Journal of Inflammation Research » Volume 17
Establishment and Validation of a Dynamic Nomogram for Persistent Organ Failure in Acute Biliary Pancreatitis: A Retrospective Study
Received 28 July 2024
Accepted for publication 26 October 2024
Published 8 November 2024 Volume 2024:17 Pages 8513—8530
DOI https://doi.org/10.2147/JIR.S489044
Checked for plagiarism Yes
Review by Single anonymous peer review
Peer reviewer comments 3
Editor who approved publication: Dr Tara Strutt
Kaier Gu,1,2 Qianchun Wang3
1Medical Intensive Care Unit, Shaoxing Maternity and Child Health Care Hospital, Shaoxing, Zhejiang Province, People’s Republic of China; 2Maternity and Child Health Care Affiliated Hospital, Shaoxing University, Shaoxing, Zhejiang Province, People’s Republic of China; 3Department of Gastroenterology, The First Affiliated Hospital of Wenzhou Medical University, Wenzhou, Zhejiang Province, People’s Republic of China
Correspondence: Qianchun Wang, Department of Gastroenterology, The First Affiliated Hospital of Wenzhou Medical University, Wenzhou, Zhejiang Province, People’s Republic of China, Email [email protected]
Purpose: The objective of this study was to create a predictive model for the onset of persistent organ failure (POF) in individuals suffering from acute biliary pancreatitis (ABP) by utilizing indicators observed within 24 hours of hospital admission. Early detection of high-risk POF patients is crucial for clinical decision-making.
Patients and Methods: Clinical data and laboratory indicators within 24 hours of admission from ABP patients diagnosed at The First Affiliated Hospital of Wenzhou Medical University between January 1, 2016, and January 1, 2024 were collected and retrospectively analyzed. The Least Absolute Shrinkage and Selection Operator (LASSO) regression and multivariate logistic regression (stepwise regression) methods were employed to identify variables for constructing the prediction model. The prediction model’s performance was evaluated using the area under the curve (AUC), calibration curve, and decision curve analysis (DCA). It was compared with other scoring systems such as SIRS, BISAP, APACHE II, CTSI, and MCTSI. Additionally, a web-based calculator was created to simplify the calculation process.
Results: Out of 324 ABP patients, 25 developed POF. Initial screening identified 18 variables; through LASSO regression and multivariable logistic regression analysis, five variables including BMI, Hb, ALB, Ca, and LIP were determined as independent predictors of POF. According to these factors to build prediction model, draw the nomogram. The AUC’s receiver operating characteristic curve analysis demonstrated a significantly higher value in comparison to other scoring systems. Calibration curve and DCA show that the established model to predict the accuracy of POF is higher, clinical decision of net benefit is also higher. A network calculator utilizing this predictive model was developed.
Conclusion: A predictive model incorporating five risk indicators has been established exhibiting high discriminatory power and accuracy which aids in early identification of ABP patients at risk for developing POF. This holds significant value in guiding clinical decision-making.
Keywords: acute biliary pancreatitis, persistent organ failure, prediction model, LASSO regression
Introduction
Acute pancreatitis (AP) is a common acute abdominal disease in clinical practice. The condition’s progression is attributed to the unusual activation of pancreatic enzymes, leading to self-digestion of the pancreas. The trait of AP is the presence of localized pancreatic inflammation and a widespread inflammatory reaction in the body.1 The worldwide prevalence of AP is 34 cases per 100,000 individuals, and in some regions, it is more than twice that. In recent years, with the improvement of living standards, the incidence of AP has been rising steadily, estimated an average annual increase of about 3% from 1961 to 2016.2 AP is caused by a variety of factors, such as gallstones, alcohol, hyperlipidemia, and diet. Acute biliary pancreatitis (ABP) constitutes the major cause of AP, accounting for about 40%.3 Roughly 80% of AP cases are self-limiting and recover within a week.1 Yet 10–20% of patients develop persistent organ failure (POF) (lasting > 48 hours), with respiratory, renal, and cardiac dysfunction being the most common.4 POF is the main cause of early mortality in AP patients, with a mortality rate of up to 40%, which to a great extent determines the prognosis of patients.5 Hence, it is crucial to promptly identify and acknowledge high-risk POF patients with ABP and intervene in a timely manner to reduce mortality rates and improve prognosis. Hence, timely recognition of AP high-risk POF patients and timely intervention are necessary conditions for reducing mortality and improving prognosis.6
Currently, there are several AP scoring systems used clinically, including SIRS (Systemic Inflammatory Response Syndrome), BISAP (Bedside Index for Severity in Acute Pancreatitis), APACHE II (Acute Physiology And Chronic Health Evaluation II), CTSI (Computed Tomography Severity Index), and MCTSI (Magnetic Resonance Imaging-based Classification System).7–9 However, these scoring systems have certain limitations in predicting the probability of POF. For example, they require numerous indicators, making it difficult to apply to non-ICU patients, and cannot assess the severity within 24 hours of admission. Furthermore, some studies have reported that individual laboratory markers like white blood cell count (WBC),10 serum calcium (Ca2+),11 serum albumin (ALB),12 blood urea nitrogen (BUN),13 serum creatinine (SCr), C-reactive protein (CRP),14 lactate dehydrogenase (LDH),15 prothrombin time (PT)16 could serve as predictors for POF. Yet, the low sensitivity and specificity along with inconsistent thresholds across different studies limit their practical value. Newly developed predictive models in recent years focus on assessing the seriousness of AP,17–20 but most target all forms of pancreatitis instead of specifically for ABP. ABP is the most common type of AP. A large proportion of patients with ABP could be diagnosed immediately after the onset.
Currently, there is still a lack of prediction models for early identification of ABP patients with POF, and the ideal predictor should include simple, inexpensive, and easily measurable clinical indicators that can be used to identify the severity of ABP within 24 hours of admission. The model in this study is intended to identify high-risk groups for POF early on and guide clinicians to develop timely and individualized treatment measures for high-risk ABP patients, ultimately improving patient outcomes.
Materials and Methods
Patient Selection
In accordance with the predefined inclusion and exclusion criteria, this retrospective study enrolled patients with ABP who were hospitalized in the Department of Gastroenterology of The First Affiliated Hospital of Wenzhou Medical University from January 1, 2016, to January 1, 2024. These participants were randomly allocated to a training cohort and a validation cohort in a 1:1 ratio. The training cohort was utilized for developing a novel prediction model and dynamic nomogram, while the validation cohort was used for validation. All included patients presented with their first episode of ABP and were free from other pancreatic conditions such as recurrent acute pancreatitis, chronic pancreatitis, or pancreatic cancer as well as cases with incomplete data.
Diagnosis and Scoring Systems
According to the revised Atlanta criteria in 2012, AP is diagnosed and classified.21 The diagnostic standards for AP include: (1) Continuous pain in the upper abdomen; (2) Elevated levels of serum amylase and/or lipase exceeding three times the normal upper limit; (3) Abdominal imaging results indicating acute pancreatitis. Diagnosis of AP requires meeting two of the above three criteria.
If any of the following features are present, it is defined as ABP: (1) cholelithiasis or cholestasis indicated by imaging techniques; (2) Alanine aminotransferase levels exceed 100 U/L or total bilirubin levels surpass 2.3 mg/dL.22
The diagnostic criteria for POF utilizing the adjusted Marshall scoring system are as follows:23 A score of ≥2 in any organ indicates the presence of POF, while organ dysfunction persisting for over 48 hours (including respiratory, cardiac, ocular, and renal systems) is categorized as POF.
During the validation process, we compared other scoring systems with our risk prediction score. Based on medical records, we calculated SIRS, BISAP, APACHE II, CTSI, and MCTSI scores at admission. Additionally, we computed the scores of three predictive models as follows: Tang et al developed a nomogram (referred to as Nomogram4 in this study) based on four clinical indicators to predict the probability of POF occurring for ABP patients.18 Gao et al developed a nomogram (referred to as Nomogram6 in this study) based on six clinical indicators to predict the probability of POF occurring for AP patients.19 Li et al developed a nomogram (referred to as Nomogram7 in this study) based on seven clinical indicators to predict the probability of severe acute pancreatitis (SAP) occurring for AP patients.20
Inclusion and Exclusion Criteria
Inclusion criteria: (1) Initial diagnosis of AP; (2) Fulfillment of diagnostic criteria for ABP; (3) Age ≥18 years; (4) Admission within 48 hours of symptom onset.
Exclusion criteria: (1) Diagnosis of pancreatitis unrelated to biliary causes, including hyperlipidemic pancreatitis, alcoholic pancreatitis, post-ERCP pancreatitis, or idiopathic pancreatitis; (2) Presence of other potential pancreatic diseases (recurrent acute pancreatitis, chronic pancreatitis, trauma-related pancreatitis, pregnancy-related pancreatitis, or pancreatic cancer); (3) History of prior pancreatic surgery; (4) Coexistence of chronic liver failure, chronic renal failure, chronic heart failure, autoimmune disease, hematological disease, malignant tumor or history of previous radiation or chemotherapy; (5) Hospital stay less than 48 hours; (6) Incomplete clinical data or missing medical records.
Following an initial screening and exclusion process, we ultimately included 324 patients with ABP in this study (Figure 1). Based on the occurrence of POF, the patients were categorized into the POF group (n=25) and non-POF group (n=299).
 |
Figure 1 Flow diagram of the study population. |
Data Collection
According to existing literature and previous clinical experience, 47 potential predictor variables were selected, encompassing demographic characteristics, medical history, vital signs, and laboratory test results. Demographic characteristics encompass gender, age, and body mass index (BMI). Medical history includes hypertension, diabetes, fatty liver, and hyperlipidemia.
Vital signs at admission comprise temperature (T), heart rate (HR), respiratory rate (RR), systolic blood pressure (SBP), and diastolic blood pressure (DBP). Laboratory tests within 24 hours of admission include WBC, neutrophil count (Neut), lymphocyte count (Ly), red blood cell count (RBC), hemoglobin (Hb), red blood cell distribution width (RDW), platelet count (PLT), mean platelet volume (MPV), total cholesterol (TC), triglycerides (TG), high-density lipoprotein cholesterol (HDL), low-density lipoprotein cholesterol (LDL), total bilirubin (TBIL), aspartate aminotransferase (AST), alanine aminotransferase (ALT), alkaline phosphatase (ALP), ALB, BUN, SCr, CRP, procalcitonin (PCT), serum sodium (Na+), serum potassium (K+), serum chloride (Cl−), Ca2+, blood glucose (BG), serum amylase (AMY), serum lipase (LIP), LDH, PT, activated partial thromboplastin time (APTT), prothrombin time (TT), fibrinogen (Fib), international normalized ratio (INR), and D-dimer. The analysis entailed the extraction of the highest or lowest value recorded within 24 hours of admission. Additionally recorded were SIRS, BISAP, APACHE II, CTS, MCTSI, Nomogram 4, Nomogram 6, and Nomogram7 scores. Furthermore, the occurrence of POF, ICU admission rate, mortality rate, and hospitalization days (HD) were also documented.
Data Processing and Statistical Analysis
The normality of continuous variables was assessed using the Kolmogorov–Smirnov test. Subsequently, appropriate analysis was conducted using the t-test or ANOVA for normally distributed data and the Mann–Whitney U-test or Kruskal–Wallis test for non-normally distributed data. Results were reported as mean ± standard deviation (SD) for normally distributed data and median with interquartile range (IQR) for skewed distributions. Categorical variables were examined using Fisher’s exact test or chi-square tests, and results were presented as number (percentage). We employed Least Absolute Shrinkage and Selection Operator (LASSO) regression and multivariable logistic regression to identify crucial variables for constructing a prediction model. The discriminative capability of the model was assessed using receiver operating characteristic (ROC) curves and the area under the ROC curve (AUC). The optimal threshold value was determined by identifying the point with the highest sensitivity and specificity on the ROC curve. Calibration was evaluated using the Hosmer-Lemeshow test and calibration curve, while clinical effectiveness was evaluated through decision curve analysis (DCA). The analysis was performed using R 4.3.2 (http://www.R-project.org/) and software packages including MASS, glmnet, glm, pROC, rms, rmda, and DynNom, as well as SPSS V.25.0 software.
Variables with missing values exceeding 20% were excluded from the analysis. Multiple imputation was employed to address missing values in variables between 5% and 20%, ensuring the selection of the optimal dataset for imputing missing values. Missing values comprising less than 5% were replaced with their respective mean values. A P-value < 0.05 was deemed statistically significant. The “DynNom” package was utilized for network calculator purposes.
Results
Demographic and Clinical Characteristics
The First Affiliated Hospital of Wenzhou Medical University diagnosed a total of 812 patients with ABP from January 1, 2016 to January 1, 2024. Among them, 324 patients met the inclusion criteria (Figure 1).
Table 1 presents an overview of the baseline characteristics of ABP patients. Table 2 presents the baseline characteristics of both the training cohort and validation cohort, revealing no statistically significant differences between the two groups (P > 0.05). Of the 324 patients, 25 developed POF according to the revised Marshall criteria, while the remaining 299 did not. There were 147 males and 177 females. The median age was 62 years and the median BMI was 24.00 kg/m². The medical history revealed hypertension in 102 cases, diabetes in 52 cases, fatty liver in100 cases, and hyperlipidemia in 29 cases. The ICU admission rate was 2.2%, and the mortality rate was 0.6%, with the median HD was 9 days.
 |
Table 1 Demographic and Clinical Characteristics of ABP Patients with or Without POF |
 |
Table 2 Demographic and Clinical Characteristics of the Training and Validation Groups |
No significant differences were observed in terms of gender, age, hypertension, diabetes, or hyperlipidemia between the POF group and non-POF group. In the non-POF group, the HD was 8.0 days (IQR: 6.0–12.0), with no ICU admissions or mortality events reported, and BMI was 23.80 kg/m² (IQR: 22.00–26.20). The prevalence of fatty liver was 29.1% (n=87). In contrast, the POF group had a longer hospital stay with the HD of 18.0 days (IQR: 12.0–21.5), higher rates of ICU admission (28.0%) and mortality (8.0%). BMI was also higher at 25.40 kg/m² (IQR: 24.00–27.95), with a higher prevalence of fatty liver at 52.0% (n=13). All these differences were statistically significant (P < 0.05).
The Association Between POF and Clinical Parameters
Upon analyzing parameters within 24 hours of admission, it was observed that there was a significant association between BMI, fatty live, HR, WBC, Neut, RBC, Hb, TC, HDL, ALB, BUN, SCr, CRP, Ca2+, BG, LIP, LDH, TT, and the onset of POF.
Developing a Model for Predicting POF
From the above identified 18 variable, with the training cohort, we conducted screening of predictor variables using the LASSO regression. Subsequently, independent predictor variables underwent further scrutiny through multivariate logistic regression aimed at eliminating potential confounding factors.
The outcomes from LASSO regression analysis are depicted in Figure 2. Here we identified 12 variables that minimized model error, including fatty liver, BMI, HR, the WBC and RBC, Hb, TC, propagated, Ca2+, BG, LIP, LDH. In comparison to patients without POF, those diagnosed with POF exhibited notably elevated levels of HR, WBC, RBC, Hb, BG, LIP, and LDH during the first 24 hours post-admission. Conversely, these patients demonstrated decreased levels of TC, ALB, and Ca2+ within the same timeframe. Furthermore, patients diagnosed with POF exhibited an increased prevalence of fatty liver and elevated BMI. These findings can be utilized for predicting progression to POF within 24 hours of admission.
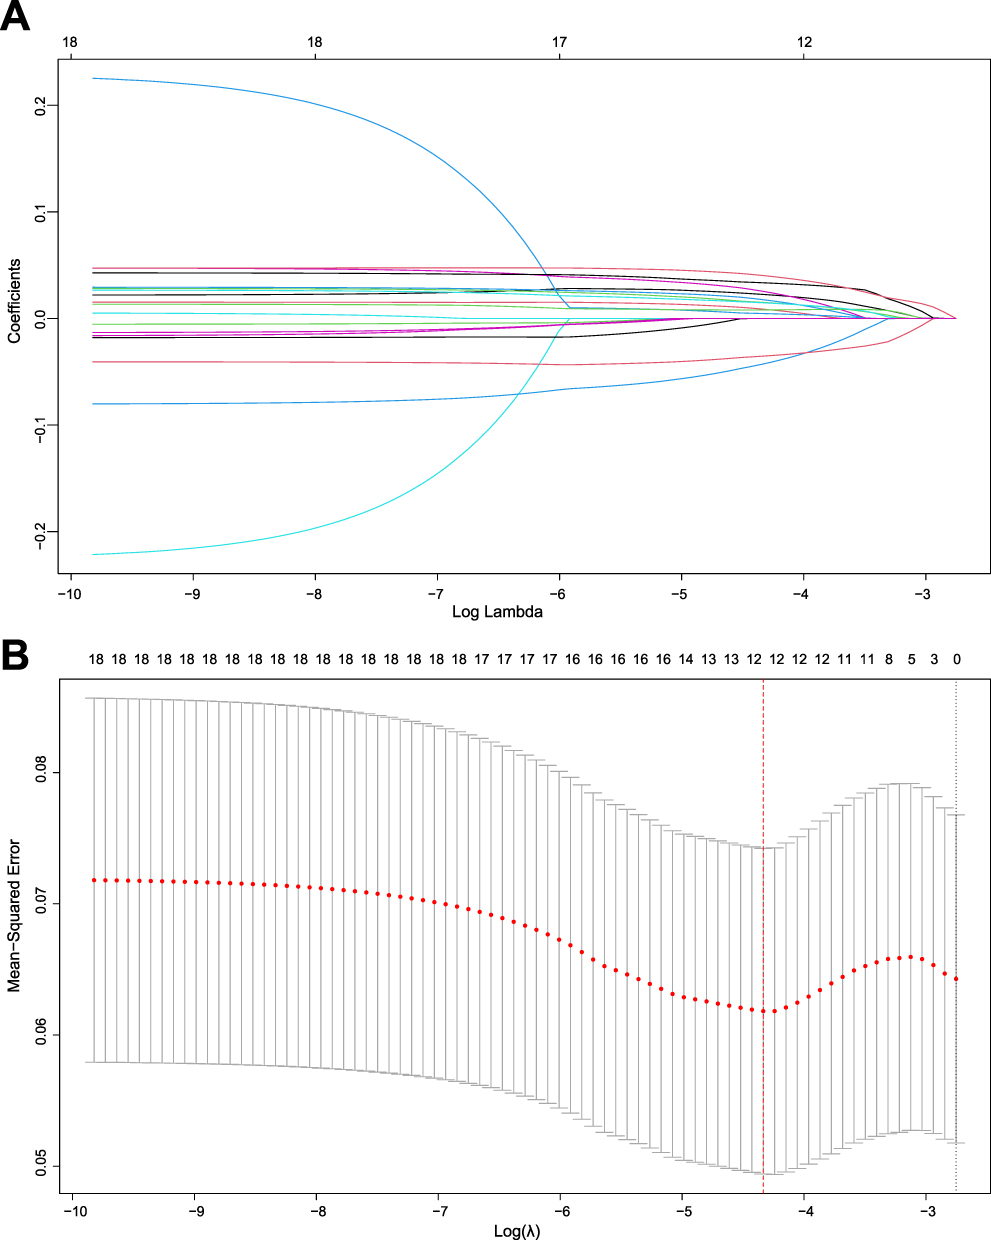 |
Figure 2 Utilize the LASSO regression method for predictor variable selection. (A) Illustrating the coefficient curve of the Least Absolute Shrinkage and Selection Operator (LASSO) for the 18 candidate variables. At the optimal λ, 12 variables with non-zero coefficients are selected. (B) Utilize a 10-fold cross-validation with a minimum criterion to ascertain the tuning parameter (λ) in the LASSO model. |
To mitigate potential impact from confounding factors, the variables identified via LASSO regression underwent inclusion into a subsequent round of multivariate logistic regression for additional screening. Subsequently, a multivariate risk model was developed using a stepwise backward method (Table 3). Ultimately, five independent risk factors associated with POF were discerned, comprising BMI, Hb, ALB, Ca2+, and LIP. These factors were employed to construct a novel prediction nomogram (Figure 3).
 |
Table 3 Multivariate Logistic Regression Analysis of the Predictors of POF |
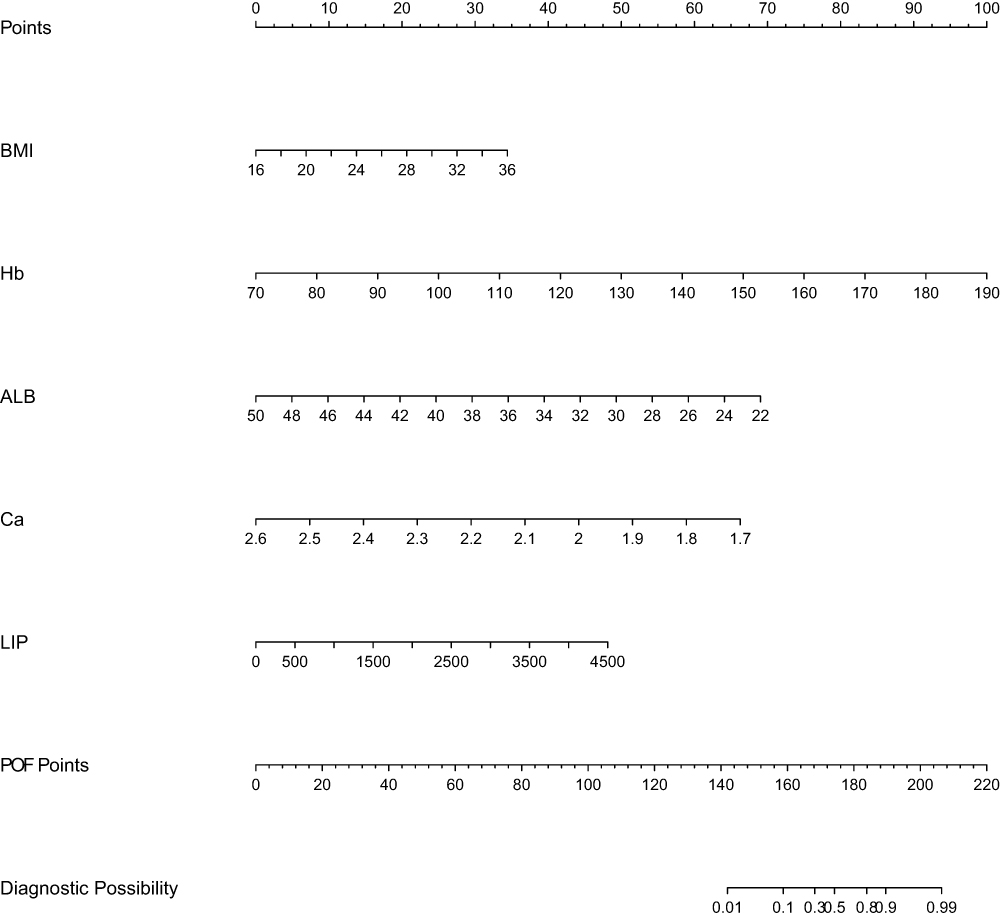 |
Figure 3 A nomogram for predicting the development of POF in ABP patients. |
Evaluation of Model Performance
Reassess the model’s predictive performance through the use of the validation cohort. Evaluate the prognostic accuracy of the current nomogram prediction model in contrast to other scoring systems (including SIRS, BISAP, APACHE II, CTSI, MCTSI, Nomogram4, Nomogram6, Nomogram7) as depicted in Figure 4. Evaluate the prediction model from three perspectives: discriminatory ability, calibration, and clinical utility.
 |
Figure 4 Nomogram performance. ROC curves of the nomogram and other existing scoring systems, for predicting POF probabilities in the training cohort (A) and validation cohort (B). The calibration curves for predicting POF probabilities in the training cohort (C) and validation cohort (D). Decision curve analysis (DCA) for predicting POF probabilities in the training cohort (E) and validation cohort (F). |
ROC curves were plotted for the training cohort and validation cohort, as depicted in Figure 4A and B, with consistency indices of 0.918 (95% CI, 0.833–1.003) and 0.835 (95% CI, 0.714–0.957), respectively. Comparative analysis against other scoring systems exhibited that the prediction model developed in this study demonstrated strong discriminatory ability, showing the highest AUC: 0.918 (95% CI, 0.829–1.000) for the training cohort, with a sensitivity of 0.909 and specificity of 0.824; and an AUC of 0.831 (95% CI, 0.692–0.970) for the validation cohort, with a sensitivity of 0.769 and specificity of 0.814 (Table 4). These findings confirm the robust discriminatory capability of our constructed prediction model. Calibration curves were generated using self-sampling with 1000 iterations for validation to illustrate consistency between actual POF and predicted POF on the nomogram, as illustrated in Figure 4C and D. DCA plots displayed in Figure 4E and F further substantiate that our developed prediction model offers significant net clinical benefits compared to other scoring systems by providing greater net benefits across a wider high-risk threshold range.
 |
Table 4 Discriminatory Performance of Nomogram and Other Clinical Scoring Systems for Identifying Patients with POF |
These findings indicate that the nomogram prediction model proposed in this study exhibits superior potential for predicting the risk of POF occurrence in ABP patients during early hospitalization compared to other scoring systems.
Network Calculator
While the nomogram offers convenience, it is unable to generate precise values during calculation. As a result, we have created a web-based calculator using the nomogram to simplify the calculation process and produce prediction values with enhanced accuracy (https://abp2024.shinyapps.io/ABPDynamicNomogram/). Adjust the numerical strip on the left to input test results, and then proceed to select “Predict” n order to generate an accurate predicted value (Figure 5).
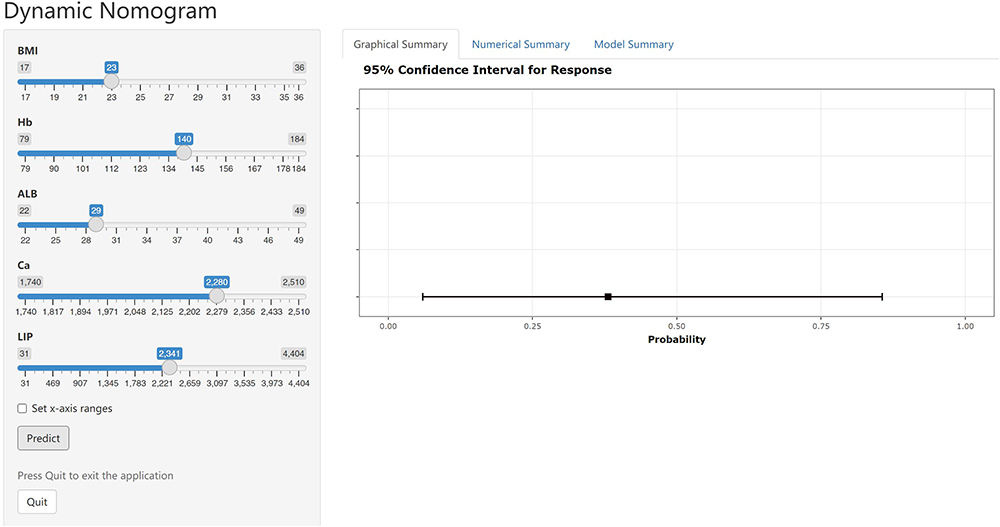 |
Figure 5 A dynamic online tool is utilized to forecast the likelihood of POF development in AP patients. Enter the variable values in the input section on the left, and a graphical summary will be generated to visually display the probability of POF and the confidence interval. |
Discussion
POF represents a significant complication of AP, resulting in prolonged hospital stays and increased patient mortality rates. Therefore, the timely identification of high-risk POF patients is essential for effective risk stratification and management, which can facilitate prompt recovery, shorten hospital stays, and reduce mortality rates. Currently employed for prognostication in cases of AP are various scoring systems such as SIRS, BISAP, APACHE II, CTSI, and MCTSI. However, these systems have limitations in their ability to detect POF early and lack a specific predictive model tailored for ABP. The SIRS score incorporates dynamic vital signs that are subject to change over time; thus, it necessitates repeated assessments to ensure accuracy.24 While the BISAP and APACHE II scores are frequently employed to evaluate disease severity, the former depends on five variables to predict severity within 24 hours of admission, exhibiting lower sensitivity.25 In contrast, the APACHE II score incorporates a variety of laboratory indicators, some of which may not be accessible within 24 hours of admission. This scoring system is specifically designed for critically ill patients in ICU.26 As a consequence, this scoring system exhibits excessive complexity and inconvenience, accompanied by a high rate of false positives. The CTSI score takes into account pancreatic necrosis, which typically manifests 72 hours after the onset of AP. Consequently, early assessment using the CTSI scoring system may lead to an underestimation of the severity of AP.27 MCTSI demonstrates strong predictive capabilities for locoregional complications; however, it is less effective in evaluating the severity of AP.28 Furthermore, several recent studies have established prediction models for AP. For instance, For example, Tang et al developed a prediction model based on four clinical indicators (Neut, Hct, Ca2+, BUN),18 Gao et al proposed a prediction model based on six clinical indicators (Age, HR, SCr, Ly, D-dimer),19 and Li et al introduced a prediction model based on seven clinical indicators (Neut, BG, ALB, Ca2+, SCr, BUN, PCT).20 These three models were also utilized in our research. In this study, a novel predictive model for the occurrence of POF within 24 hours of admission for acute biliary pancreatitis patients was formulated based on five clinical variables (BMI, Hb, ALB, Ca2+, LIP). Our predictive model demonstrated superior accuracy compared to the aforementioned multiple clinical scores, and its predicted values exhibited strong consistency with the observed values. Furthermore, the DCA of our predictive model indicated a broader spectrum of high-risk threshold values. Our simple accurate and readily accessible predictive model is well-suited for application in clinical practice.
There have been studies indicating that BMI is a significant risk factor for the development of SAP.29 A recent prospective, multicenter, and multinational observational study suggests that the risk of developing SAP significantly increases when BMI exceeds 25 kg/m².30
Patients with AP frequently display signs of hemoconcentration, including elevated Hb levels. Biberci Keskin et al demonstrated that Hb may serve as a potential risk factor for SAP.31 Additionally, Ćeranić et al identified Hb as a reliable predictor of AP severity.32
ALB is synthesized by the liver but can be degraded and metabolized in most organs. During the progression of AP, increased protein degradation and a continuous negative nitrogen balance contribute to hypoproteinemia. Li et al discovered that ALB can predict the severity of early-stage AP, with patients exhibiting ALB < 37.25 g/L at higher risk of progressing to SAP.20 Hong et al’s research independently associated serum albumin level with POF in AP patients.33 Multiple studies have demonstrated a significant increase in the incidence of organ failure among patients with AP and hypoproteinemia, consistent with our own research findings.34,35 In conclusion, serum albumin levels are inversely correlated with the severity of AP and can serve as a predictive indicator for the likelihood of postoperative organ failure.
Ca2+ levels play a crucial role in AP progression,36,37 which required to activate pancreatic enzymes and initiate self-digestion while also being affected by pancreatic fluid leakage leading to decreased blood calcium levels due to binding with free fatty acids from degraded fat tissue within the pancreas.38,39 This study identified Ca2+ as an independent predictor of POF, observing a higher likelihood of developing POF with lower Ca2+ levels.40–42
The diagnosis of AP typically relies on abdominal pain and elevated serum amylase and/or lipase levels. Previous guidelines and recommendations indicate that the diagnostic accuracy of LIP is superior to that of amylase.43–45
The innovation point and advantages of this study are as follows: (1) This study collected 47 clinical indicators and laboratory test results, all obtained from the examination within 24 hours of admission to minimize interference from subsequent clinical interventions. (2) The predictive model in this study incorporates only 5 common and easily obtainable clinical indicators, thereby enhancing its practical applicability in clinical settings. (3) The model was compared with existing scoring systems (including SIRS, BISAP, APACHE II, CTSI, and MCTSI) to validate its accuracy. (4) Two visualization models were proposed for clinicians to consider: the nomogram, which offers simplicity and clarity, and the network calculator, which provides convenience and precision. Nevertheless, there are specific limitations associated with this study. (1) The retrospective nature of the study conducted at a single center may introduce potential selection bias and detection bias. (2) Obtaining clinical indicators based on the highest or lowest values within 24 hours of admission may also lead to selection bias. (3) Because POF occurs infrequently, only 25 AP patients developing POF (7.7% of all patients) may reduce the sensitivity of the model. Therefore, external validation through a multicenter cohort study is necessary before applying the predictive model developed in this study clinically.
Conclusion
In conclusion, we have developed the Norman diagram and network calculator based on five commonly variables (BMI, Hb, ALB, Ca2+, LIP) measured upon admission to predict the likelihood of POF occurrence within 24 hours in ABP patients. This study presents a predictive model that serves as a convenient and specialized tool for the early identification of high-risk populations. It plays a crucial role in preventing POF and holds significant value in guiding clinical decision-making, thereby enhancing patient treatment outcomes.
Abbreviations
AP, Acute pancreatitis; ABP, Acute biliary pancreatitis; POF, persistent organ failure; SIRS, Systemic Inflammatory Response Syndrome; BISAP, Bedside Index for Severity in Acute Pancreatitis; APACHE II, Acute Physiology And Chronic Health Evaluation II; CTSI, Computed Tomography Severity Index; MCTSI, Magnetic Resonance Imaging-based Classification System; WBC, white blood cell count; Ca2+, serum calcium; Alb, serum albumin; BUN, blood urea nitrogen; Scr, serum creatinine; CRP, C-reactive protein; LDH, lactate dehydrogenase; PT, prothrombin time; BMI, body mass index; T, emperature; HR, heart rate; RR, respiratory rate; SBP, systolic blood pressure; DBP, diastolic blood pressure; Neut, neutrophil count; Ly, lymphocyte count; RBC, red blood cell count; Hb, hemoglobin; RDW, red blood cell distribution width; PLT, platelet count; MPV, mean platelet volume; TC, total cholesterol; TG, triglycerides; HDL, high-density lipoprotein cholesterol; LDL, low-density lipoprotein cholesterol; TBIL, total bilirubin; AST, aspartate aminotransferase; ALT, alanine aminotransferase; ALP, alkaline phosphatase; ALB, serum albumin; PCT, procalcitonin; Na+, serum sodium; K+, serum potassium; Cl-, serum chloride; Ca2+, serum calcium; BG, blood glucose; AMY, serum amylase; LIP, serum lipase; TT, prothrombin time; Fib, fibrinogen; INR, international normalized ratio; HD, hospitalization days; SD, standard deviation; IQR, interquartile range; LASSO, Least Absolute Shrinkage and Selection Operator; ROC, receiver operating characteristic; AUC, area under the ROC curve; DCA, decision curve analysis.
Data Sharing Statement
The data examined in this research were governed by the following licenses/restrictions: the datasets utilized and examined during the present study can be obtained from the corresponding author upon reasonable request. Inquiries regarding access to these datasets should be addressed to QW, [email protected].
Ethics Approval and Informed Consent
The study was conducted according to the principles of the Declaration of Helsinki. This study was approved by the Ethics Committee of the First Affiliated Hospital of the Wenzhou Medical University. This was a retrospective, observational cohort study, and the data had been anonymized and pooled prior to access and analysis. Therefore, the ethics committee waived the informed consent by all participants.
Acknowledgments
The authors would like to express gratitude to all the patients and investigators who participated in this study.
Funding
The authors declare that no financial support was received for the research, authorship, and/or publication of this article.
Disclosure
The authors declare that the research was conducted in the absence of any commercial or financial relationships that could be construed as a potential conflict of interest.
References
1. Boxhoorn L, Voermans RP, Bouwense SA, et al. Acute pancreatitis. Lancet. 2020;396:726–734. doi:10.1016/S0140-6736(20)31310-6
2. Iannuzzi JP, King JA, Leong JH, et al. Global incidence of acute pancreatitis is increasing over time: a systematic review and meta-analysis. Gastroenterology. 2022;162:122–134. doi:10.1053/j.gastro.2021.09.043
3. Zilio MB, Eyff TF, Azeredo-Da-Silva ALF, et al. A systematic review and meta-analysis of the aetiology of acute pancreatitis. HPB. 2019;21:259–267. doi:10.1016/j.hpb.2018.08.003
4. Garg PK, Singh VP. Organ failure due to systemic injury in acute pancreatitis. Gastroenterology. 2019;156:2008–2023. doi:10.1053/j.gastro.2018.12.041
5. Na-O S, Bakker OJ, Besselink MG, et al. Impact of characteristics of organ failure and infected necrosis on mortality in necrotising pancreatitis. Gut. 2019;68:1044–1051. doi:10.1136/gutjnl-2017-314657
6. Mederos MA, Reber HA, Girgis MD. Acute pancreatitis: a review. JAMA. 2021;325:382–390. doi:10.1001/jama.2020.20317
7. Capurso G, Ponz De Leon Pisani R, Lauri G, et al. Clinical usefulness of scoring systems to predict severe acute pancreatitis: a systematic review and meta-analysis with pre and post-test probability assessment. United Eur Gastroenterol J. 2023;11:825–836. doi:10.1002/ueg2.12464
8. Bollen TL, Singh VK, Maurer R, et al. A comparative evaluation of radiologic and clinical scoring systems in the early prediction of severity in acute pancreatitis. Am J Gastroenterol. 2012;107:612–619. doi:10.1038/ajg.2011.438
9. Cho JH, Kim TN, Chung HH, et al. Comparison of scoring systems in predicting the severity of acute pancreatitis. World J Gastroenterol. 2015;21:2387–2394. doi:10.3748/wjg.v21.i8.2387
10. Lin Y, Liu Y, Lin Q, et al. Development and validation of a nomogram for predicting the severity of the first episode of hyperlipidemic acute pancreatitis. J Inflamm Res. 2024;17:3211–3223. doi:10.2147/JIR.S459258
11. Shuanglian Y, Huiling Z, Xunting L, et al. Establishment and validation of early prediction model for hypertriglyceridemic severe acute pancreatitis. Lipids Health Dis. 2023;22:218. doi:10.1186/s12944-023-01984-z
12. Yang DJ, Lu HM, Liu Y, et al. Development and validation of a prediction model for moderately severe and severe acute pancreatitis in pregnancy. World J Gastroenterol. 2022;28:1588–1600. doi:10.3748/wjg.v28.i15.1588
13. Yang CJ, Chen J, Phillips AR, et al. Predictors of severe and critical acute pancreatitis: a systematic review. Dig Liver Dis. 2014;46:446–451. doi:10.1016/j.dld.2014.01.158
14. He Q, Ding J, He S, et al. The predictive value of procalcitonin combined with C-reactive protein and D dimer in moderately severe and severe acute pancreatitis. Eur J Gastroenterol Hepatol. 2022;34:744–750. doi:10.1097/MEG.0000000000002376
15. Tian F, Li H, Wang L, et al. The diagnostic value of serum C-reactive protein, procalcitonin, interleukin-6 and lactate dehydrogenase in patients with severe acute pancreatitis. Clin Chim Acta. 2020;510:665–670. doi:10.1016/j.cca.2020.08.029
16. Li Y, Zhao Y, Feng L, et al. Comparison of the prognostic values of inflammation markers in patients with acute pancreatitis: a retrospective cohort study. BMJ Open. 2017;3:e013206. doi:10.1136/bmjopen-2016-013206
17. Liu ZY, Tian L, Sun XY, et al. Development and validation of a risk prediction score for the severity of acute hypertriglyceridemic pancreatitis in Chinese patients. World J Gastroenterol. 2022;28:4846–4860. doi:10.3748/wjg.v28.i33.4846
18. Tang J, Chen T, Ni W, et al. Dynamic nomogram for persistent organ failure in acute biliary pancreatitis: development and validation in a retrospective study. Dig Liver Dis. 2022;54:805–811. doi:10.1016/j.dld.2021.06.033
19. Gao X, Xu J, Xu M, et al. Nomogram and web calculator based on lasso-logistic regression for predicting persistent organ failure in acute pancreatitis patients. J Inflamm Res. 2024;17:823–836. doi:10.2147/JIR.S445929
20. Li B, Wu W, Liu A, et al. Establishment and validation of a nomogram prediction model for the severe acute pancreatitis. J Inflamm Res. 2023;16:2831–2843. doi:10.2147/JIR.S416411
21. Banks PA, Bollen TL, Dervenis C, et al. Classification of acute pancreatitis--2012: revision of the Atlanta classification and definitions by international consensus. Gut. 2013;62:102–111. doi:10.1136/gutjnl-2012-302779
22. Schepers NJ, Hallensleben NDL, Besselink MG, et al. Urgent endoscopic retrograde cholangiopancreatography with sphincterotomy versus conservative treatment in predicted severe acute gallstone pancreatitis (APEC): a multicentre randomised controlled trial. Lancet. 2020;396:167–176. doi:10.1016/S0140-6736(20)30539-0
23. Siregar GA, Siregar GP. Management of severe acute pancreatitis. Open Access Maced J Med Sci. 2019;7:3319–3323. doi:10.3889/oamjms.2019.720
24. Machicado JD, Gougol A, Tan X, et al. Mortality in acute pancreatitis with persistent organ failure is determined by the number, type, and sequence of organ systems affected. United Eur Gastroenterol J. 2021;9:139–149. doi:10.1002/ueg2.12057
25. Yang YX, Li L. Evaluating the ability of the bedside index for severity of acute pancreatitis score to predict severe acute pancreatitis: a meta-analysis. Med Princ Pract. 2016;25:137–142. doi:10.1159/000441003
26. Knaus WA, Zimmerman JE, Wagner DP, et al. APACHE-acute physiology and chronic health evaluation: a physiologically based classification system. Crit Care Med. 1981;9:591–597. doi:10.1097/00003246-198108000-00008
27. Alberti P, Pando E, Mata R, et al. Evaluation of the modified computed tomography severity index (MCTSI) and computed tomography severity index (CTSI) in predicting severity and clinical outcomes in acute pancreatitis. J Dig Dis. 2021;22:41–48. doi:10.1111/1751-2980.12961
28. Yang L, Liu J, Xing Y, et al. Comparison of BISAP, Ranson, MCTSI, and APACHE II in predicting severity and prognoses of hyperlipidemic acute pancreatitis in Chinese patients. Gastroenterol Res Pract. 2016;2016:1834256. doi:10.1155/2016/1834256
29. Patel ML, Shyam R, Atam V, et al. Clinical profile, etiology, and outcome of acute pancreatitis: experience at a tertiary care center. Ann Afr Med. 2022;21:118–123. doi:10.4103/aam.aam_83_20
30. Lee PJ, Lahooti A, Culp S, et al. Obesity and alcoholic etiology as risk factors for multisystem organ failure in acute pancreatitis: multinational study. United Eur Gastroenterol J. 2023;11:383–391. doi:10.1002/ueg2.12390
31. Biberci Keskin E, İnce AT, Sümbül Gültepe B, et al. The relationship between serum histon levels and the severity of acute pancreatitis. Turk J Gastroenterol. 2019;30:807–810. doi:10.5152/tjg.2019.18592
32. Ćeranić DB, Zorman M, Skok P. Interleukins and inflammatory markers are useful in predicting the severity of acute pancreatitis. Bosn J Basic Med Sci. 2020;20:99–105. doi:10.17305/bjbms.2019.4253
33. Hong W, Lin S, Zippi M, et al. Serum albumin is independently associated with persistent organ failure in acute pancreatitis. Can J Gastroenterol Hepatol. 2017;2017:5297143. doi:10.1155/2017/5297143
34. Ocskay K, Vinkó Z, Németh D, et al. Hypoalbuminemia affects one third of acute pancreatitis patients and is independently associated with severity and mortality. Sci Rep. 2021;11:24158. doi:10.1038/s41598-021-03449-8
35. Li S, Zhang Y, Li M, et al. Serum albumin, a good indicator of persistent organ failure in acute pancreatitis. BMC Gastroenterol. 2017;17:59. doi:10.1186/s12876-017-0615-8
36. Sutton R, Criddle D, Raraty MG, et al. Signal transduction, calcium and acute pancreatitis. Pancreatology. 2003;3:497–505. doi:10.1159/000075581
37. Frick TW. The role of calcium in acute pancreatitis. Surgery. 2012;152:S157–S163. doi:10.1016/j.surg.2012.05.013
38. Raraty M, Ward J, Erdemli G, et al. Calcium-dependent enzyme activation and vacuole formation in the apical granular region of pancreatic acinar cells. Proc Natl Acad Sci U S A. 2000;97:13126–13131. doi:10.1073/pnas.97.24.13126
39. Van Dijk SM, Hallensleben NDL, Van Santvoort HC, et al. Acute pancreatitis: recent advances through randomised trials. Gut. 2017;66:2024–2032. doi:10.1136/gutjnl-2016-313595
40. Staubli SM, Oertli D, Nebiker CA. Laboratory markers predicting severity of acute pancreatitis. Crit Rev Clin Lab Sci. 2015;52:273–283. doi:10.3109/10408363.2015.1051659
41. Wang D, Guo X, Xia W, et al. Effect of admission serum calcium levels and length of stay in patients with acute pancreatitis: data from the MIMIC-III database. Emerg Med Int. 2022;2022:4275283. doi:10.1155/2022/4275283
42. Xue E, Shi Q, Guo S, et al. Preexisting diabetes, serum calcium and D-dimer levels as predictable risk factors for pancreatic necrosis of patients with acute pancreatitis: a retrospective study. Expert Rev Gastroenterol Hepatol. 2022;16:913–921. doi:10.1080/17474124.2022.2116314
43. Lippi G, Valentino M, Cervellin G. Laboratory diagnosis of acute pancreatitis: in search of the Holy Grail. Crit Rev Clin Lab Sci. 2012;49:18–31. doi:10.3109/10408363.2012.658354
44. Tenner S, Baillie J, Dewitt J, et al. American College of Gastroenterology guideline: management of acute pancreatitis. Am J Gastroenterol. 2013;108:1400–1416. doi:10.1038/ajg.2013.218
45. Ismail OZ, Bhayana V. Lipase or amylase for the diagnosis of acute pancreatitis? Clin Biochem. 2017;50:1275–1280. doi:10.1016/j.clinbiochem.2017.07.003
 © 2024 The Author(s). This work is published and licensed by Dove Medical Press Limited. The
full terms of this license are available at https://www.dovepress.com/terms.php
and incorporate the Creative Commons Attribution
- Non Commercial (unported, 3.0) License.
By accessing the work you hereby accept the Terms. Non-commercial uses of the work are permitted
without any further permission from Dove Medical Press Limited, provided the work is properly
attributed. For permission for commercial use of this work, please see paragraphs 4.2 and 5 of our Terms.
© 2024 The Author(s). This work is published and licensed by Dove Medical Press Limited. The
full terms of this license are available at https://www.dovepress.com/terms.php
and incorporate the Creative Commons Attribution
- Non Commercial (unported, 3.0) License.
By accessing the work you hereby accept the Terms. Non-commercial uses of the work are permitted
without any further permission from Dove Medical Press Limited, provided the work is properly
attributed. For permission for commercial use of this work, please see paragraphs 4.2 and 5 of our Terms.