")
Back to Journals » Journal of Inflammation Research » Volume 17
Exploration of the Key Pathways and Genes Involved in Osteoarthritis Genesis: Evidence from Multiple Platforms and Real-World Validation
Authors Lv H, Wang J, Wan Y, Zhou Y
Received 28 August 2024
Accepted for publication 14 November 2024
Published 4 December 2024 Volume 2024:17 Pages 10223—10237
DOI https://doi.org/10.2147/JIR.S488935
Checked for plagiarism Yes
Review by Single anonymous peer review
Peer reviewer comments 2
Editor who approved publication: Dr Tara Strutt
Hao Lv,1– 3,* Jingkun Wang,2,3,* Yang Wan,4 Yun Zhou1,2
1Department of Rehabilitation Medicine, The Second Affiliated Hospital of Anhui Medical University, Hefei, 230601, People’s Republic of China; 2Research Center for Translational Medicine, The Second Affiliated Hospital of Anhui Medical University, Hefei, 230601, People’s Republic of China; 3Department of Orthopaedics, The Second Affiliated Hospital of Anhui Medical University, Hefei, Anhui, 230601, People’s Republic of China; 4Department of Hematology/Hematological Lab, The Second Affiliated Hospital of Anhui Medical University, Hefei, 230601, People’s Republic of China
*These authors contributed equally to this work
Correspondence: Yun Zhou, Department of Rehabilitation Medicine, the Second Affiliated Hospital of Anhui Medical University, No. 678 Furong Road, Hefei, People’s Republic of China, Email [email protected]
Background: Osteoarthritis (OA), a degenerative and chronic joint disease, is essential for identifying novel biomarkers for the clinical diagnosis of OA.
Methods: We collected 35 OA patients and 32 healthy controls from four clinical cohorts and 8 real-world samples from our institute. The activation status of 7530 signalling pathways was calculated via the gene set enrichment analysis (GSEA) algorithm. Ten machine learning algorithms and 101 algorithm combinations were further applied to recognize the most diagnostic genes. KDELR3 was chosen for further validation via immunohistochemical staining to determine its diagnostic value in real-world samples.
Results: Sixteen pathways, namely, the cellular respiration chain, protein transport, lysosomal and endocytosis pathways, were activated in OA patients. A total of 101 types of algorithm combinations were considered for the diagnostic model, and 58 were successfully output. The two-step model of glmBoost plus RF had the highest average AUC value of 0.95 and was composed of LY86, SORL1, KDELR3, CSK, PTGS1, and PTGS2. Preferable consistency of the diagnostic mole and real conditions was observed in all four cohorts (GSE55235: Kappa=1.000, P< 0.001; GSE55457: Kappa=0.700, P< 0.001; GSE82107: Kappa=0.643, P=0.004; GSE1919: Kappa=1.000, P< 0.001). KDELR3 was expressed at higher levels in OA patients than were the other genes, and with the help of immunohistochemistry (IHC), we confirmed that OA patients presented high levels of KDELR3 in synovial tissues. The infiltration of immunocytes, macrophages, and natural killer T cells was high in OA patients. KDELR3 might be involved in the activation and infiltration of effector memory CD4 T cells (Rpearson = 0.58, P < 0.001) and natural killer T cells (Rpearson = 0.53, P < 0.001).
Conclusion: We constructed and validated a six-gene diagnostic model for OA patients via machine learning, and KDELR3 emerged as a novel biomarker for OA.
Keywords: osteoarthritis, diagnostic model, machine learning, synovial tissue, immunohistochemical staining, KDELR3
Introduction
Osteoarthritis (OA), regarded as a degenerative and chronic joint disease, typically presents with joint pain that is exacerbated by use and alleviated with rest,1 has troubled more than 240 million people globally and has been a leading cause of disability in the elderly.2,3 Specifically, the prevalence of hip OA has reached 0.85%, and that of knee OA has reached 3.8% worldwide.4 There are numerous risk factors linked to OA, such as age, obesity, sex, previous joint injury, ethnicity, and malalignment of joints.2–4 The risk of OA typically tends to increase with age, and women are more susceptible to OA than men are.5 Hence, more diagnostic methods and novel treatments need to be invented, and more exploration of pathogenesis should be carried out.
Currently, many techniques are available for diagnosing OA. In terms of patient history, X-ray, ultrasound, magnetic resonance imaging (MRI), micro-CT, and arthroscopy have been widely used in the clinic.6,7 However, numerous current diagnostic methods have limitations, triggering prolongation of the illness course. Early pathological changes cannot be detected by X-ray. In addition, the symptoms of patients may be inconsistent with the severity examined by X-ray, partly owing to the invisibility of endogenous pain sources and difficulty in assessing exogenous pain features. Ultrasound is unable to detect subchondral bone lesions, and outcomes may differ because of the proficiency of the operators. MRI has not been fully developed and is not completely harmless to the human body, increasing the possibility of causing nephrogenic fibrosis due to intravenous administration.6–8 In terms of OA treatment, lifestyle changes, the use of anti-inflammatory agents and surgery9 have been used to cure OA. Nevertheless, none of the treatments can eliminate symptoms or delay progression. We still face great challenges in the diagnosis and treatment of OA.
To date, an increasing number of signal transcription pathways associated with OA have been discovered. Canonical Wnt signalling, which is transduced by 19 Wnt genes, plays a pivotal role in the homeostasis of joints. The interaction between Wnt and the β-catenin destruction complex is initiated by the binding of Wnt and Frizzled receptors. β-catenin then moves into the nucleus and associates with T-cell factor/lymphoid-enhancer factor family members, activating the expression of Wnt target genes whose overexpression leads to cartilage hypertrophy, while inactivation is responsible for cartilage degradation, indicating that Wnt signalling should be managed carefully to prevent OA.10,11 The classical NF-κB pathway is also linked with the development of OA. Numerous immune mediators, such as IL-1β, TNF-α, and TLRs, activate the IκΒ-kinase (IKK) complex (IKKα, ΙΚΚβ, ΙΚΚγ), triggering the phosphorylation and subsequent degradation of IKB. Matrix-degrading enzymes such as matrix metalloproteinases (MMPs) and the ADAMTS family are ultimately expressed via the transcription of target genes stimulated by IKB, promoting osteoarthritic cartilage erosion.11–13 In addition to key pathways, genes relevant to OA genesis have also been explored. Yao et al14 reported that chondrocyte ferroptosis promotes the progression of OA. Liu et al15 reported that the SLC3A2 gene inhibited ferroptosis and suppressed the deterioration of OA. The expression of SLC3A2 is downregulated in people with OA compared with healthy controls.15 Moreover, there is also some evidence that the expression of the BCL6 gene is positively correlated with the severity of OA.16 The transcription level of BCL6 is upregulated in OA, which indicates that the BCL6 gene may be a predictive biomarker for OA. Mesenchymal stem cells (MSCs) have become a promising therapeutic approach for osteoarthritis (OA) because of their capacity to differentiate into chondrocytes and promote cartilage regeneration, effectively alleviating the detrimental effects of a macrophage-induced inflammatory microenvironment.17
The diagnostic dilemma and many molecular research foundations have encouraged further studies on genes and biomarkers associated with OA. In this study, we performed synovial tissue sequencing on samples from 35 patients with OA and 32 healthy controls. Six key genes were identified to construct models for accurately predicting OA. Furthermore, we verified the expression of the KDELR3 gene in clinical samples and discovered markedly upregulated expression of the KDELR3 gene in patients with OA.
Methods
Patient Summary
We collected a total of 35 OA patients and 32 healthy controls from four GEO cohorts. The filter standard was the cohort containing both synovial tissue samples from OA patients and healthy controls, including GSE1919, GSE55235, GSE55457, and GSE82107, the basic information of these cohorts is displayed in Table 1. To validate the identified biomarkers, we also collected 8 real-world samples from our institute between October 1st, 2023, and January 1st, 2024, four from OA patients and four from healthy controls. In the OA group, samples were collected from patients undergoing total knee arthroplasty, whereas in the control group, samples were obtained from patients without a history of OA who had sustained knee injuries due to trauma. To ensure the integrity of the samples, they were promptly fixed in formalin within half an hour postsurgery. This study was conducted in compliance with the principles of the Declaration of Helsinki and was approved by the Ethics Committee of the Second Affiliated Hospital of Anhui Medical University [approval number: YX2023-137(F1)].
 |
Table 1 Basic Information of the Enrolled Cohorts |
Elimination of Batch Effects
Batch effects represent the nonbiological disparities between two or more datasets. To nullify the bias engendered by batch effects in this investigation and harmonize the transcription profiles across the three GEO cohorts, the ComBat algorithms from the “sva” package were deployed to eradicate the batch effects between these GEO-derived cohorts.
Calculation of the Scores of Signalling Pathways
Gene set enrichment analysis (GSEA) is a computational approach for ascertaining whether a designated gene set exhibits statistically significant deviations between two groups. We implemented GSEA to initially contrast the various activated signalling pathways between OA patients and healthy controls. The backdrop file of molecular signature gene sets was procured from MSigDB, C5: Biological Process, comprising a total of 7530 gene sets.18,19
Diagnostic Model Derived from Integrative Approaches Utilizing Machine Learning Methodologies
To develop a consensus model with high accuracy and stable performance for distinguishing OA patients from normal patients, we integrated 10 machine learning algorithms and 101 algorithm combinations. The integrative algorithms included elastic network (Enet), Lasso, Ridge, Stepglm[both], Stepglm[backward], glmBoost, Latent Dirichlet Allocation (LDA), NaiveBayes, plsRglm, Random Forest (RF), Support Vector Machine (SVM). The signature generation procedure was as follows: (a) Identifying the most activated pathways in OA patients from all four GEO cohorts; (b) performing 101 algorithm combinations on the selected genes from the most activated pathways; (c) training all the models in GSE55235 and validation in the other three cohorts, which were not used for the filtration of pathways; and (d) calculating the AUC value across all the enrolled cohorts.
Infiltration of Immune Cells
Single-sample gene set enrichment analysis (ssGSEA) was used to quantify and assess the infiltration of immune cells via transcriptional data. The gene sets encompassing 28 immune cells were procured from the study conducted by Charoentong et al.20
Immunohistochemical Staining
To validate the diagnostic value of KDELR3, we performed IHC staining of normal and OA tissues from clinical samples. FFPE samples were sectioned into 4.5 μm thick slices. These slices were subsequently hydrated. Antigen retrieval was then conducted with citrate buffer solution. The tissue sections were blocked for one hour and then incubated with a primary anti-KDELR3 antibody (1:1000, PA6579; Abmart, Shanghai, China) overnight at 4°C. The following day, secondary antibodies labelled with goat anti-rabbit IgG-HRP (1:1000, M21002; Abmart, Shanghai, China) were applied, and the samples were stained with DAB.
Statistics
All the statistical computations were executed via R (Version: 4.2.2). A Pearson correlation analysis was applied for continuous data. Pearson correlation analysis was used for continuous data. The chosen pathways were illustrated in a heatmap via the R package “pheatmap”. The kappa statistic is a statistical measure employed for juxtaposing predictive and actual subtypes. The Kruskal‒Wallis test was used for statistical comparisons among more than two groups, whereas the Wilcoxon test was used for pairwise comparisons.21 A two-tailed P value <0.05 was considered statistically significant.
Results
In the present study, we enrolled a total of 67 samples from four cohorts, 35 OA patients and 32 healthy controls, and we also collected clinical samples from four OA patients and four controls to validate the protein levels of the identified key genes. The process of the current research is displayed in Figure 1, which mainly includes cohort collection, pathway identification, model construction and real-world validation.
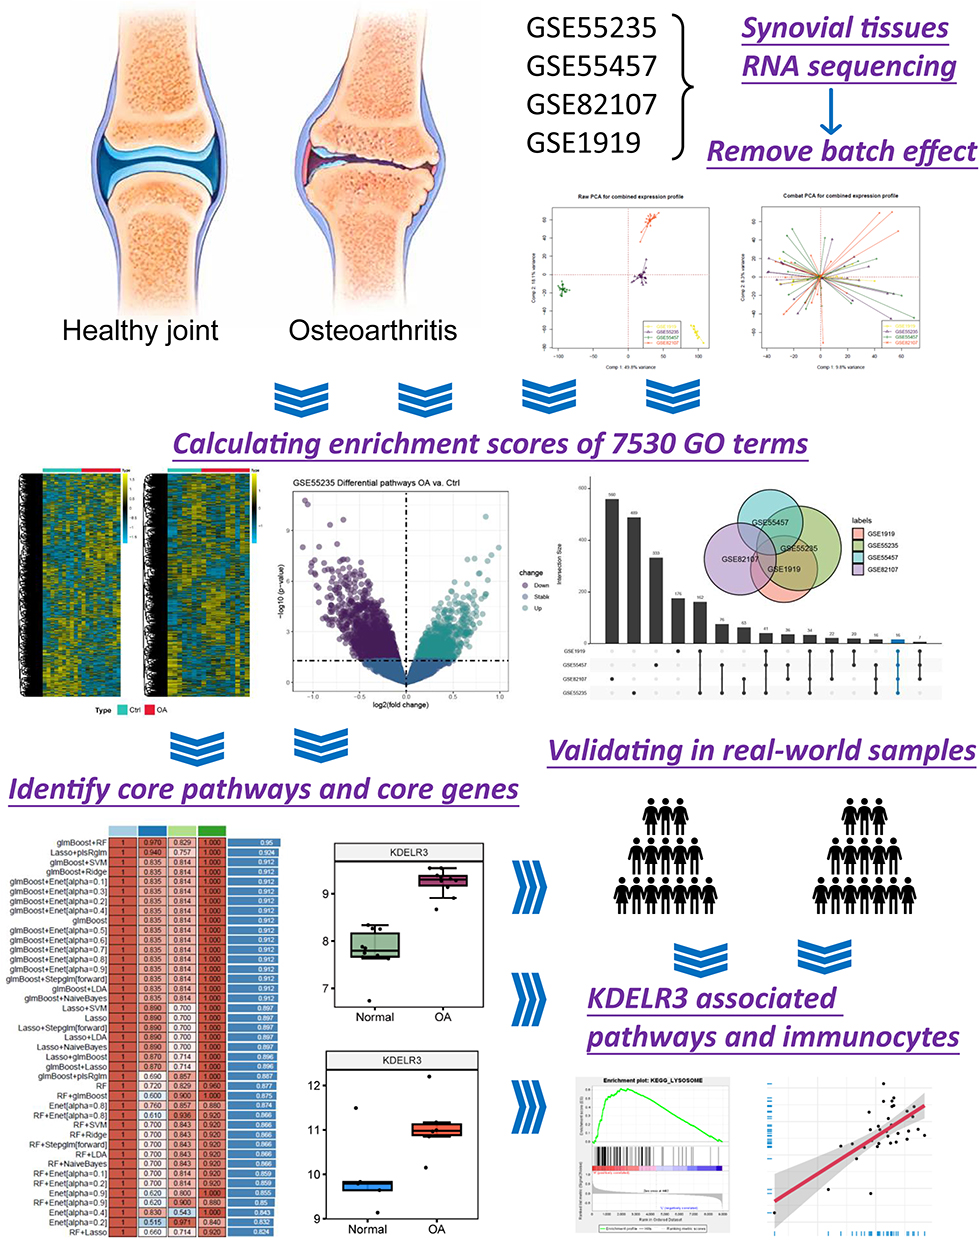 |
Figure 1 Flow chart summarizing the current research. |
Preparation of the Enrolled Cohorts
To keep the findings more stable, we first removed the batch effects via the “sva” package. The first component variance was 49.8%, and the second component variance was 18.1% for the original difference in the gene expression matrix of the four GEO cohorts. After the bath effects were removed, the variance of the first component decreased to 9.8%, and that of the second component decreased to 8.3% (Figure 2A). These results indicate that the batch effects were removed. We subsequently used the “GSVA” package to calculate the pathway activation scores of 7530 gene sets among all the enrolled patients, and heatmaps were generated to display the distribution of these pathways in each cohort (Figure 2B).
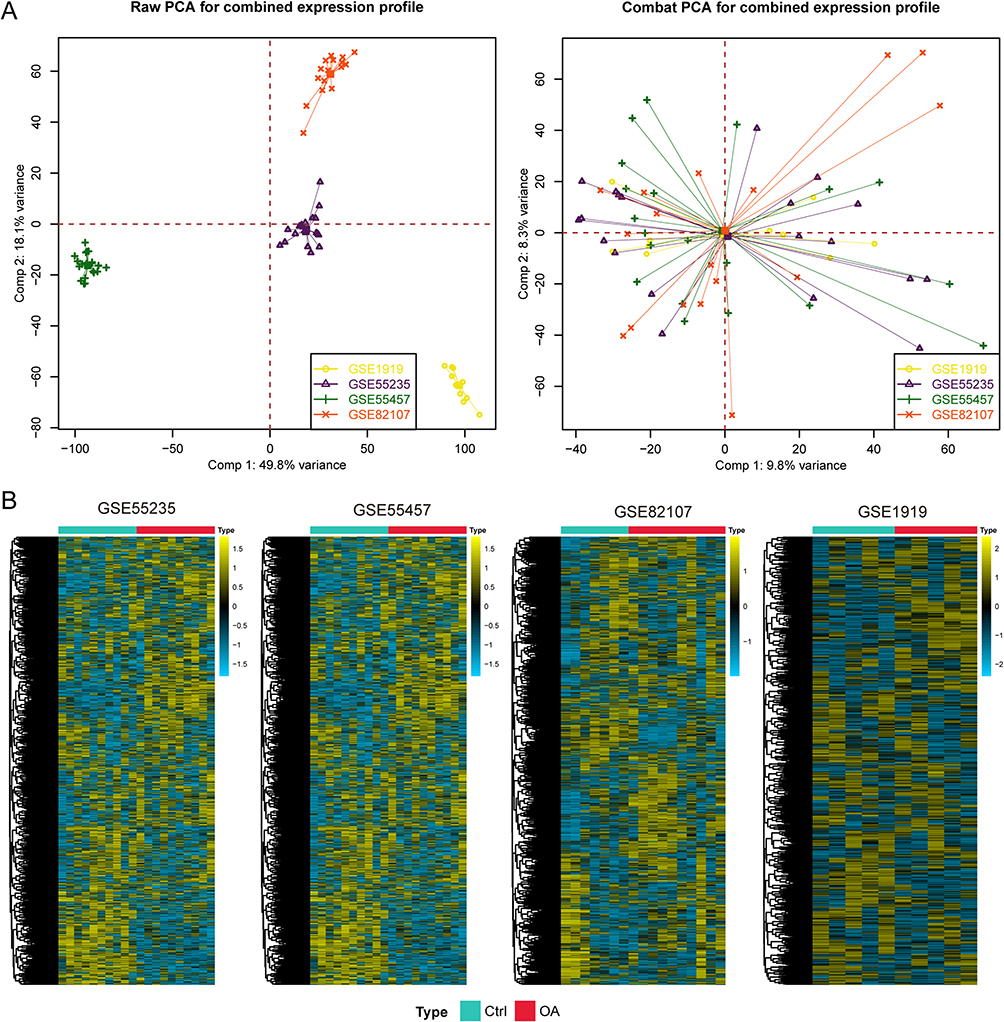 |
Figure 2 Preprocessing of the input data for subsequent analysis. (A) The combat algorithm eliminates the batch effect. (B) Heatmaps showing the activation of signalling pathways in each cohort. |
Screening for Activated Signalling Pathways in Osteoarthritis Patients
With the preset threshold value, p value less than 0.05 and log2fc value greater than 0, we screened the activated signalling pathways in OA patients and selected 897 pathways from GSE55235, 545 pathways from GSE55457, 478 pathways from GSE1919 and 754 pathways from GSE82107 (Figure 3A). In addition, with the help of UpSet plots and Venn diagrams, 16 pathways were identified for subsequent analysis, with a total of 478 nonduplicated genes. The 16 pathways refer to the cellular respiration chain, protein transport, lysosomal and endocytosis, bone remodelling and skeletal muscle regeneration (Figure 3B and Table S1).
 |
Figure 3 Screening for activated signalling pathways in osteoarthritis patients. (A) Different signalling pathways between OA patients and healthy controls in the four GEO cohorts. (B) UpSet plot and Venn diagram delineating the 16 mutually activated signalling pathways across the four cohorts. |
Machine Learning-Based Integration Develops an Osteoarthritis Diagnostic Model
Among the 478 selected genes, 298 were expressed in all four GEO cohorts; therefore, they were used as the input data. As mentioned in the methods, 101 types of algorithms were considered for the construction of the diagnostic model, and the results of 58 combined approaches were successfully output because the other approaches are not suitable for the current research, possibly because of the small amount of input data. The AUC values of each approach are listed in Figure 4A, with the two-step model of glmBoost plus RF showing the highest average AUC value of 0.95. This model was generated with six genes, including LY86, SORL1, KDELR3, CSK, PTGS1, and PTGS2. Furthermore, we double checked the predictive value of this model via kappa analysis and observed preferable consistency in GSE55235 (Kappa = 1.000, P < 0.001), GSE55457 (Kappa = 0.700, P < 0.001), GSE82107 (Kappa = 0.643, P = 0.004) and GSE1919 (Kappa = 1.000, P < 0.001) (Figure 4B).
 |
Figure 4 Machine learning-based integration has led to the development of an osteoarthritis diagnostic model. (A) A total of 101 kinds of prediction models were constructed in GSE55235 and further validated across the other three validation cohorts via AUC values. (B) Evaluating the consistency of the prediction and actual subgroups via kappa statistics. |
Selection of Significant Biomarkers for Real-World Validation
For the six selected genes in the diagnostic model, we compared their expression between 35 OA patients overall and 32 healthy controls. We observed higher levels of LY86, SORL1, KDELR3, CSK and PTGS1 in OA patients than in controls, whereas PTGS2 showed the opposite trend (all P < 0.05, Figure 5A and Table S2). We observed that KDELR3 was expressed at higher levels in OA patients than were the other genes; therefore, we validated its protein level via IHC staining of tissues collected from our own institute, four from OA patients and four from healthy controls. We observed that synovial tissues expressed very low levels of KDELR3, whereas OA patients presented high levels of KDELR3 in synovial tissues (Figure 5B).
 |
Figure 5 Differential expression of the six genes selected for the osteoarthritis diagnostic model. (A) The expression of six genes among normal samples and OA patients from the four cohorts. (B) Immunohistochemical staining showing the protein level of KDELR3 in real-world samples from normal controls and OA patients. |
Activated KEGG Signalling Pathways in OA Patients
To further evaluate the activated pathways, we also performed KEGG pathway analysis. When we compared the KEGG pathway activation between 35 OA patients and 32 healthy controls, we observed the most activated signalling pathways in OA, including the lysosome (NES = 1.936, P = 0.0038), riboflavin metabolism (NES = 1.900, P < 0.001), glycan biosynthesis (NES = 1.822, P = 0.010), and glycosaminoglycan degradation (NES = 1.694, P = 0.0040) pathways (Figure 6), which are tightly associated with cellular respiration and cell proliferation, which is consistent with the findings in Figure 3. In addition, we also observed altered pathways related to base excision repair (NES = 1.717, P = 0.018) and DNA replication (NES = 1.660, P = 0.047) (Figure 6), which indicated that genetic alterations in the process of OA might also stimulate the immune microenvironment.
 |
Figure 6 The activation pathways were investigated with all the enrolled samples. |
Status of Immune Cells in the Synovial Microenvironment of OA Patients
Immunocytes play pivotal roles in the onset and progression of OA.22 We compared infiltration of the 28 immunocytes and observed that infiltration of most types, including macrophage, natural killer T cell, regulatory T cell, type 1 T helper cell, activated B cell, activated CD8 T cell, effector memory CD4 T cell, gamma delta T cell, immature B-cell and immature dendritic cell, was increased in OA patients, whereas infiltration of type 17 T cells, type 2 T cells, and eosinophils was increased in normal controls (Figure 7A). These results indicate that OA is an immune-hot disease. We further directly compared the correlation between KDELR3 and immunocytes in OA tissues and observed that KDELR3 might be involved in the activation and infiltration of most types of immunocytes (Figure 7B), especially for effector memory CD4 T cells (Rpearson = 0.58, P < 0.001, Figure 7C) and natural killer T cells (Rpearson = 0.53, P < 0.001, Figure 7D).
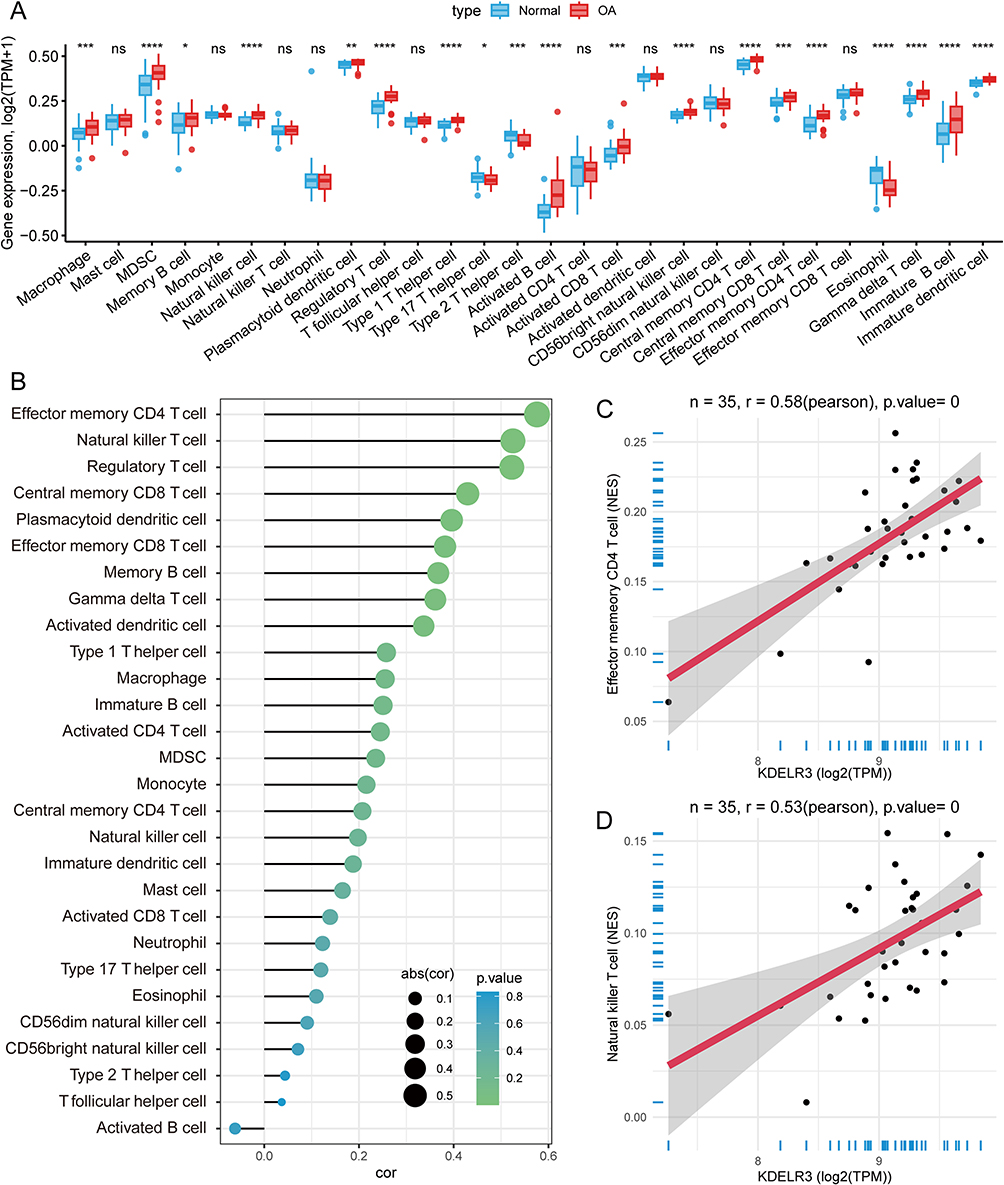 |
Figure 7 Infiltration of immunocytes among OA patients and correlation with KERLR3. (A) Differentially infiltrated immunocytes among OA patients and normal controls. (B) Correlations between KDELR3 and all types of immunocytes. (C) KDELR3 was positively associated with the infiltration level of effector memory CD4 T cells. (D) KDELR3 was positively associated with the infiltration level of natural killer T cells. *, P < 0.05; **, P < 0.01; ***, P < 0.001; ****, P < 0.0001. |
Discussion
OA is a degenerative joint disease characterized by the progressive deterioration of cartilage and chronic inflammation of the synovial membrane, serving as a principal source of incapacitation among the global geriatric population.23 While the exact etiology contributing to osteoarthritis remains elusive, it is increasingly evident that inflammation plays an instrumental role in joint tissue degradation subsequent to injury.24 The synovium is a specialized form of connective tissue that envelopes diarthrodial joints, enwraps tendons, and constitutes the linings of bursae and adipose pads. In synovial joints, this tissue separates the synovial cavity and its fluid from adjacent tissues and, via the synovial fluid, facilitates the nourishment of chondrocytes.25 The histopathological architecture of the synovium in OA patients is characterized by hyperplasia of the synovial lining, fibrosis in the sublining, and vascularization of the stroma.26 A considerable influx of leukocytes from the vascular compartment, orchestrated by cytokines and cell adhesion molecules, has been observed, with various studies pinpointing macrophages and T-cell lymphocytes as the predominant immune cells within the OA synovium.27
While conventionally perceived as predominantly a malady of hyaline cartilage with concomitant bone implications attributed to overload or excessive utilization, the pathophysiological construct underlying the development of OA is now understood to be highly complex. An expanding corpus of evidence suggests that synovitis and the subsequent proinflammatory mediators are important in the pathogenesis of OA, exerting effects on articular cartilage.28 Macrophage pyroptosis instigates the induction of IL-1β, IL-18, and HMGB1, potentially facilitating the translocation of HMGB1 from the fibroblast nucleus and its subsequent engagement with RAGE, thus activating the TGF-β1/SMAD3 signalling cascade and influencing synovial fibrosis.29 Hypoxia in the subchondral bone constitutes a crucial element in the interaction between chondrocytes and osteoblasts, promoting the transition of chondrocytes toward an OA-like phenotype, likely through the activation of the Wnt/β-catenin signalling pathway in osteoblasts.30 Synovitis manifests early in the disease trajectory of OA, a stage where radiographic evidence of cartilage damage remains minimal. Consequently, it is vital to identify biomarkers associated with altered synovial tissue.
In the present investigation, we endeavoured to establish an OA diagnostic model utilizing machine learning, which was founded on 35 OA patients and 32 healthy controls from four diverse clinical cohorts. The batch effects were initially eliminated to maintain a uniform level of the gene expression matrix. To construct a holistic model for diagnosing OA, we initially computed the enrichment scores of signalling pathways for all samples, followed by the identification of overlapping pathways impacting OA across all cohorts. Eventually, 16 signalling pathways, including the cellular respiration chain, protein transport, lysosomal and endocytosis, bone remodelling, and skeletal muscle regeneration, were selected. Upon eliminating redundant genes, a total of 298 genes were incorporated into the analysis. We considered 101 types of algorithms for the construction of the diagnostic model and ultimately successfully outputted the results of 58 combined approaches. We selected the model constructed via the glmBoost plus RF algorithm, which employs six genes and significantly differentiates OA patients from healthy controls; these genes include LY86, SORL1, KDELR3, CSK, PTGS1, and PTGS2.
LY86, also known as Myeloid Differentiation 1, is a secreted glycoprotein that forms a complex with radioprotective 105 that is expressed on DCs, B cells and macrophages and plays an important role as a regulator of the TLR4 pathway.31 The SORL1 gene, located on chromosome 11q23.2-q24.2, encodes a 250 kDa protein dubbed SorLA, a functional sorting receptor for the amyloid-β precursor protein. An increasing body of evidence underscores that variants in the SORL1 gene are risk factors linked with Alzheimer’s disease32 and act as biomarkers of colorectal cancer33 and ankylosing spondylitis.34 Upon binding to the heterotrimeric signalling G protein G(q/11), the KDEL (Lys-Asp-Glu-Leu) receptor family instigates transport via the Golgi complex, subsequently activating the proteins.35 CSK is the gene encoding the C-Src tyrosine kinase, one of the key kinases controlling cartilage and bone tissue remodelling.36 The development of inflammation during OA is linked with C-Src tyrosine kinase, resulting in elevated production of IL-1β and other inflammatory modulators that expedite the catabolism of cartilage and bone tissue.37,38 Prostaglandin-endoperoxide synthase (PTGS), alternatively termed cyclooxygenase (COX), is the principal enzyme facilitating prostaglandin biosynthesis. Two isozymes of COX, encoded by different gene products, exist, a constitutive COX-1 and an inducible COX-2, which exhibit divergence in their regulatory expression and tissue distribution. COX-1 and COX-2 constitute vital targets through which nonsteroidal anti-inflammatory drugs exert their effects and play crucial roles in the clinical treatment of OA.39 The knockout of COX-2 in osteocytes or the administration of a COX-2 inhibitor efficaciously salvages the structure of subchondral bone and mitigates cartilage degradation in a spontaneous OA mouse model.40
Along with clinical samples from patients who underwent surgery at our institute, we validated the increased protein level of KDELR3 in OA patients compared with healthy controls. KDELR3 has exhibited significant aberrations in an array of diseases, including type 2 diabetes, uveal melanoma,41 and renal cell carcinoma.42 The endoplasmic reticulum (ER) lumen is crucial for lipid metabolism, calcium storage, and protein folding and trafficking. Luminal ER-resident proteins perform these functions and are retained in the ER under homeostasis by carboxy-terminal ER retention sequences (ERSs), which are thought to interact with KDEL receptors. Located in the cis-Golgi, KDEL receptors retrogradely transport ERS-containing proteins back to the ER via COPI vesicle-mediated transport.43 KDELR2 and KDELR3, but not KDELR1, are upregulated during ER calcium depletion as part of the unfolded protein response (UPR). This adaptation aims to retain ERS-containing proteins and maintain ER homeostasis, indicating isoform-specific roles of KDELR3 in managing ER stress and protein retention.44 The E96V mutation in the Kdelr3 gene influences beta cell function and contributes to type 2 diabetes (T2D) susceptibility, which disrupts insulin granule maturation and proinsulin levels in beta cells, linking KDELR3 to altered pancreatic beta cell function and increased ER stress in T2D.45 In addition, KDELR3 plays a role in the development of extreme myopia (EM) through its involvement in scleral fibroblast function and extracellular matrix organization, and mutations in KDELR3 were found to be associated with elongated ocular axial length.46
The findings from our study have potential clinical implications, particularly in the context of early diagnosis and targeted therapeutic strategies for osteoarthritis (OA). The machine learning-based diagnostic model, which leverages the expression profiles of six genes, represents a novel approach for distinguishing OA patients from healthy individuals. Given the early onset of synovitis in OA, the model’s ability to detect subtle changes in synovial tissue could allow for earlier intervention, potentially slowing disease progression before significant cartilage degradation occurs. Moreover, the high level of the identified biomarkers, such as KDELR3, was validated in OA patients via IHC staining of real-world samples. These findings could inform the development of personalized medicine approaches, ultimately improving patient outcomes.
However, the study has several limitations. First, the relatively small sample size of 35 OA patients and 32 healthy controls may limit the generalizability of our findings to broader populations. Future studies should validate the model in larger and more diverse cohorts to ensure robustness and reproducibility. Additionally, while we identified key pathways and biomarkers, functional validation through in vitro or in vivo studies is needed to confirm their roles in the pathogenesis of OA.
Conclusion
We constructed and validated a diagnostic model for OA patients via machine learning, and the six-gene diagnostic model can accurately identify patients with osteoarthritis. KDELR3 has emerged as a novel biomarker for OA, demonstrating promising prospects for clinical application.
Abbreviations
OA, Osteoarthritis; MRI, magnetic resonance imaging; CT, computed tomography; GSEA, Gene Set Enrichment Analysis; ssGSEA, Single-sample gene set enrichment analysis; PTGS, Prostaglandin-endoperoxide synthase; COX, Cyclooxygenase.
Data Sharing Statement
All data generated or analyzed during this study are included in this published article and its supplementary information file.
Ethics Approval and Consent to Participate
All included clinical samples were obtained from patients as part of routine hospital procedures, patients or their relatives who participated were informed and signed an informed consent form. This study was conducted in compliance with the principles of the Declaration of Helsinki, and was approved by the Ethics Committee of the Second Affiliated Hospital of Anhui Medical University [approval number: YX2023-137(F1)].
Acknowledgments
I would like to express my gratitude to ChatGPT for providing valuable assistance during the writing process of this manuscript.
Author Contributions
All authors made a significant contribution to the work reported, whether that is in the conception, study design, execution, acquisition of data, analysis and interpretation, or in all these areas; took part in drafting, revising or critically reviewing the article; gave final approval of the version to be published; have agreed on the journal to which the article has been submitted; and agree to be accountable for all aspects of the work.
Funding
The current study is supported by Scientific Research Fund of Anhui Medical University (grant number 2022xkj186).
Disclosure
The authors declare no competing interest exists.
References
1. Gelber AC. Knee Osteoarthritis. Ann Intern Med. 2024;177(9):ITC129–ITC44. doi:10.7326/ANNALS-24-01249
2. Abramoff B, Caldera FE. Osteoarthritis: pathology, Diagnosis, and Treatment Options. Med Clin North Am. 2020;104(2):293–311. doi:10.1016/j.mcna.2019.10.007
3. Katz JN, Arant KR, Loeser RF. Diagnosis and Treatment of Hip and Knee Osteoarthritis: a Review. JAMA. 2021;325(6):568–578. doi:10.1001/jama.2020.22171
4. Cross M, Smith E, Hoy D, et al. The global burden of Hip and knee osteoarthritis: estimates from the global burden of disease 2010 study. Ann Rheum Dis. 2014;73(7):1323–1330. doi:10.1136/annrheumdis-2013-204763
5. Martel-Pelletier J, Barr AJ, Cicuttini FM, et al. Osteoarthritis. Nat Rev Dis Primers. 2016;2:16072. doi:10.1038/nrdp.2016.72
6. Wang D, Qi Y, Wang Z, Guo A, Xu Y, Zhang Y. Recent Advances in Animal Models, Diagnosis, and Treatment of Temporomandibular Joint Osteoarthritis. Tissue Eng Part B Rev. 2023;29(1):62–77. doi:10.1089/ten.teb.2022.0065
7. Wenham CY, Grainger AJ, Conaghan PG. The role of imaging modalities in the diagnosis, differential diagnosis and clinical assessment of peripheral joint osteoarthritis. Osteoarthritis Cartilage. 2014;22(10):1692–1702.
8. Braun HJ, Gold GE. Diagnosis of osteoarthritis: imaging. Bone. 2012;51(2):278–288.
9. Jang S, Lee K, Ju JH. Recent Updates of Diagnosis, Pathophysiology, and Treatment on Osteoarthritis of the Knee. Int J Mol Sci. 2021;22(5):2619. doi:10.3390/ijms22052619
10. Alharbi KS, Afzal O, Altamimi ASA, et al. Potential role of nutraceuticals via targeting a Wnt/beta-catenin and NF-kappaB pathway in treatment of osteoarthritis. J Food Biochem. 2022;46(12):e14427. doi:10.1111/jfbc.14427
11. Cho Y, Jeong S, Kim H, et al. Disease-modifying therapeutic strategies in osteoarthritis: current status and future directions. Exp Mol Med. 2021;53(11):1689–1696. doi:10.1038/s12276-021-00710-y
12. Lepetsos P, Papavassiliou KA, Papavassiliou AG. Redox and NF-kappaB signaling in osteoarthritis. Free Radic Biol Med. 2019;132:90–100. doi:10.1016/j.freeradbiomed.2018.09.025
13. He L, Pan Y, Yu J, Wang B, Dai G, Ying X. Decursin alleviates the aggravation of osteoarthritis via inhibiting PI3K-Akt and NF-kB signal pathway. Int Immunopharmacol. 2021;97:107657. doi:10.1016/j.intimp.2021.107657
14. Yao X, Sun K, Yu S, et al. Chondrocyte ferroptosis contribute to the progression of osteoarthritis. J Orthop Translat. 2021;27:33–43. doi:10.1016/j.jot.2020.09.006
15. Liu H, Deng Z, Yu B, et al. Identification of SLC3A2 as a Potential Therapeutic Target of Osteoarthritis Involved in Ferroptosis by Integrating Bioinformatics, Clinical Factors and Experiments. Cells. 2022;11(21):3430. doi:10.3390/cells11213430
16. Chen Z, Wang W, Hua Y. Identification and validation of BCL6 and VEGFA as biomarkers and ageing patterns correlating with immune infiltrates in OA progression. Sci Rep. 2023;13(1):2558. doi:10.1038/s41598-023-28000-9
17. Tian R, Su S, Yu Y, et al. Revolutionizing osteoarthritis treatment: how mesenchymal stem cells hold the key. Biomed Pharmacother. 2024;173:116458. doi:10.1016/j.biopha.2024.116458
18. Hanzelmann S, Castelo R, Guinney J. GSVA: gene set variation analysis for microarray and RNA-seq data. BMC Bioinf. 2013;14:7. doi:10.1186/1471-2105-14-7
19. Subramanian A, Tamayo P, Mootha VK, et al. Gene set enrichment analysis: a knowledge-based approach for interpreting genome-wide expression profiles. Proc Natl Acad Sci U S A. 2005;102(43):15545–15550. doi:10.1073/pnas.0506580102
20. Charoentong P, Finotello F, Angelova M, et al. Pan-cancer Immunogenomic Analyses Reveal Genotype-Immunophenotype Relationships and Predictors of Response to Checkpoint Blockade. Cell Rep. 2017;18(1):248–262. doi:10.1016/j.celrep.2016.12.019
21. Hazra A, Gogtay N. Biostatistics Series Module 3: comparing Groups: numerical Variables. Indian J Dermatol. 2016;61(3):251–260. doi:10.4103/0019-5154.182416
22. Xie X, Doody GM, Shuweihdi F, Conaghan PG, Ponchel F. B-cell capacity for expansion and differentiation into plasma cells are altered in osteoarthritis. Osteoarthritis Cartilage. 2023;31:1176–1188. doi:10.1016/j.joca.2023.03.017
23. Coaccioli S, Sarzi-Puttini P, Zis P, Rinonapoli G, Varrassi G. Osteoarthritis: new Insight on Its Pathophysiology. J Clin Med. 2022;11(20):6013. doi:10.3390/jcm11206013
24. Molnar V, Matisic V, Kodvanj I, et al. Cytokines and Chemokines Involved in Osteoarthritis Pathogenesis. Int J Mol Sci. 2021;22(17):9208. doi:10.3390/ijms22179208
25. Scanzello CR, Goldring SR. The role of synovitis in osteoarthritis pathogenesis. Bone. 2012;51(2):249–257. doi:10.1016/j.bone.2012.02.012
26. Prieto-Potin I, Largo R, Roman-Blas JA, Herrero-Beaumont G, Walsh DA. Characterization of multinucleated giant cells in synovium and subchondral bone in knee osteoarthritis and rheumatoid arthritis. BMC Musculoskelet Disord. 2015;16:226. doi:10.1186/s12891-015-0664-5
27. Klein-Wieringa IR, de Lange-Brokaar BJ, Yusuf E, et al. Inflammatory Cells in Patients with Endstage Knee Osteoarthritis: a Comparison between the Synovium and the Infrapatellar Fat Pad. J Rheumatol. 2016;43(4):771–778. doi:10.3899/jrheum.151068
28. Sellam J, Berenbaum F. The role of synovitis in pathophysiology and clinical symptoms of osteoarthritis. Nat Rev Rheumatol. 2010;6(11):625–635. doi:10.1038/nrrheum.2010.159
29. Wu P, Liao T, Ma Z, et al. Macrophage pyroptosis promotes synovial fibrosis through the HMGB1/TGF- β1 axis: an in vivo and in vitro study. Vitro Cell Dev Biol Anim. 2023;59(4):289. doi:10.1007/s11626-023-00769-z
30. Li F, Tan Q, Li F, et al. Hypoxia-induced Wnt/beta-catenin signaling activation in subchondral bone osteoblasts leads to an osteoarthritis-like phenotype of chondrocytes in articular cartilage. Front Mol Biosci. 2023;10:1057154. doi:10.3389/fmolb.2023.1057154
31. Divanovic S, Trompette A, Atabani SF, et al. Negative regulation of Toll-like receptor 4 signaling by the Toll-like receptor homolog RP105. Nat Immunol. 2005;6(6):571–578. doi:10.1038/ni1198
32. Alvarez-Mora MI, Blanco-Palmero VA, Quesada-Espinosa JF, et al. Heterozygous and Homozygous Variants in SORL1 Gene in Alzheimer’s Disease Patients: clinical, Neuroimaging and Neuropathological Findings. Int J Mol Sci. 2022;23(8):4230. doi:10.3390/ijms23084230
33. Li P, Chen J, Chen Y, et al. Construction of Exosome SORL1 Detection Platform Based on 3D Porous Microfluidic Chip and its Application in Early Diagnosis of Colorectal Cancer. Small. 2023;19(20):e2207381. doi:10.1002/smll.202207381
34. Li D, Cao R, Dong W, et al. Identification of potential biomarkers for ankylosing spondylitis based on bioinformatics analysis. BMC Musculoskelet Disord. 2023;24(1):413. doi:10.1186/s12891-023-06550-3
35. Li MY, Grandadam M, Kwok K, et al. KDEL Receptors Assist Dengue Virus Exit from the Endoplasmic Reticulum. Cell Rep. 2015;10(9):1496–1507. doi:10.1016/j.celrep.2015.02.021
36. Vandyke K, Dewar AL, Diamond P, et al. The tyrosine kinase inhibitor dasatinib dysregulates bone remodeling through inhibition of osteoclasts in vivo. J Bone Miner Res. 2010;25(8):1759–1770. doi:10.1002/jbmr.85
37. Ghosh D, Tsokos GC. Spleen tyrosine kinase: an Src family of non-receptor kinase has multiple functions and represents a valuable therapeutic target in the treatment of autoimmune and inflammatory diseases. Autoimmunity. 2010;43(1):48–55. doi:10.3109/08916930903374717
38. Geahlen RL. Getting Syk: spleen tyrosine kinase as a therapeutic target. Trends Pharmacol Sci. 2014;35(8):414–422. doi:10.1016/j.tips.2014.05.007
39. Cho H, Walker A, Williams J, Hasty KA. Study of osteoarthritis treatment with anti-inflammatory drugs: cyclooxygenase-2 inhibitor and steroids. Biomed Res Int. 2015;2015:595273. doi:10.1155/2015/595273
40. Tu M, Yang M, Yu N, et al. Inhibition of cyclooxygenase-2 activity in subchondral bone modifies a subtype of osteoarthritis. Bone Res. 2019;7:29. doi:10.1038/s41413-019-0071-x
41. Zhang J, Zhang J, Guan J, Yu L, Yan S. KDELR3 Is a Prognostic Biomarker Related to the Immune Infiltration and Chemoresistance of Anticancer Drugs in Uveal Melanoma. Dis Markers. 2022;2022:1930185. doi:10.1155/2022/1930185
42. Li K, Li Y, Lyu Y, et al. Development of a Phagocytosis-Dependent Gene Signature to Predict Prognosis and Response to Checkpoint Inhibition in Clear-Cell Renal Cell Carcinoma. Front Immunol. 2022;13:853088. doi:10.3389/fimmu.2022.853088
43. Mei M, Zhai C, Li X, et al. Characterization of aromatic residue-controlled protein retention in the endoplasmic reticulum of Saccharomyces cerevisiae. J Biol Chem. 2017;292(50):20707–20719. doi:10.1074/jbc.M117.812107
44. Trychta KA, Back S, Henderson MJ, Harvey BK. KDEL Receptors Are Differentially Regulated to Maintain the ER Proteome under Calcium Deficiency. Cell Rep. 2018;25(7):1829–40e6. doi:10.1016/j.celrep.2018.10.055
45. Altenhofen D, Khuong JM, Kuhn T, et al. E96V Mutation in the Kdelr3 Gene Is Associated with Type 2 Diabetes Susceptibility in Obese NZO Mice. Int J Mol Sci. 2023;24(1):845. doi:10.3390/ijms24010845
46. Yuan J, Zhuang YY, Liu X, et al. Exome-wide association study identifies KDELR3 mutations in extreme myopia. Nat Commun. 2024;15(1):6703. doi:10.1038/s41467-024-50580-x
 © 2024 The Author(s). This work is published and licensed by Dove Medical Press Limited. The
full terms of this license are available at https://www.dovepress.com/terms.php
and incorporate the Creative Commons Attribution
- Non Commercial (unported, 3.0) License.
By accessing the work you hereby accept the Terms. Non-commercial uses of the work are permitted
without any further permission from Dove Medical Press Limited, provided the work is properly
attributed. For permission for commercial use of this work, please see paragraphs 4.2 and 5 of our Terms.
© 2024 The Author(s). This work is published and licensed by Dove Medical Press Limited. The
full terms of this license are available at https://www.dovepress.com/terms.php
and incorporate the Creative Commons Attribution
- Non Commercial (unported, 3.0) License.
By accessing the work you hereby accept the Terms. Non-commercial uses of the work are permitted
without any further permission from Dove Medical Press Limited, provided the work is properly
attributed. For permission for commercial use of this work, please see paragraphs 4.2 and 5 of our Terms.
Recommended articles
Network Analysis of Osteoarthritis Progression Using a Steiner Minimal Tree Algorithm
Xie Y, Shao F, Ji Y, Feng D, Wang L, Huang Z, Wu S, Sun F, Jiang H, Miyamoto A, Wang H, Zhang C
Journal of Inflammation Research 2024, 17:3201-3209
Published Date: 18 May 2024