")
Back to Journals » Journal of Pain Research » Volume 18
Exploring Causality Between Bone Mineral Density and Cervical Spondylosis: Bidirectional and Multivariable Mendelian Randomization Study
Received 9 January 2025
Accepted for publication 22 June 2025
Published 9 July 2025 Volume 2025:18 Pages 3463—3476
DOI https://doi.org/10.2147/JPR.S516682
Checked for plagiarism Yes
Review by Single anonymous peer review
Peer reviewer comments 2
Editor who approved publication: Professor King Hei Stanley Lam
Wangnan Mao, Lianguo Wu
The Second Affiliated Hospital of Zhejiang Chinese Medical University, Hangzhou, People’s Republic of China
Correspondence: Lianguo Wu, Email [email protected]
Background: Recent evidence has suggested a potential link between bone mineral density (BMD) and cervical spondylosis (CS), while the specific relationship has yet to be comprehensively elucidated. Our study aimed to implement a comprehensive analytical framework incorporating bidirectional two-sample Mendelian randomization (MR) and multivariable MR (MVMR) to investigate the causal relationship between BMD and CS.
Methods: Genome-wide association summary statistics for BMDs across four skeletal sites and five age groups, and CS, were obtained from public databases. Single Nucleotide Polymorphisms (SNPs) that had a significant genetic association with exposures were used as instrumental variables (IVs). We employed inverse variance weighting (IVW) analysis as the primary analytical method to estimate potential causal effects, whereas Weighted median, MR-Egger regression, weighted mode, and simple mode were served as supplements. Furthermore, several sensitivity analyses (MR-Egger intercept, MR-PRESSO, Cochran’s Q test, and Leave-one-out test) were utilized to assess the robustness, heterogeneity, and horizontal pleiotropy of the findings.
Results: After applying the Bonferroni correction, BMDs in three skeletal sites exhibited significant positive causal associations with CS risk, including total body (TB), femoral neck (FN), and heel bone (HB). Notably, based on MR analyses of TB-BMD data stratified by five age brackets, the positive causal relationship was especially pronounced in the 45– 60-year-old group. Further MVMR analysis revealed that, even after controlling for confounding factors, higher TB-BMD (OR = 1.14, 95% CI: 1.01– 1.29; P = 3.12E− 02) and HB-BMD (OR = 1.11, 95% CI: 1.01– 1.22; P = 2.45E− 02) still maintained an independent and significant causal association with CS. However, we did not find evidence to suggest that CS has an impact on BMD in reverse MR analysis.
Conclusion: This study provides genetic support for a causal relationship between BMD and CS susceptibility. Specifically, individuals with high BMD are at greater risk of developing CS, offering valuable insights for future clinical research.
Keywords: cervical spondylosis, bone mineral density, Mendelian randomization
Introduction
Osteoporosis (OP) is defined by a decrease in bone mineral density (BMD), degradation of bone microstructure, and increased bone fragility, which finally leads to reduced bone strength and an increased risk of fragility fractures.1 Early detection, prevention, and management can minimize the burden of osteoporosis on individuals and society, while measurement of bone density by dual-energy X-ray absorptiometry (DXA) in the same bone site is a crucial diagnostic method for OP.2 Among them, the femoral neck, lumbar spine, and forearm are the most commonly used bone sites for detecting BMD.3 Recently, the heel region has also been acknowledged as a reliable substitute for assessing BMD.4 The costs of treating OP are significant in many countries and are expected to increase, placing a substantial burden on both individuals and society.5
Similar to spontaneous bone loss, cervical spondylosis (CS) is one of the main features of aging that refers to widespread degenerative changes in the components of the cervical spine (ie the vertebral disc, tiny joints, the Luschka joint, ligaments and vertebrates).6 Until 2017, around 2.887 million individuals globally experienced neck pain symptoms, with an occurrence rate of up to 3551 cases per 10 million people.7 Although non-surgical treatment targeting the affected nerve roots or spinal cord can effectively alleviate the pain, many of patients still suffer neurological damage because of the absence of surgical intervention.8
Historically, it has been proposed that reduced BMD could worsen nearby disc degeneration, perhaps contributing to the arrival of associated disorders, but most of these studies have focused on the lumbar spine.9–11 However, significant anatomical and degenerative differences exist between the cervical and lumbar spine, necessitating caution when extrapolating lumbar spine findings to cervical applications.12,13 A recent observational study revealed that individuals with higher BMD are more likely to develop CS, which goes against traditional beliefs.14 This might arise from elevated vertebral BMD, particularly in the sub-endplate region, which obstructs medullary arterial branch vascular channels and nutrient diffusion, accompanied by reduced vascular budding and angiogenesis.15,16 Conversely, OP can delay disk degeneration by increasing diffusive transport of nutrients through mechanical and vascular pathophysiologic pathways within the intervertebral disks.17 On the other hand, spinal degenerative changes may drive localized BMD elevation, primarily attributed to stress distribution-induced sclerotic bone formation. For instance, in axial radiographic spondyloarthritis, the initial bone mineral loss caused by chronic inflammation becomes obscured by subsequent osteogenesis.18 As cervical disc degeneration progresses, bone density in the vertebral body and sub-endplate bone increased, particularly in the caudal region.19 In an experimental study of aging zebrafish, researchers found osteoporosis-like changes, including disrupted bone morphology, microstructural alterations, mineral heterogeneity, and elevated fragility. These changes were accompanied by degeneration of the intervertebral ligament (equivalent to the annulus fibrosus), as well as dehydration and cell abnormalities in the disc center (nucleus pulposus equivalent).20 Unfortunately, although scholars have established significant associations between bone metabolism, cervical disc degeneration, bone turnover markers, and amino acid levels, the understanding of the relationship between BMD and CS still remains incomplete in cohort studies or cross-sectional studies due to potential confounders and inadequate reverse causality.21
As an alternative research method, Mendelian randomization (MR) uses single nucleotide polymorphisms (SNPs) as instrumental variables (IVs) to mimic the randomization commonly found in randomized controlled trials (RCTs).22 With the lack of reliable randomized controlled trials, MR is commonly employed to investigate the causal effect of risk factors on outcomes.23 Furthermore, as the genotype of the organism is established before the disease begins and is not influenced by how it developed, undesirable defects caused by potential confounders or reverse causal relationships can be reduced to a minimum.24 To the best of our knowledge, there are currently no MR studies to explore the causal relationship between BMD and CS. Thus, we employed publicly available genome-wide association study data as the basis for bidirectional two-sample MR and Multivariable Mendelian randomization (MVMR), which aimed to enhance our comprehension of the pathophysiology of CS and offered evidence for clinical treatment.
Materials and Methods
Study Design
In this study, we employed bidirectional two-sample MR and Multivariable Mendelian randomization (MVMR) approach utilizing summary statistics derived from genome-wide association studies (GWASs) to examine the associations between BMD which across five age groups and four skeletal sites and CS. To ensure the robustness of our MR analysis, we adhered to three fundamental assumptions: (i) the selected genetic variants should exhibit significant associations with the exposure of interest; (ii) the genetic variants employed should not exert any influence on the outcome, except through the chosen exposure; and (iii) the genetic variants should not be correlated with any confounding factors that may impact the relationship between the exposure and the outcome. Previous studies have provided evidence of genetic correlation between multiple traits (body mass index, type 2 diabetes, hyperlipidemia, smoking, etc). and IVs used for exposures.25–28 Hence, those variables were individually subjected to Multivariable Mendelian randomization (MVMR) with BMDs across five age groups and four skeletal sites. The detailed study design is depicted in Figure 1.
 |
Figure 1 Overview of the MR analysis design. The flowchart illustrates three fundamental MR assumptions: (1) Assumption 1 represents the relevance assumption; (2) Assumption 2 represents the Independence assumption; (3) Assumption 3 represents the exclusion-restriction assumption. Dashed lines indicate irrelevant associations (marked by red cross); Solid lines indicate correlations (marked by green checkmark). Abbreviations: IVs, instrumental variables; BMD, bone mineral density; CS, cervical spondylosis. |
Data Sources
The summary statistics for BMD were derived from measurements taken at four common skeletal sites in postmenopausal women and men aged 50 years or older: the femoral neck (FN), lumbar spine (LS), forearm (FA), and heel bone (HB). GWAS data for FN-BMD (N = 32,735), LS-BMD (N = 28,498), and FA-BMD (N = 8143) were obtained from the GEFOS consortium—the largest DXA-based BMD GWAS to date—with genetic values adjusted for sex, age, age squared, and weight.29 Moreover, the GWAS on HB-BMD (N = 426,824), measured via ultrasound, were adjusted for age, sex, genotyping array, and assessment center using a fixed-effects model.30 TB-BMD provides the most reliable and unbiased measure of BMD variation at the same skeletal site across the lifespan. The TB-BMD data (N = 56,284) were obtained from a large GWAS meta-analysis and adjusted for age, weight, height, genomic principal components, and study-specific covariates using a linear regression model.31 For unrelated individuals, residuals were calculated separately by sex, while in family-based studies, sex was included as a covariate. Based on TB-BMD, participants were categorized into five age groups: 0–15 (N = 11,807), 15–30 (N = 4180), 30–45 (N = 10,062), 45–60 (N = 18,805), and over 60 (N = 22,504). The characteristics of each contributing study are presented in Table 1.
 |
Table 1 Data Sources Used in This Study |
FinnGen biobank is a large-scale research project in genomics and personalized medicine, which has collected and analyzed genome and health data from 500,000 Finnish biobank donors. Summary statistics for CS were retrieved from the FinnGen biobank, comprising 14,670 cases (7794 female and 6876 male) and 294,770 controls, with an average age of first onset at 48.99 years (https://r10.risteys.finregistry.fi/endpoints/M13_CERVICDISC).32 Data involved were publicly available from the FinnGen biobank (https://r10.finngen.fi/, accessed March 28, 2024) and the trait of this study was labelled “Cervical disc disorders”.
Our study was based on previously published studies or publicly available GWAS summary statistics, with the majority of participants being of European ancestry to reduce potential bias from population heterogeneity. The Research Ethics Committee of the Second Affiliated Hospital of Zhejiang Chinese Medical University deemed this work exempt from the Ethics Committee review.
Selection of Instrumental Variables (IVs)
Initially, for the IV screening phase of our MR investigation, we implemented a genome-wide significance threshold ( ). Following that, we implemented SNP pruning within a window size of 10,000 kb, ensuring that the linkage disequilibrium (LD) between SNPs remained below the threshold of
  . The selected SNPs related to BMDs were retrieved from the GWAS data of the outcome, we further screened the extracted SNPs to remove those with non-concordant alleles and palindromic SNPs with ambiguous strands. Subsequently, we carefully assessed the IVs selected through the above process for any indications of weak instrument bias by using the F-statistic. To mitigate bias stemming from weak IVs, we discarded IVs with a F value below 10, thereby ensuring that only those with a F value exceeding 10 were retained. The calculation formula is
  ,
,  , where
  represents the coefficient of determination between the SNP and the exposure, N is the sample size, and k is the number of SNPs used as instruments.33
MR Statistical Analysis
The inverse-variance-weighted (IVW) approach was used as primary MR analysis method, which estimates the causal effect of gene-predicted exposure on outcome through a weighted regression of SNP-specific Wald ratios (ie, β outcome/β exposure).34 Cochran’s Q test and statistics were carried out to evaluate the heterogeneity of the instrumental genetic variable, and a
  indicated significant heterogeneity.35 When significant heterogeneity exists, the MR analysis concludes with the random effects IVW, whereas MR-Egger, weighted median, weighted mode, and simple mode were used as supplementary analysis methods.36 Conversely, fixed-effects IVW is employed when heterogeneity is absent. MR-Egger slopes are relatively effective as estimates of MR in the presence of horizontal pleiotropy (
 ). The weighted median method ensures the stability of causality estimates by eliminating errors in the presence of 50% invalid IVs, and may provide better causality detection than the MR-Egger under certain conditions.
Sensitivity Analysis
To test the robustness of our results, a “leave-one-out” analysis was conducted by deleting one SNP at a time to examine the influence of SNPs with potential horizontal pleiotropy on MR estimates.37 Furthermore, the MR-Egger intercept test was conducted. If the intercept term in the MR-Egger intercept analysis proved statistically significant, it indicated substantial horizontal pleiotropy within the study.38 A statistically significant result from the Cochran’s Q statistic test signified a significant level of heterogeneity within the analysis.39 To further enhance the reliability of our MR analysis, we implemented the MR-PRESSO method to identify and remove any potential outliers in our instrumental variable set. Outliers can distort MR results and affect the validity of causal inference.40 Finally, sensitivity analyses were visually illustrated using scatter, funnel, and forest plots to demonstrate the robustness of the MR study.
Statistical Analysis
In summary, our analysis strictly adhered to the following criteria: (i) All selected IVs were initially screened using Phenoscanner to exclude potential confounding effects on genetic variants; (ii) IVW analysis was used as the primary analytical method, with Bonferroni correction applied to determine statistical significance; (iii) Multiple MR analysis methods were integrated to ensure consistency in the direction and magnitude of the estimates; and (iv) A range of MR methodologies was employed to exclude heterogeneity and horizontal pleiotropy. All statistical analyses were conducted using the “TwoSampleMR”, “MRPRESSO”, and “MendelianRandomization” packages in R software (version 4.3.3). Based on Bonferroni correction, the threshold for statistical significance was set at  , and only results meeting this threshold were considered statistically significant.41 All p-values are two-tailed.
Results
Genetic Instrumental Variable Selection
In our study, a total of 658 LD-independent and suitable IVs were chosen from GWASs for CS, and finally extracted 81 SNPs for TB-BMD, 19 SNPs for FN-BMD, 3 SNPs for FA-BMD, and 24 SNPs for LS-BMD, 494 SNPs for HB-BMD, 8 SNPs for TB-BMD (0–15), 1 SNPs for TB-BMD (15–30), 9 SNPs for TB-BMD (30–45), 19 SNPs for TB-BMD (45–60), and 22 SNPs for TB-BMD (over 60), respectively. The MR results of this section were based on the SNPs screened under the genome-wide significance threshold (). These SNPs were derived from GWAS meta-analysis data, excluding linkage disequilibrium (LD), and  corresponded to an
  for every single variant. Thus, the selected IVs are robust, and “weak IVs” are negligible. The list of SNPs remaining was used for the subsequent MR analysis, as shown in Supplementary Tables 1–10.
Univariate Mendelian Randomization
According to the IVW estimator, genetically higher levels of TB-BMD (OR = 1.22, 95% CI: 1.10–1.34, P = 7.33E−05), FN-BMD (OR = 1.13, 95% CI: 1.02–1.25, P = 2.25E−03), LS-BMD (OR = 1.15, 95% CI: 1.05–1.27, P = 2.38E−03), and HB-BMD (OR = 1.09, 95% CI: 1.03–1.15, P = 2.15E−03) were significantly associated with an increased risk of CS. Other MR methods indicated a consistent direction of beta values, including MR-Egger (TB-BMD: OR = 1.13, 95% CI: 0.87–1.46, P = 3.71E−01; FN-BMD: OR = 1.70, 95% CI: 1.00–2.90, P = 6.58E−02; LS-BMD: OR = 0.83, 95% CI: 0.61–1.12, P = 2.31E−01) and weighted median (TB-BMD: OR = 1.15, 95% CI: 0.99–1.33, P = 6.40E−02; FN-BMD: OR = 1.15, 95% CI: 0.99–1.32, P = 6.94E−02; LS-BMD: OR = 1.14, 95% CI: 1.00–1.29, P = 3.98E−02; HB-BMD: OR = 1.04, 95% CI: 0.96–1.13, P = 3.29E−01), which can be interpreted as a positive result.42 After the Bonferroni correction, IVW method showed that only in the population of 45–60 years old, TB-BMD (per 1 SD increase) was potentially associated with a 14.8% increase in CS (OR = 1.16, 95% CI: 1.08–1.26; P = 1.84E-04). The weighted median analysis yielded similar significant results (OR = 1.13, 95% CI: 1.01–1.26; P = 3.29E−02), while the MR Egger analysis showed consistent but non-significant results (OR = 1.03, 95% CI: 0.77–1.38; P = 8.46E−01). All of the results are shown in Figure 2.
 |
Figure 2 Estimation of the causal relationship between BMDs and CS using different MR methods (Bonferroni-adjusted p-values highlighted in red indicate significant associations at P < 0.005). Abbreviations: CS, cervical spondylosis; TB-BMD, total body bone mineral density; FN-BMD, femoral neck bone mineral density; LS-BMD, lumbar spine bone mineral density; FA-BMD, forearm bone mineral density; HB-BMD, estimated heel bone mineral density; CI, confidence interval; nSNP, number of single nucleotide polymorphism; OR, odds ratio. |
Sensitivity Analysis
As shown in Table 2, the results of MR-PRESSO ensured that there were no outliers in the selected IVs (TB-BMD: P = 1.12E-01; FN-BMD: P = 4.60E-01; TB-BMD (45–60): P = 3.53E-01), when MR-Egger Intercept (TB-BMD: P = 5.37E-01; FN-BMD: P = 1.39E-01; TB-BMD (45–60): P = 4.10E-01) demonstrated the absence of horizontal pleiotropy in both studies. When testing HB-BMD selected IVs, we found P < 1.00E-03 even after eliminating all outliers. Consequently, an additional MR-Egger pleiotropy test was conducted on this study and indicated there was no horizontal pleiotropy. However, there existed a significant horizontal pleiotropy between IVs and outcomes which found by the MR-Egger pleiotropy test (P = 3.40E-02) between LS-BMD and CS. Heterogeneity was hypothesized in the study of TB-BMD (MR Egger: P = 9.10E-02; IVW: P = 9.80E-02), FN-BMD (MR Egger: P = 5.44E-01; IVW: P = 4.47E-01), HB-BMD (MR Egger: P = 6.10E-02; IVW: P = 6.30E-02), TB-BMD (45–60) (MR Egger: P = 3.26E-01; IVW: P = 3.42E-01), which may have effect on the risk of CS. And there was no proof to indicate the heterogeneity existing in the findings. The scatter plots for effect sizes of SNPs for BMDs on CS, include TB-BMD, FN-BMD, HB-BMD, TB-BMD (45–60) are depicted in Figure 3. And, the funnel plot displayed a mostly symmetrical distribution in Supplementary Figure 1, indicating the robustness of MR results. Finally, we present the results of the leave-one-out analysis in Supplementary Figure 2, which demonstrated that all of the identified relationships in the TB-BMD, FN-BMD, HB-BMD and TB-BMD (45–60) were not altered by a single SNP. Moreover, Supplementary Figures 3–9 presented forest plots of individual SNP effect analysis for BMDs by sites and ages on CS.
 |
Table 2 Sensitivity Analysis of Mendelian Randomization Studies of BMD and CS |
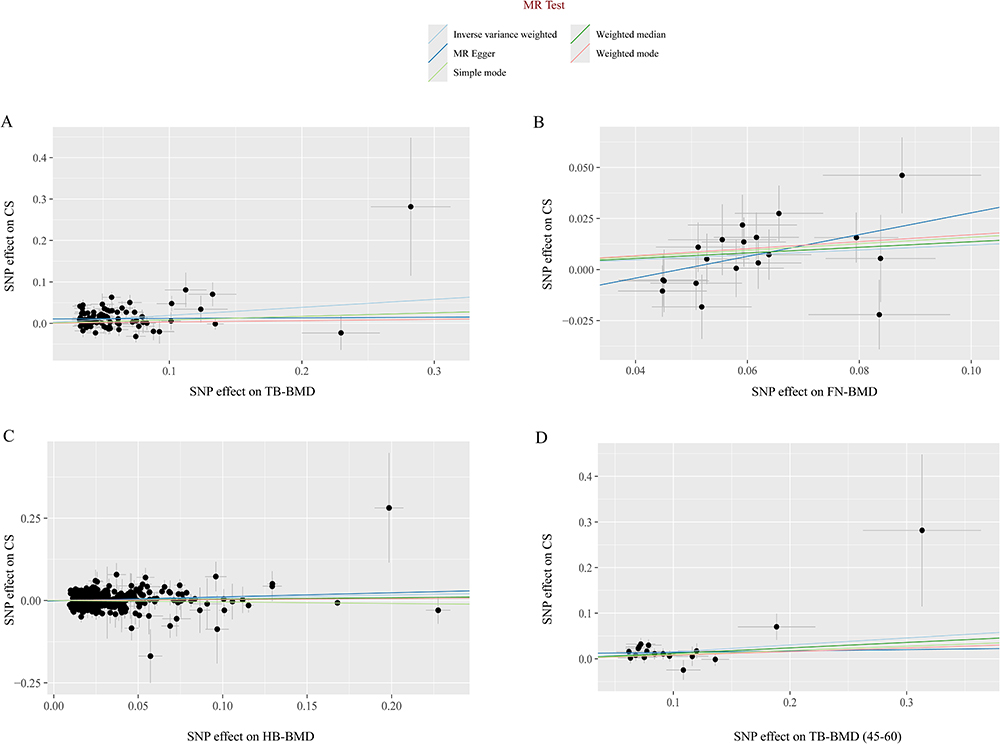 |
Figure 3 Scatter plots for the MR analysis, which explore the causal effect of BMDs on CS. (A) The scatter plot for TB-BMD on CS. (B) The scatter plot for FN-BMD on CS. (C) The scatter plot for HB-BMD on CS. (D) The scatter plot for TB-BMD (over 60) on CS. Abbreviations: CS, cervical spondylosis; TB-BMD, total body bone mineral density; FN-BMD, femoral neck bone mineral density; HB-BMD, heel bone mineral density. |
Multivariate Mendelian Randomization
To adjust for potential pleiotropic pathways that might confound the relationship between BMDs and CS, a MVMR model was utilized, incorporating adjustments for body mass index (BMI), type 2 diabetes mellitus (T2DM), hyperlipidemia and cigarette per day (CPD). The instrumental variables selected for MVMR implementation are presented in Supplementary Table 11. Multivariate IVW MR methods were used to estimate causality, which revealed that TB-BMD and HB-BMD still had a direct causal influence on CS (Adjusting for TB-BMD: OR = 1.14, 95% CI: 1.01–1.29; P = 3.12E −02; Adjusting for HB-BMD: OR = 1.11, 95% CI: 1.01–1.22; P = 2.45E −02). Figure 4 displayed strong evidence that genetically predicted TB-BMD and HB-BMD had a causal effect on CS. In contrast, the results of the MVMR IVW analysis revealed that TB-BMD (45–60) and FN-BMD did not have a direct causal effect on the risk of CS as previously predicted by UNMR (Adjusting for TB-BMD (45–60): OR = 1.03, 95% CI: 0.92–1.17; P = 5.93E −02; Adjusting for FN-BMD: OR = 0.93, 95% CI: 1.78–1.12; P = 4.62E −02).
 |
Figure 4 Forest plots of MVMR analyses examined causal associations between BMD and CS, adjusted for, T2DM, BMI, CPD, and hyperlipidemia. Abbreviations: BMI, body mass index; T2DM, type 2 diabetes mellitus; CPD, cigarette per day; TB-BMD, total body bone mineral density; FN-BMD, femoral neck bone mineral density; HB-BMD, estimated heel bone mineral density; CI, confidence interval; nSNP, number of single nucleotide polymorphism; OR, odds ratio. |
Reverse Mendelian Randomization
In the reverse Mendelian randomization (MR) analysis, we carefully screened 8 IVs with genome-wide significance levels ( ) of LD-independent (
 ) from the GWASs for CS (Supplementary Table 13). The F-statistics of the IVs for the selected CS were all greater than 10 to ensure that the selected IVs were sufficiently robust enough to eliminate the potential bias. Meanwhile, no outlier IVs were found in the MR-PRESSO analysis. Details for SNPs excluded were shown in Supplementary Table 12. Our investigation has revealed that the CS is causally associated with a risk of LS-BMD and HB-BMD (LS-BMD: OR = 1.12, 95% CI: 1.03–1.22, P = 1.02E −02; HB-BMD: OR = 0.96, 95% CI: 0.93–0.99, P = 1.13E −02). The results from Cochran’s Q test were as Supplementary Table 14 displayed: LS-BMD (MR Egger: P = 0.386; IVW: P = 4.47E −01); HB-BMD (MR Egger: P = 0.996; IVW: P = 9.81E −01). And MR-Egger regression results did not demonstrate a directional pleiotropy effect amongst all genetic variants (LS-BMD: P = 5.21E −01; HB-BMD: P = 8.77E −01). However, the results of both two BMD levels in IVW did not reach statistical significance after applying Bonferroni correction (significance threshold set at P < 0.005 (0.05/10)), thus we did not perform any other MR pleiotropy tests.
Discussion
The correlation between BMD and CS has long been a focus of medical research, yet definitive conclusions remain absent. To the best of our knowledge, this study represents the first MR investigation to explore the causal relationship between BMD and CS.43 Utilizing large-scale GWAS data, we found that elevated TB-BMD, FN-BMD, HB-BMD, and TB-BMD (45–60 years) exhibit direct causal effects on CS after Bonferroni correction. MVMR analysis further revealed that TB-BMD and HB-BMD maintain independent and significant causal associations with CS even after adjusting for confounding factors.
From a public health perspective, we recommend routine BMD screening for adults aged 45–60 years to assess CS risk. For those identified with high BMD levels, appropriate preventive strategies including postural management improvement and neck core muscle strengthening should be implemented to reduce cervical mechanical load. Notably, although MVMR analysis has demonstrated that BMD independently promotes CS progression regardless of confounders, clinical interventions must still consider systemic factors such as basal metabolic status. For instance, Hong et al found that individuals with higher BMD exhibit elevated BMI, attributing this phenomenon to compensatory forward head posture caused by airway volume reduction due to adipose accumulation. This postural alteration disrupts the correspondence between cervical BMD distribution and load distribution, thereby impacting vertebral strength and health.14 Thus, health education for at-risk populations should not focus solely on bone metabolism and vertebral quality but should also emphasize comprehensive improvements in systemic health, including appropriate aerobic exercise and strength training to facilitate weight management, enhance circulation, and promote nutrient supply.
BMD serves as a critical indicator of bone strength, yet high bone density does not necessarily equate to optimal bone quality or microstructure.44 Our findings align with several previous cross-sectional and retrospective studies. For example, Hong et al reported in a 2021 cross-sectional study of 116 patients that postmenopausal women with high BMD may experience greater neck pain severity and accelerated cervical degeneration accompanied by forward head posture alterations.45 Through a micro-computed tomography (μCT) scanning system, Wang et al found that greater vertebral BMD correlated with more severe disc degeneration.46 A study of participants under 64 years old yielded consistent results, showing that individuals with progressive intervertebral disc degenerative changes tend to exhibit elevated BMD in the lumbar spine and hips.47 To better observe and measure bone morphology, microstructure, and mineral heterogeneity in aging zebrafish spines, Erika et al suppressed bone resorption via cathepsin K regulation, identifying a significant association between increased BMD and disc degeneration.20 Contrary to conventional views, middle-aged adults with high BMD are more likely to impact adjacent discs through increased nucleus pulposus pressure caused by compact vertebral bone.48 In patients with OP, having lower BMD actually helps nutrients reach the intervertebral discs more easily. This happens through several pathways: endplate vascularization, reduced endplate resistance and decreased intradiscal strain.17 This occurs because intervertebral discs are largely avascular, with only minimal capillaries present in the outer annulus. Consequently, their primary nutrient supply relies on diffusion through the upper and lower cartilage endplates. Elevated BMD increases endplate static pressure, thereby impairing the diffusion of essential nutrients (eg, glucose) into discs.49 Helen et al further validated this hypothesis by assessing vertebral endplate calcification grades in aged gerbils through BMD analysis. They demonstrated that higher BMD correlates with increased endplate calcification tendency, resulting in diminished vascular supply to discs, whereas lower BMD promotes nutrient diffusion from disc peripheries, slowing degeneration progression.50
Given the biological mechanisms linking BMD to CS, future clinical practice should consider direct measurement of cervical BMD as a primary tool for predicting CS progression. Compared to other skeletal regions, this approach maximizes prediction accuracy. However, the complex anatomical structure of cervical spine imposes higher technical demands on BMD measurement. Although DXA remains the gold standard for BMD assessment, it is not entirely suitable for evaluating CS susceptibility due to potential measurement errors caused by extensive degeneration such as posterior longitudinal ligament calcification, ligamentum flavum hypertrophy or calcification, and nodular changes in advanced CS stages.51 Statistics indicate that preoperative DXA screening rates for spinal fusion surgeries are as low as 12%, with even fewer cervical surgery patients receiving preoperative DXA evaluations.52,53 Compared to DXA, quantitative computed tomography (QCT) enables more accurate three-dimensional analysis but faces limitations due to radiation exposure and cost.54 The lack of effective detection methods partially explains the paucity of research in this field over past decades. Recently, the MRI-based vertebral bone quality (VBQ) score derived from T1-weighted imaging has gained attention for its feasibility in assessing cervical bone quality, demonstrating strong correlation with DXA-measured lumbar BMD.55 In a recent retrospective study, Chen et al innovatively analyzed the relationship between cervical VBQ scores and QCT-measured BMD, highlighting VBQ as a quantitative indicator of cervical BMD in CS patients. Additionally, this study revealed that in CS patients over 50 years old, increased BMD in both caudal vertebral bodies and sub-endplate regions significantly correlates with aggravated cervical disc degeneration.19 Currently, VBQ scoring has been widely adopted for preoperative cervical BMD assessment to predict postoperative outcomes such as cage subsidence and titanium mesh complications.56,57 This clinically efficient and safe method shows promise as a screening tool for CS susceptibility in postmenopausal women and elderly males, aiding diagnostic and early therapeutic decision-making with broad applications in our aging global population.
Despite substantial evidence supporting our conclusions, conflicting perspectives persist. In a retrospective investigation, Astrid et al used QCT to scan BMD in at least three thoracolumbar segments of 134 patients, concluding that degenerative spinal changes may correlate with reduced regional spinal mineralization.58 Liang et al measured Hounsfield unit (HU) values in C3-C7 vertebrae of 324 degenerative CS patients, finding the highest HU values in the upper C4 vertebra with gradual decreases toward C3 and C7. They hypothesized that vertebral BMD reduction might trigger or exacerbate adjacent disc degeneration.9 The cause of this alteration might involve insufficient nutrient replenishment of the disc cells, as well as poor bone quality, resulting in thinning of the endplates and an increase in microfractures.59 It must be emphasized that these studies are observational in nature, limited by their inability to establish causality. Furthermore, compared to MR analysis, observational studies exhibit weaker control over confounders even with strict standardization protocols, whereas MR effectively addresses these issues.60 We found that several prior MR studies exploring the relationship between BMD and intervertebral disc degeneration reached conflicting conclusions, which may stem from heterogeneous data sources involving different spinal segments.10,11,61 Moreover, extrapolating thoracolumbar findings to the cervical spine risks erroneous conclusions. Jacob et al demonstrated through analysis of anthropometric and regional VBQ measures that thoracic VBQ scores directly reflect lumbar vertebral bone quality, whereas cervical measurements do not.62 In our UVMR, LS-BMD also exhibited significant horizontal pleiotropy with CS. Consequently, independent investigation of the causal relationship between BMD and CS remains essential.
In summary, the strengths of this study are as follows: First, we utilized the publicly available GWAS datasets to examine causal relationships between BMD (covering five age groups and four skeletal sites) and CS, representing the largest sample size in related research to date. Simultaneously, we mitigated the impact of confounding factors and reverse causation on our conclusions. Second, by restricting our analysis to individuals of European ancestry, we minimized potential biases from population stratification. Third, our multi-database sampling strategy enhanced geographical diversity while avoiding statistical errors from sample overlap. Fourth, as shared covariates for both OP and CS, age and sex were adjusted for in multivariable statistical models. Our study further stratified BMD data by age and conducted subgroup analyses to assess their effects on CS.
Nonetheless, limitations remain. Initially, as only European populations were analyzed due to the absence of large-scale GWAS data from other ethnicities, generalization of results to other populations requires caution. Secondly, adjusting for confounders in the MVMR analysis reduced the number of available IVs, potentially increasing false-negative findings. The stringent Bonferroni correction may have further limited the detection of true positive associations. These limitations highlight the need for future MR studies with larger sample sizes or RCTs. Finally, more comprehensive mechanistic investigations are required to elucidate the precise biological pathways linking BMD and CS before clinical translation.
Conclusion
This study conclusively demonstrates that elevated BMD levels negatively impact cervical spine health, and provides novel genetic insights into predicting and treating CS. Overall, our findings indicate that individuals with high TB-BMD, FN-BMD, and HB-BMD levels—particularly those aged 45–60 years—should be vigilant for the development of CS. These results lay a foundation for future research, and the positive causal relationships are supported by existing evidence. Further studies are required to explore CS prevention via BMD modulation and to develop personalized therapeutic strategies for CS patients.
Supplementary Materials
The Supplementary Material includes Supplementary Figures 1–9 and Supplementary Tables 1–13.
Data Sharing Statement
The original contributions presented in the study are included in the article/Supporting Materials. Further inquiries can be directed to the corresponding authors.
Ethics Approval and Consent to Participate
This study was based on previously published, anonymized GWAS summary statistics that are publicly available and fully de-identified, with no access to individual-level or personally identifiable information. According to Items 1 and 2 of the Measures for Ethical Review of Life Science and Medical Research Involving Human Subjects (effective February 18, 2023, China), such research is exempt from ethical review. Therefore, no additional institutional ethical approval was required.
Acknowledgments
We acknowledge the participants and investigators of the FinnGen study and GEFOS consortium.
Funding
This work was supported by the 2024 Zhejiang Province Pioneer and Leader R&D Breakthrough Program (2024C03213).
Disclosure
The authors declare no competing interests.
References
1. Clynes MA, Harvey NC, Curtis EM, et al. The epidemiology of osteoporosis. Br Med Bull. 2020;133(1):105–117. doi:10.1093/bmb/ldaa005
2. Ahern DP, McDonnell JM, Riffault M, et al. A meta-analysis of the diagnostic accuracy of Hounsfield units on computed topography relative to dual-energy X-ray absorptiometry for the diagnosis of osteoporosis in the spine surgery population. Spine J. 2021;21(10):1738–1749. doi:10.1016/j.spinee.2021.03.008
3. Rentzeperi E, Pegiou S, Tsakiridis I, et al. Diagnosis and management of osteoporosis: a comprehensive review of guidelines. Obstet Gynecol Surv. 2023;78(11):657–681. doi:10.1097/ogx.0000000000001181
4. Bainbridge NJ, Davie MW, Haddaway MJ. Bone loss after stroke over 52 weeks at os calcis: influence of sex, mobility and relation to bone density at other sites. Age Ageing. 2006;35(2):127–132. doi:10.1093/ageing/afj045
5. Gregson CL, Armstrong DJ, Bowden J, et al. UK clinical guideline for the prevention and treatment of osteoporosis. Arch Osteoporos. 2022;17(1):58. doi:10.1007/s11657-022-01061-5
6. Kuo DT, Tadi P. Cervical spondylosis. 2024.
7. Safiri S, Kolahi AA, Hoy D, et al. Global, regional, and national burden of neck pain in the general population, 1990-2017: systematic analysis of the global burden of disease study 2017. BMJ. 2020;368:m791. doi:10.1136/bmj.m791
8. Williams J, D’Amore P, Redlich N, et al. Degenerative cervical myelopathy: evaluation and management. Orthop Clin North Am. 2022;53(4):509–521. doi:10.1016/j.ocl.2022.05.007
9. Liang X, Liu Q, Xu J, et al. Hounsfield unit for assessing bone mineral density distribution within cervical vertebrae and its correlation with the intervertebral disc degeneration. Front Endocrinol. 2022;13(920167). doi:10.3389/fendo.2022.920167
10. Liu G, Zhang H, Chen M, et al. Causal relationship between intervertebral disc degeneration and osteoporosis: a bidirectional two-sample Mendelian randomization study. Front Endocrinol. 2024;15(1298531). doi:10.3389/fendo.2024.1298531
11. Zhao J, Wang J, Xu H, et al. Intervertebral disk degeneration and bone mineral density: a bidirectional Mendelian randomization study. Calcif Tissue Int. 2024;114(3):228–236. doi:10.1007/s00223-023-01165-1
12. Lee MJ, Dettori JR, Standaert CJ, et al. The natural history of degeneration of the lumbar and cervical spines: a systematic review. Spine. 2012;37(22 Suppl):S18–30. doi:10.1097/BRS.0b013e31826cac62
13. Kettler A, Wilke HJ. Review of existing grading systems for cervical or lumbar disc and facet joint degeneration. Eur Spine J. 2006;15(6):705–718. doi:10.1007/s00586-005-0954-y
14. Hong SW, Park KT, Chung YS, et al. Bone mineral density, cervical spine degeneration, head and neck posture, and neck pain in the post-menopausal females: a pilot study. PLoS One. 2021;16(9):e0257735. doi:10.1371/journal.pone.0257735
15. Vo NV, Hartman RA, Patil PR, et al. Molecular mechanisms of biological aging in intervertebral discs. J Orthop Res. 2016;34(8):1289–1306. doi:10.1002/jor.23195
16. Turgut M, Uslu S, Uysal A, et al. Changes in vascularity of cartilage endplate of degenerated intervertebral discs in response to melatonin administration in rats. Neurosurg Rev. 2003;26(2):133–138. doi:10.1007/s10143-003-0259-8
17. Mattei TA. Osteoporosis delays intervertebral disc degeneration by increasing intradiscal diffusive transport of nutrients through both mechanical and vascular pathophysiological pathways. Med Hypotheses. 2013;80(5):582–586. doi:10.1016/j.mehy.2013.01.030
18. Żuchowski P, Dura M, Jeka D, et al. Osteoporosis in axial radiographic spondyloarthritis: diagnostic limitations of bone mineral density and the need for comprehensive fracture risk assessment. Reumatologia. 2024;62(6):466–474. doi:10.5114/reum/194107
19. Chen JY, Yang JC, Li RY, et al. The degree of cervical intervertebral disc degeneration is associated with denser bone quality of the cervical sub-endplate and vertebral body. Orthop Surg. 2025;17(2):460–469. doi:10.1111/os.14310
20. Kague E, Turci F, Newman E, et al. 3D assessment of intervertebral disc degeneration in zebrafish identifies changes in bone density that prime disc disease. Bone Res. 2021;9(1):39. doi:10.1038/s41413-021-00156-y
21. Wada K, Tanaka T, Kumagai G, et al. A study of the factors associated with cervical spinal disc degeneration, with a focus on bone metabolism and amino acids, in the Japanese population: a cross sectional study. BMC Musculoskelet Disord. 2018;19(1):153. doi:10.1186/s12891-018-2055-1
22. Holmes MV, Ala-Korpela M, Smith GD. Mendelian randomization in cardiometabolic disease: challenges in evaluating causality. Nat Rev Cardiol. 2017;14(10):577–590. doi:10.1038/nrcardio.2017.78
23. Palmer TM, Lawlor DA, Harbord RM, et al. Using multiple genetic variants as instrumental variables for modifiable risk factors. Stat Methods Med Res. 2012;21(3):223–242. doi:10.1177/0962280210394459
24. Burgess S, Foley CN, Allara E, et al. A robust and efficient method for Mendelian randomization with hundreds of genetic variants. Nat Commun. 2020;11(1):376. doi:10.1038/s41467-019-14156-4
25. Hou W, Chen S, Zhu C, et al. Associations between smoke exposure and osteoporosis or osteopenia in a US NHANES population of elderly individuals. Front Endocrinol. 2023;14(1074574). doi:10.3389/fendo.2023.1074574
26. Kammire DE, Walkup MP, Ambrosius WT, et al. Effect of weight change following intentional weight loss on bone health in older adults with obesity. Obesity. 2019;27(11):1839–1845. doi:10.1002/oby.22604
27. Ahmad OS, Leong A, Miller JA, et al. A Mendelian randomization study of the effect of type-2 diabetes and glycemic traits on bone mineral density. J Bone Miner Res. 2017;32(5):1072–1081. doi:10.1002/jbmr.3063
28. Huang CY, Cheng M, Wang PH. The negative correlation between osteoporosis and hyperlipidemia: is it real? Taiwan J Obstet Gynecol. 2020;59(3):471–472. doi:10.1016/j.tjog.2020.03.029
29. Zheng HF, Forgetta V, Hsu YH, et al. Whole-genome sequencing identifies EN1 as a determinant of bone density and fracture. Nature. 2015;526(7571):112–117. doi:10.1038/nature14878
30. Morris JA, Kemp JP, Youlten SE, et al. An atlas of genetic influences on osteoporosis in humans and mice. Nat Genet. 2019;51(2):258–266. doi:10.1038/s41588-018-0302-x
31. Medina-Gomez C, Kemp JP, Trajanoska K, et al. Life-course genome-wide association study meta-analysis of total body BMD and assessment of age-specific effects. Am J Hum Genet. 2018;102(1):88–102. doi:10.1016/j.ajhg.2017.12.005
32. Kurki MI, Karjalainen J, Palta P, et al. FinnGen provides genetic insights from a well-phenotyped isolated population. Nature. 2023;613(7944):508–518. doi:10.1038/s41586-022-05473-8
33. Burgess S, Thompson SG. Avoiding bias from weak instruments in Mendelian randomization studies. Int J Epidemiol. 2011;40(3):755–764. doi:10.1093/ije/dyr036
34. Richmond RC, Davey Smith G. Mendelian randomization: concepts and scope. Cold Spring Harb Perspect Med. 2022;12(1):a040501. doi:10.1101/cshperspect.a040501
35. Bowden J, Spiller W, Del Greco MF, et al. Improving the visualization, interpretation and analysis of two-sample summary data Mendelian randomization via the radial plot and radial regression. Int J Epidemiol. 2018;47(4):1264–1278. doi:10.1093/ije/dyy101
36. Bowden J, Davey Smith G, Haycock PC, et al. Consistent estimation in Mendelian randomization with some invalid instruments using a weighted median estimator. Genet Epidemiol. 2016;40(4):304–314. doi:10.1002/gepi.21965
37. Hemani G, Bowden J, Davey Smith G. Evaluating the potential role of pleiotropy in Mendelian randomization studies. Hum Mol Genet. 2018;27(R2):R195–r208. doi:10.1093/hmg/ddy163
38. Bowden J, Del Greco MF, Minelli C, et al. Improving the accuracy of two-sample summary-data Mendelian randomization: moving beyond the NOME assumption. Int J Epidemiol. 2019;48(3):728–742. doi:10.1093/ije/dyy258
39. Bakbergenuly I, Hoaglin DC, Kulinskaya E. On the Q statistic with constant weights for standardized mean difference. Br J Math Stat Psychol. 2022;75(3):444–465. doi:10.1111/bmsp.12263
40. Verbanck M, Chen CY, Neale B, et al. Publisher correction: detection of widespread horizontal pleiotropy in causal relationships inferred from Mendelian randomization between complex traits and diseases. Nat Genet. 2018;50(8):1196. doi:10.1038/s41588-018-0164-2
41. Sedgwick P. Multiple hypothesis testing and bonferroni’s correction. BMJ. 2014;349:g6284. doi:10.1136/bmj.g6284
42. Qiu Y, Wei X, Tao Y, et al. Causal association of leisure sedentary behavior and cervical spondylosis, sciatica, intervertebral disk disorders, and low back pain: a Mendelian randomization study. Front Public Health. 2024;12(1284594). doi:10.3389/fpubh.2024.1284594
43. Theodore N. Degenerative cervical spondylosis. N Engl J Med. 2020;383(2):159–168. doi:10.1056/NEJMra2003558
44. Mello JB, Rodríguez-Rodríguez F, Gracia-Marco L, et al. Speed, agility, and musculoskeletal fitness are independently associated with areal bone mineral density in children. Front Physiol. 2023;14(1080091). doi:10.3389/fphys.2023.1080091
45. Susarla SM, Abramson ZR, Dodson TB, et al. Cephalometric measurement of upper airway length correlates with the presence and severity of obstructive sleep apnea. J Oral Maxillofacial Surg. 2010;68(11):2846–2855. doi:10.1016/j.joms.2010.06.196
46. Wang Y, Boyd SK, Battié MC, et al. Is greater lumbar vertebral BMD associated with more disk degeneration? A study using µCT and discography. J Bone Miner Res. 2011;26(11):2785–2791. doi:10.1002/jbmr.476
47. Livshits G, Ermakov S, Popham M, et al. Evidence that bone mineral density plays a role in degenerative disc disease: the UK Twin Spine study. Ann Rheum Dis. 2010;69(12):2102–2106. doi:10.1136/ard.2010.131441
48. Adams M, Dolan P. Vertebral fracture and intervertebral discs. J Bone Miner Res. 2012;27(6):1432; authorreply1433–4. doi:10.1002/jbmr.1626
49. Rajasekaran S, Venkatadass K, Naresh Babu J, et al. Pharmacological enhancement of disc diffusion and differentiation of healthy, ageing and degenerated discs: results from in-vivo serial post-contrast MRI studies in 365 human lumbar discs. Eur Spine J. 2008;17(5):626–643. doi:10.1007/s00586-008-0645-6
50. Gruber HE, Gordon B, Williams C, et al. Vertebral endplate and disc changes in the aging sand rat lumbar spine: cross-sectional analyses of a large male and female population. Spine. 2007;32(23):2529–2536. doi:10.1097/BRS.0b013e318158cd69
51. Rezaei A, Giambini H, Rossman T, et al. Are DXA/aBMD and QCT/FEA stiffness and strength estimates sensitive to sex and age? Ann Biomed Eng. 2017;45(12):2847–2856. doi:10.1007/s10439-017-1914-5
52. Mao SS, Li D, Syed YS, et al. Thoracic Quantitative Computed Tomography (QCT) can sensitively monitor bone mineral metabolism: comparison of thoracic QCT vs lumbar QCT and dual-energy X-ray absorptiometry in detection of age-relative change in bone mineral density. Acad Radiol. 2017;24(12):1582–1587. doi:10.1016/j.acra.2017.06.013
53. Allen RT, Lee YP, Garfin SR. Spine surgeons survey on attitudes regarding osteoporosis and osteomalacia screening and treatment for fractures, fusion surgery, and pseudoarthrosis. Spine J. 2009;9(7):602–604. doi:10.1016/j.spinee.2009.05.002
54. Li N, XM L, Xu L, et al. Comparison of QCT and DXA: osteoporosis detection rates in postmenopausal women. Int J Endocrinol. 2013;2013(895474):1–5. doi:10.1155/2013/895474
55. Ehresman J, Pennington Z, Schilling A, et al. Novel MRI-based score for assessment of bone density in operative spine patients. Spine J. 2020;20(4):556–562. doi:10.1016/j.spinee.2019.10.018
56. Li Q, Zhu C, Xia Q, et al. The association between high preoperative MRI-based Vertebral Bone Quality (VBQ) score and titanium mesh cage subsidence after anterior cervical corpectomy and fusion. Orthop Surg. 2024;16(2):303–311. doi:10.1111/os.13931
57. Soliman MAR, Aguirre AO, Kuo CC, et al. A novel cervical vertebral bone quality score independently predicts cage subsidence after anterior cervical diskectomy and fusion. Neurosurgery. 2023;92(4):779–786. doi:10.1227/neu.0000000000002269
58. Grams AE, Rehwald R, Bartsch A, et al. Correlation between degenerative spine disease and bone marrow density: a retrospective investigation. BMC Med Imaging. 2016;16(17). doi:10.1186/s12880-016-0123-2
59. Wáng YXJ, Guglielmi G, Guermazi A, et al. Much lower prevalence and severity of spine degenerative changes among older Chinese women than among older caucasian women and its implication for the interpretation of lumbar spine BMD T-score for Chinese women. Skeletal Radiol. 2024;53(2):247–251. doi:10.1007/s00256-023-04419-z
60. Zhao SS, Mackie SL, Zheng J. Why clinicians should know about Mendelian randomization. Rheumatology. 2021;60(4):1577–1579. doi:10.1093/rheumatology/keab007
61. Li L, Li D, Geng Z, et al. Causal relationship between bone mineral density and intervertebral disc degeneration: a univariate and multivariable mendelian randomization study. BMC Musculoskelet Disord. 2024;25(1):517. doi:10.1186/s12891-024-07631-7
62. Razzouk J, Ramos O, Ouro-Rodrigues E, et al. Comparison of cervical, thoracic, and lumbar vertebral bone quality scores for increased utility of bone mineral density screening. Eur Spine J. 2023;32(1):20–26. doi:10.1007/s00586-022-07484-5
 © 2025 The Author(s). This work is published and licensed by Dove Medical Press Limited. The
full terms of this license are available at https://www.dovepress.com/terms.php
and incorporate the Creative Commons Attribution
- Non Commercial (unported, 4.0) License.
By accessing the work you hereby accept the Terms. Non-commercial uses of the work are permitted
without any further permission from Dove Medical Press Limited, provided the work is properly
attributed. For permission for commercial use of this work, please see paragraphs 4.2 and 5 of our Terms.
© 2025 The Author(s). This work is published and licensed by Dove Medical Press Limited. The
full terms of this license are available at https://www.dovepress.com/terms.php
and incorporate the Creative Commons Attribution
- Non Commercial (unported, 4.0) License.
By accessing the work you hereby accept the Terms. Non-commercial uses of the work are permitted
without any further permission from Dove Medical Press Limited, provided the work is properly
attributed. For permission for commercial use of this work, please see paragraphs 4.2 and 5 of our Terms.