")
Back to Journals » Journal of Inflammation Research » Volume 17
Exploring Cuproptosis-Related Genes and Diagnostic Models in Renal Ischemia-Reperfusion Injury Using Bioinformatics, Machine Learning, and Experimental Validation
Authors Xu C , Deng Y, Gong X, Wang H, Man J, Wang H, Cheng K, Gui H, Fu S, Wei S, Zheng X, Che T, Ding L, Yang L
Received 4 September 2024
Accepted for publication 14 November 2024
Published 18 November 2024 Volume 2024:17 Pages 8997—9020
DOI https://doi.org/10.2147/JIR.S490357
Checked for plagiarism Yes
Review by Single anonymous peer review
Peer reviewer comments 2
Editor who approved publication: Dr Tara Strutt
Changhong Xu,1,* Yun Deng,1,* Xinyi Gong,2,* Huabin Wang,1 Jiangwei Man,1 Hailong Wang,1 Kun Cheng,1 Huiming Gui,1 Shengjun Fu,1 Shenghu Wei,3 Xiaoling Zheng,4 Tuanjie Che,4 Liyun Ding,3 Li Yang1
1Department of Urology, Institute of Urology, Gansu Province Clinical Research Center for Urinary System Disease, Lanzhou University Second Hospital, Lanzhou, Gansu, 730030, People’s Republic of China; 2The Second Clinical Medical College of Lanzhou University, Lanzhou, Gansu, 730030, People’s Republic of China; 3School of Physical Science and Technology, Lanzhou University, Lanzhou, 730000, People’s Republic of China; 4Innovation Center of Functional Genomics and Molecular Diagnostics Technology of Gansu Province, Lanzhou, People’s Republic of China
*These authors contributed equally to this work
Correspondence: Li Yang; Liyun Ding, Email [email protected]; [email protected]
Background: Renal ischemia-reperfusion injury (RIRI) is a significant cause of acute kidney injury, complicating clinical interventions such as kidney transplants and partial nephrectomy. Recent research has indicated the role of cuproptosis, a copper-dependent cell death pathway, in various pathologies, but its specific involvement in RIRI remains insufficiently understood. This study aims to investigate the role of cuproptosis-related genes in RIRI and establish robust diagnostic models.
Methods: We analyzed transcriptomic data from 203 RIRI and 188 control samples using bioinformatics tools to identify cuproptosis-related differentially expressed genes (CRDEGs). The relationship between CRDEGs and immune cells was explored using immune infiltration analysis and correlation analysis. Gene Set Enrichment Analysis (GSEA) was conducted to identify pathways associated with CRDEGs. Machine learning models, including Least Absolute Shrinkage and Selection Operator(LASSO) logistic regression, Support Vector Machine Recursive Feature Elimination (SVM-RFE), Clustering analysis, and weighted gene co-expression network analysis (WGCNA), were used to construct diagnostic gene models. The models were validated using independent datasets. Experimental validation was conducted in vivo using a mouse bilateral RIRI model and in vitro using an HK-2 cell hypoxia-reoxygenation (HR) model with copper chelation intervention. HE, PAS, and TUNEL staining, along with plasma creatinine and blood urea nitrogen (BUN) measurements, were used to evaluate the protective effect of the copper chelator D-Penicillamine (D-PCA) on RIRI in mice. JC-1 and TUNEL staining were employed to assess apoptosis in HK-2 cells under hypoxia-reoxygenation conditions. Immunofluorescence and Western blot (WB) techniques were used to verify the expression levels of the SDHB and NDUFB6 genes.
Results: A total of 18 CRDEGs were identified, many of which were significantly correlated with immune cell infiltration. GSEA revealed that these genes were involved in pathways related to oxidative phosphorylation and immune response regulation. Four key cuproptosis marker genes (LIPA, LIPT1, SDHB, and NDUFB6) were incorporated into a Cuproptosis Marker Gene Model(CMGM), achieving an area under the curve (AUC) of 0.741– 0.834 in validation datasets. In addition, a five-hub-gene SVM model (MOAP1, PPP2CA, SYL2, ZZZ3, and SFRS2) was developed, demonstrating promising diagnostic performance. Clustering analysis revealed two RIRI subtypes (C1 and C2) with distinct molecular profiles and pathway activities, particularly in oxidative phosphorylation and immune responses. Experimental results showed that copper chelation alleviated renal damage and cuproptosis in both in vivo and in vitro models.
Conclusion: Our study reveals that cuproptosis-related genes are significantly involved in RIRI, particularly influencing mitochondrial dysfunction and immune responses. The diagnostic models developed showed promising predictive performance across independent datasets. Copper chelation demonstrated potential therapeutic effects, suggesting that cuproptosis regulation may be a viable therapeutic strategy for RIRI. This work provides a foundation for further exploration of copper metabolism in renal injury contexts.
Keywords: cuproptosis, renal ischemia-reperfusion injury, RIRI, gene diagnostic models, copper chelators, bioinformatics analysis
Introduction
Renal ischemia-reperfusion injury (RIRI) refers to a pathological phenomenon that occurs during clinical procedures such as kidney transplant surgeries and partial nephrectomy, where the pathology of the ischemic kidney worsens instead of improving with the resumption of blood flow.1 This phenomenon has become one of the primary sources of acute kidney injury in patients and presents a significant clinical challenge for modern urological surgeons. The pathomechanisms of RIRI involve oxidative stress imbalance, mitochondrial dysfunction, inflammatory cascade reactions, and endoplasmic reticulum stress.2,3 However, the current understanding of the pathological mechanisms of RIRI is still insufficient, and potential therapeutic targets and mechanisms urgently need to be identified and explored.
Copper is a fundamental trace element that plays a crucial role in various biochemical processes in cells, such as mitochondrial energy metabolism, biomolecular synthesis, and antioxidant responses.4,5 Appropriate copper concentrations are essential for maintaining cellular functions, as even minor changes in copper levels can trigger cytotoxic responses and even lead to cell death.6 Instability in copper concentrations is associated with the development of various diseases, such as genetic copper metabolism disorders like Wilson’s disease and Menkes disease,7 as well as certain cancers and inflammatory diseases,8 which are often related to copper metabolic imbalance. Recent studies have revealed that copper overload can induce a unique mode of programmed cell death, distinct from known pathways such as autophagy, apoptosis, or ferroptosis.6 In this process, copper directly interacts with key proteins in the tricarboxylic acid (TCA) cycle through thioacylation, thereby affecting the normal function of proteins and cellular energy metabolism. This thioacylation not only leads to the dysfunction of crucial proteins but also triggers dysfunction in iron-sulfur (Fe-S) clusters, causing protein aggregation and cellular stress responses, ultimately leading to cell death.9
In the kidney, copper complexes are filtered through the glomeruli, and copper is reabsorbed from the primary urine by epithelial cells in the proximal tubules. Subsequently, copper ions are transferred back into the circulation through the activity of Cu-ATPases.10 Due to kidney-mediated copper cycling, only 2% of this trace element is excreted in the urine.11 Recent studies have confirmed that an increase in urinary copper levels may indicate a higher likelihood of acute kidney injury (AKI) in the kidneys.12 Therefore, during the RIRI process, the initial damage to the tubular epithelial cells may lead to changes in the body’s copper homeostasis; secondly, hypoxia-induced decline in mitochondrial respiration may feedback negatively affect intracellular copper levels. Some studies also suggest a potential link between cuproptosis and other renal diseases, such as renal clear cell carcinoma13 and chronic kidney disease,14 which has greatly sparked interest in its therapeutic potential. However, research on the role of copper homeostasis or cuproptosis in RIRI remains relatively limited. In this study, we aim to investigate the role of cuproptosis-related genes in RIRI and establish diagnostic models to better understand the potential therapeutic applications of targeting cuproptosis in this condition.
Materials and Methods
Patients and Dataset
The transcriptomic analysis data for RIRI samples were obtained from the GSE43974 dataset in the Gene Expression Omnibus (GEO) database. All samples from T1 stage (kidney biopsy taken before organ retrieval in deceased donors), including BD, DCD, and Living samples, were considered pre-ischemic samples (control group). All samples from T3 stage (60 minutes after reperfusion), including BD, DCD, and Living samples, were considered post-reperfusion samples (RIRI group). After compilation, a total of 188 control group samples and 203 RIRI group samples were collected. From previous literature, 38 CRGs (Copper-Related Genes) such as ATP7A, ATP7B, ACO2, CDKN2A, DBT, DLAT, DLD, DLST, DPYD, FDX1, GCSH, GLRX5, GLS, ISCA2, LIAS, LIPA, LIPT1, LIPT2, LIPM, MTF1, NDUFA1, NDUFA8, NDUFB10, NDUFB2, NDUFB6, NLRP3, NDUFC1, NDUFC2, NDUFV2, NFE2L2, PDHA1, PLAT, PDHB, POLD1, PPAT, SLC31A1, SDHB, and TIMMDC1 were collected.15 The relevant process is shown in Figure 1.
 |
Figure 1 Flowchart delineating the investigation of the diagnostic potential of cuproptosis-related genes in RIRI through an integrative approach of bioinformatics, machine learning, and experimental validation in vitro and in vivo. |
Differential Analysis and Visualization of CRGs in RIRI
Using R language and associated packages (limma, pheatmap, reshape2, ggpubr), the gene expression data for the CRGs were analyzed. The average expression values were computed using avereps, and the Wilcoxon rank-sum test was used to identify differentially expressed genes (DEGs) with p < 0.05. Heatmaps and box plots were created using pheatmap and ggplot2 respectively, to visualize expression patterns and validate significant differences between groups. A subset of genes with significant differences in this dataset was termed CRDEGs.
Correlation Analysis Among CRDEGs
R language, along with the corrplot and circlize packages, was used for analyzing and visualizing the correlation among the differentially expressed genes. Focusing on the IRI group samples, the calculated inter-gene correlation matrix was used to generate two types of graphical representations: a circular plot and a correlation matrix plot. The circular plot was drawn using the chordDiagram function, showing the strength and direction of correlations between genes. The correlation matrix plot was generated using the corrplot function in a pie chart style to display correlation coefficients.
Immune Infiltration Analysis
We employed the CIBERSORT algorithm to analyze and interpret the expression patterns of immune cells within gene expression data. Initially, immune cell expression data were imported using scripts implemented in R. The dataset comprised samples from control and treatment groups, which were successfully categorized using regular expressions. For visualization purposes, we processed the data and generated graphical outputs with the reshape2 and ggpubr packages in R. Bar plots and box plots were produced to display the relative percentages of different immune cell types across the two groups and to compare expression variations within each group, respectively, with statistical significance highlighted through appropriate tests. The core component of the CIBERSORT algorithm is a support vector regression (SVR) model, which iteratively tests various regularization parameters to select the optimal model for estimating the proportions of different immune cell types in the samples. By comparing data between the control and treatment groups, the algorithm assesses the impact of treatment on immune cell infiltration. Additionally, permutation tests were conducted to estimate the statistical significance of our results, enhancing the robustness of our findings.
Gene Ontology and KEGG Pathway Enrichment Analysis of CRDEGs
For the 18 CRDEGs, Gene Ontology (GO) and Kyoto Encyclopedia of Genes and Genomes (KEGG) pathway enrichment analyses were performed. The GO analysis spanned three main domains: Molecular Function (MF), Cellular Component (CC), and Biological Process (BP). The KEGG analysis investigated the potential roles of these genes in metabolic and signaling pathways. These analyses were conducted using the “clusterProfiler” package in R, which provides a statistical framework for the analysis and visualization of functional gene sets. The results were visually displayed using the “enrichplot” package, which graphically demonstrates the enrichment of genes across various biological terms and pathways.
LASSO Regression and SVM-RFE Analysis
LASSO regression analysis was conducted using the glmnet package in R, aimed at identifying feature genes associated with sample classification. After setting a fixed random seed (12345), the expression data were read, transposed, and converted into a matrix format. The response variable was extracted from the sample names, indicating whether the sample belonged to the control or treatment group. The LASSO model was configured for a binomial distribution and optimized through 10-fold cross-validation to obtain results and model coefficients. Significant feature genes, termed LASSO-Gene, were extracted from the LASSO model using the lambda value that minimized the error. Feature selection on the gene expression data was performed using the e1071 package and the svmRFE function in R, utilizing a multiple SVM-RFE method, automatically reducing the number of features by half when exceeding 50 to accelerate computation. Features were evaluated and ranked through a 10-fold cross-validation (nfold=10) method. The performance of selected features was assessed using a custom function, FeatSweep.wrap, which included plotting cross-validation errors and accuracy graphs. The optimal feature gene set, termed SVM-Gene, was determined based on minimizing cross-validation errors. A Venn diagram of LASSO-Gene and SVM-Gene was created using the venn. diagram function to visually display the intersection and unique parts of the gene lists identified by both methods, referred to as interGenes.
ROC Curve Analysis
For each gene in interGenes, its corresponding ROC curve was computed using the pROC function to evaluate its predictive performance as a biomarker. A logistic regression model was constructed based on the intersection genes, with gene expression values as predictors. The overall ROC curve was calculated using model prediction scores, and the 95% confidence interval of the AUC was estimated using the bootstrap method. The established ROC diagnostic model was tested and validated using the validation datasets GSE30718 and GSE139061.
Gene Set Enrichment Analysis(GSEA)
GSEA was conducted using the `limma` and `clusterProfiler` packages in R. Samples were stratified based on IRI group information and divided into high and low expression groups according to the median expression levels of genes in interGenes. Average expression for each group was calculated and transformed into log fold change (logFC). GSEA was performed using the GSEA function with a p-value cutoff set at 0.05. Pathways with p-values less than 0.05 were selected, and the top six significantly enriched pathways were visualized using the `gseaplot2` function.
Clustering and Cluster Differential Analysis
Clustering analysis was performed using the `ConsensusClusterPlus` package to identify expression patterns within the treatment group samples. The analysis was set with a maximum of 9 clusters, 50 repetitions, with each iteration randomly selecting 80% of samples and 100% of features. The k-means algorithm was utilized with Euclidean distance as the metric and a random seed of 123456. Clustering consistency and stability were assessed through repeated clustering, and graphical files were generated to visualize the results. Consistency scores, calculated based on clustering outcomes, guided the selection of the optimal number of clusters (eg, 2). Expression box plots for each gene across different clusters were created using `ggboxplot`, with each cluster represented by a specific color. Statistical significance was assessed and comparisons between groups were conducted using `stat_compare_means`.
Principal Component Analysis (PCA)
Principal Component Analysis was carried out using the `limma` and `ggplot2` packages in R. PCA was executed using the `prcomp` function, generating principal component scores. Projections of samples on the primary principal components (PC1 and PC2) were obtained using the `predict` function. Results were visualized using `ggplot2`.
Gene Set Variation Analysis (GSVA)
Gene Set Variation Analysis was executed using the `limma`, `GSEABase`, `GSVA`, and `ggpubr` packages in R. Gene sets were loaded from the “c2.cp.kegg.symbols.gmt” file. GSVA was performed using a non-parametric, single-sample method to estimate changes in gene set activity within the samples. Scores were normalized to facilitate comparisons. Samples were categorized into two groups (C1 and C2) based on phenotyping results. T-tests were conducted on GSVA scores of each pathway to identify significant changes. The pathways with the highest and lowest t-values were selected for visualization.
Weighted Gene Co-Expression Network Analysis (WGCNA)
Data was prepared using the `limma` package, selecting the top 50% of genes by variability for the WGCNA analysis. Hierarchical clustering (hclust) was initially used to cluster samples to detect and eliminate outliers. Samples were filtered based on a predefined cut height to retain those with high clustering consistency. Network construction and module detection were performed using the `WGCNA` package. The appropriate soft threshold was determined using the `pickSoftThreshold` function to ensure a scale-free topology of the network. An adjacency matrix was computed and transformed into a Topological Overlap Matrix (TOM) similarity matrix. Gene modules were identified using the dynamic tree cutting method (`cutreeDynamic`). Correlation analyses between module eigengenes and sample traits were conducted, and the results were visualized as heatmaps, displaying the relationships between module eigengenes and traits. The importance of each gene in relation to traits and its membership in the module were evaluated. Core genes within modules were identified by setting thresholds for correlation and significance, and the relevant data were outputted.
Machine Learning
Machine learning analyses were conducted using the R packages caret, DALEX, ggplot2, randomForest, kernlab, pROC, and xgboost. Three machine learning methods were employed, including: Random Forest (RF): Models were trained using the randomForest package. Support Vector Machine (SVM): Models were trained using the svmRadial kernel in the kernlab package. XGBoost (XGB): Models were trained using the xgboost package. All models were trained using repeated cross-validation methods to evaluate performance. ROC curves were generated using the pROC package to compare the discriminative ability of different models. The DALEX package was used to assess the predictive performance and residuals of each model. Variable importance was evaluated for each model, identifying the top five genes with the greatest impact on model predictions.
Statistical Model Application to Assess RIRI Risk
Predictive models based on logistic regression were constructed using the lrm function from the rms package, incorporating important genes identified through machine learning. The model’s predictive factors and their contributions to the outcomes were illustrated using a nomogram generated by the nomogram function. Calibration curves, produced via the calibrate function, assessed the accuracy of the model’s predictions. DCA was performed using the decision_curve function to evaluate the clinical decision utility of the model at various threshold levels. Established ROC diagnostic models were tested and validated using the validation datasets GSE30718 and GSE139061.
Ethical Compliance
All experimental protocols involving animals were approved by the Animal Ethics Committee of Lanzhou University Second Hospital, under approval number D2024-680. The study was conducted in accordance with national guidelines for animal care and the ARRIVE guidelines (https://arriveguidelines.org) for reporting animal experiments, ensuring the ethical treatment of animals and the credibility of the methodology. For human data, ethical standards were upheld according to institutional and international guidelines, ensuring patient data privacy and informed consent in compliance with the database’s protocols. For research involving human data, the study was reviewed and approved by the Institutional Review Board of Lanzhou University Second Hospital, with the ethical approval number 2024A-1289. This approval confirms that all procedures were performed in accordance with the ethical standards of the institutional and national research committee and with the 1964 helsinki declaration and its later amendments or comparable ethical standards.
Animal Housing and Grouping
Male C57BL/6 mice were sourced from the Lanzhou Veterinary Research Institute. They were housed in a controlled environment with continuous access to sterile food and water. The animals were divided into four experimental groups (n=6): Sham operation group (Sham), Sham operation plus D-PCA at 200 mg/kg group (Sham+D), Ischemia-reperfusion group (IR), Ischemia-reperfusion plus D-PCA at 200 mg/kg group (IR+D). In addition, each repeat was performed as a separate, independent experiment or observation. D-PCA was administered intravenously through the tail vein at a dose of 200 mg/kg, two hours prior to the induction of ischemia-reperfusion. Euthanasia was conducted in a humane manner using carbon dioxide inhalation, followed by cervical dislocation to ensure minimal animal distress, in line with recommended veterinary practices. Anaesthesia during surgical procedures was achieved using a ketamine-xylazine combination, providing effective analgesia. Post-treatment, kidney samples were either fixed for histological examination or stored at −80°C for biochemical analyses.
Hematoxylin and Eosin (H&E) Staining
Tissue samples were fixed in 4% formaldehyde for 24 hours, processed through dehydration, clearing, and embedding, then sectioned into 4-micron thick slices (n=6). Sections were stained with hematoxylin for 10 minutes and with eosin for 1 minute, followed by dehydration with alcohol, clearing, and mounting. Prepared slides were then analyzed under an optical microscope.
Periodic Acid-Schiff (PAS) Staining
PAS staining identifies polysaccharides and glycoproteins in tissue samples (n=6). Sections fixed in 4% formaldehyde and embedded in paraffin were oxidized with 1% periodic acid, followed by staining with Schiff’s reagent to form a bright magenta complex, then counterstained with hematoxylin. After dehydration and clearing, the prepared slides were evaluated using a microscope.
Tissue Copper Ion Determination
Protein concentrations in mouse kidney homogenates were initially determined using a BCA assay kit (n=6). Subsequently, the concentration of copper ions in the kidney was measured using the Elabscience Copper (Cu) Colorimetric Assay Kit (E-BC-K300-M).
Creatinine and Urea Nitrogen Determination
Blood samples were collected from all experimental mice via ocular venipuncture and immediately stored in sterile tubes at 4°C (n=6). Creatinine and urea nitrogen levels were measured using an automated biochemical analyzer. Prior to analysis, all samples were centrifuged to separate serum or supernatant. Creatinine was determined using a modified Jaffé method, which involves the formation of a red complex with picric acid under alkaline conditions; the absorbance of this complex, proportional to the creatinine concentration, was measured at a wavelength of 495 nm. Urea nitrogen was measured using the urease method, where urea is enzymatically decomposed into carbon dioxide and ammonia, the latter reacting with a specific reagent to form a colored product measurable at 340 nm. All chemical analysis results were entered into a computer database and processed using statistical software. Results were reported as mean ± standard deviation and differences between groups were assessed using the t-test, with a p-value of less than 0.05 considered statistically significant.
Tissue Immunofluorescence
Immunofluorescence staining was used to localize and quantify specific proteins in tissue sections (n=6). After fixation and embedding, sections were subjected to antigen retrieval in citrate buffer and blocked with BSA. They were then incubated overnight with primary antibodies against SDHB and NDUFB6, followed by incubation with fluorescent secondary antibodies and DAPI staining. Fluorescence microscopy facilitated the capture and analysis of images.
Tissue TUNEL Staining
Fixed tissue sections were dehydrated, cleared, and paraffin-embedded on poly-L-lysine-coated slides (n=6). TUNEL staining was performed using the Beyotime TUNEL Kit (C1090), which included treatment with proteinase K to expose DNA ends, followed by incubation in a TUNEL reaction mixture containing terminal transferase and labeled dUTP. After the reaction, sections were washed with PBS and optionally stained with DAPI, then mounted with an anti-fade reagent. TUNEL-positive cells were quantified using fluorescence microscopy and image analysis software to assess apoptosis in the tissues.
Western Blot(WB)
Protein samples were extracted from mouse kidney tissues using RIPA buffer, supplemented with both protease and phosphatase inhibitors (n=6). The protein concentrations were determined through the BCA assay. Each sample, containing 30 µg of protein, was separated using SDS-PAGE with 10% and 15% gels, followed by electrophoretic transfer to PVDF membranes. The duration of transfer was tailored based on the molecular weight of the proteins. The membranes were then blocked for one hour using 5% non-fat milk dissolved in TBST and incubated overnight with primary antibodies. Subsequent to TBST washes, the membranes were treated with secondary antibodies for one hour at room temperature. The protein bands were visualized using the ECL detection system and their intensities were quantified using ImageJ software.
Cell Culture and HR Model Establishment
HK-2 cells, representative of human renal proximal tubular epithelia, were obtained from Servicebio (Cat: STCC10303P) and cultured in DMEM-F12 medium enriched with 10% fetal bovine serum, 100 U/mL penicillin, and 100 µg/mL streptomycin. These cells were incubated at 37°C in a controlled atmosphere containing 5% CO2 and 21% O2, maintaining a pH of 7.4. To mimic RIRI in vitro, HK-2 cells were subjected to HR treatment. This entailed 12 hours of hypoxia in a serum-free, glucose-free environment within a tri-gas incubator adjusted to 94% N2, 5% CO2, and 1% O2. After hypoxia, cells underwent reoxygenation for 2 hours under standard conditions (5% CO2 and 21% O2), followed by restoration to DMEM-F12 medium supplemented with 10% serum. The study involved four experimental conditions: normoxia (N), normoxia with D-PCA treatment (N+D), hypoxia-reoxygenation (HR), and hypoxia-reoxygenation with D-PCA (HR+D). For the N+D and HR+D groups, cells were pre-treated with 10 μmol/mL D-PCA for 12 hours prior to the hypoxia phase.
JC-1 Staining
Alterations in the mitochondrial membrane potential of HK-2 cells post-hypoxia-reoxygenation were evaluated using the JC-1 Mitochondrial Membrane Potential Assay Kit (n=6). Initially, the existing culture medium was removed, and the cells were washed once with PBS. Subsequently, 1 mL of the JC-1 working solution was added to each dish, and the cells were incubated for 30 minutes to allow the dye to stain the mitochondria. The changes in mitochondrial membrane potential were then visualized using a Zeiss LSM880 confocal microscope, employing a 60×1.3 NA oil immersion lens. Fluorescence emissions were captured through the A546 and A488 channels. Analysis and quantification of the images were conducted using ImageJ software to determine the changes in mitochondrial membrane potential.
TUNEL Staining of Cells
Apoptosis in HK-2 cells was quantified using the TUNEL assay (n=6). HK-2 cells were grown on slides coated with poly-L-lysine and subjected to hypoxia-reoxygenation (HR) treatment. Post-treatment, the cells were fixed in 4% paraformaldehyde. For permeabilization, 0.3% Triton X-100 was applied. Subsequently, the cells were incubated in TUNEL reagent at 37°C in a dark environment for 60 minutes to label the fragmented DNA. Following the incubation, the cells were washed and then stained with DAPI to visualize the nuclei. Apoptosis was detected using an upright fluorescence microscope, specifically through the Cy3 channel to observe the TUNEL-positive cells.
Result
Identification of CRDEGs and Their Association with Immune Infiltration
Based on the transcriptomic data from the dataset GSE43974, we conducted a batch differential analysis and identified 5519 DEGs, as illustrated in Figure 2A. Among 39 CRGs, 18 genes exhibited significant differential expression between the control and RIRI groups. Additionally, we established a protein-protein interaction network for these 18 CRDEGs, shown in Figure 2B. Notably, apart from LIPT1 and NLRP3, which were significantly upregulated in the RIRI group, other genes such as LIPA, NFE2L2, PDHA1, NDUFA1, NDUFA8, NDUFC1, NDUFV2, PDHB, NDUFB2, NDUFB6, SDHB, GLRX5, DLAT, DLD, ISCA2, and NDUFB10 were significantly downregulated (Figure 2C and D).
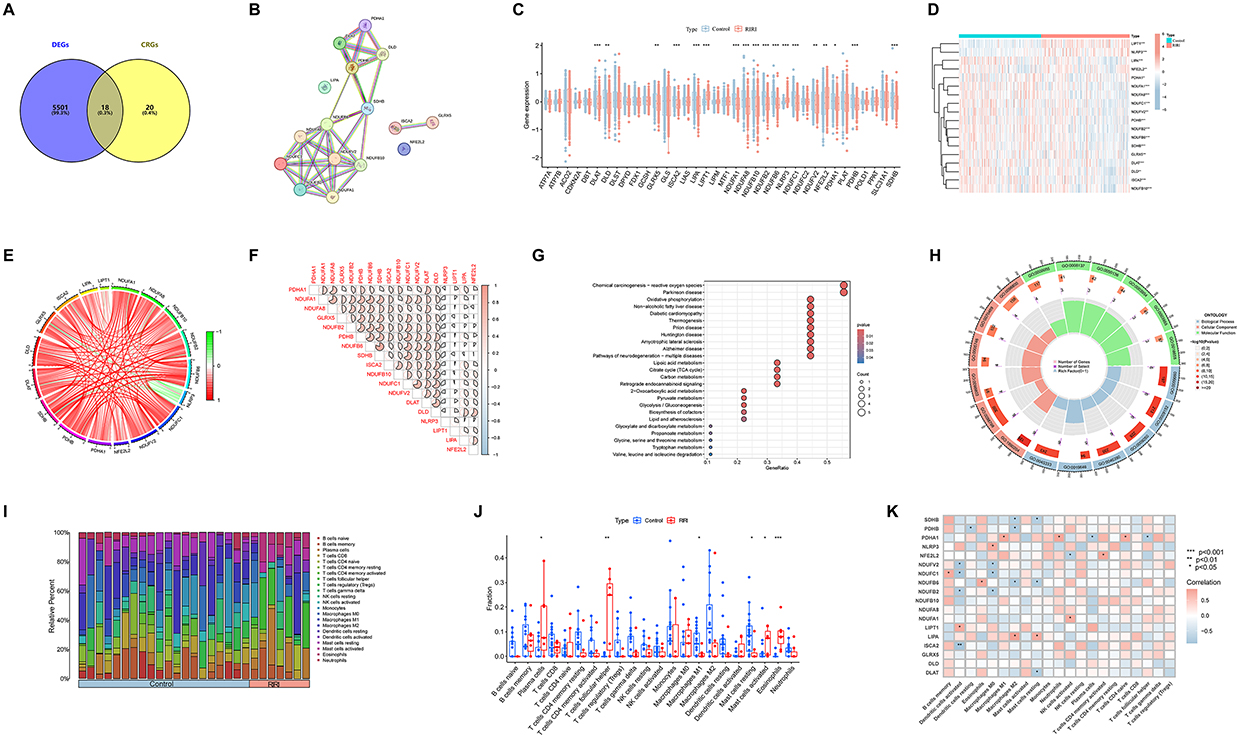 |
Figure 2 Characterization and immune infiltration analysis of cuproptosis-related differential expression genes (CRDEGs). (A) Venn diagram of differential genes and cuproptosis-related target intersections in dataset GSE43974. (B) Protein-protein interaction network of 18 CRDEGs. (C and D) Box plots and heatmaps illustrating group differences in CRDEGs. (E and F) Circos and heatmap of correlations among CRDEGs. (G) KEGG pathway enrichment of CRDEGs. (H) GO enrichment analysis of CRDEGs. (I) Proportional representation of immune cells in control and RIRI sample groups. (J) Comparative differences between various immune cells in control and RIRI groups. (K) Heatmap of correlations between CRDEGs and various immune cells. Notes: Data presented as mean ± SEM; statistical significance denoted by *p < 0.05, **p < 0.01, ***p < 0.001. |
Subsequent correlation analysis of the 18 CRDEGs, depicted in Figure 2E and F, showed that red sectors represent positive correlations and blue sectors represent negative correlations, with the area of each sector indicating the strength of the correlation. Interestingly, LIPT1 and NLRP3 exhibited a negative correlation trend with almost all other CRDEGs, while the remaining CRDEGs generally showed positive correlations among themselves, with the strongest positive correlation observed between SDHB and NDUFB6.
To explore the functions of these genes, we conducted KEGG and GO enrichment analyses for the 18 CRDEGs. KEGG pathway enrichment analysis revealed enrichment in pathways such as reactive oxygen species, oxidative phosphorylation, and fatty acid oxidation (Figure 2G). GO analysis indicated that these genes are involved in biological processes like aerobic respiration, the electron transport chain, and cellular respiration. Cellular component analysis suggested localization to oxidoreductase complexes, mitochondrial protein complexes, and the electron transport chain. Molecular function analysis revealed associations with electron transport chain activity, NADH dehydrogenase activity, and oxidoreductase activity (Figure 2H).
Using the CIBERSORT algorithm, we assessed the proportions of various immune cells between the control and RIRI groups. Figure 2I displays the differences in immune cell proportions. Figure 2J shows significant statistical differences in Plasma Cells, Follicular Helper T Cells, Macrophages M1, Mast Cells, and Eosinophils during the RIRI process between the control and RIRI groups. The immune correlation heatmap, shown in Figure 2K, indicates that red squares represent positive correlations and blue squares represent negative correlations between genes and immune cells. Notably, ISCA2 exhibited the strongest negative correlation with activated Dendritic cells.
Construction of the RIRI Cuproptosis Marker Gene Model (CMGM)
To pinpoint candidate genes with predictive potential among the initially identified 18 CRDEGs, we utilized a dual approach involving LASSO regression and SVM-RFE. First, the LASSO logistic regression technique helped in narrowing down the list to 15 CRDEGs. Subsequently, the SVM-RFE method was applied to further refine this selection and identified 4 distinct cuproptosis-associated marker genes. We then integrated the outcomes from both LASSO regression and SVM-RFE using a Venn diagram, which highlighted four key marker genes—LIPA, LIPT1, NDUFB6, and SDHB—for deeper investigation as shown in Figure 3A-E.
 |
Figure 3 Development and validation of the Cuproptosis Marker Gene Model (CMGM). (A) Bonferroni score plot for LASSO logistic regression across different log likelihood thresholds. (B) L1 regularization paths for various genes. (C and D) Line graphs showing the relationship between increasing feature count and accuracy/error rate in tenfold cross-validation. (E) Venn diagram of feature selection results comparing LASSO regression and SVM-RFE methods. (F) Multigene ROC curve for four marker genes under CMGM. (G) Combined ROC curve for all marker genes. (H-K) Multigene and overall ROC curves comparing performance across datasets GSE30718 and GSE139061 under CMGM. |
Subsequent analysis of these marker genes included calculating their respective ROC curves, revealing that the AUC values ranged between 0.6 and 0.9. Notably, LIPT1 demonstrated an AUC of 0.813, indicating a significant predictive accuracy (Figure 3F and G). In the external validation, the model achieved an AUC of 0.741 (95% CI: 0.516–0.926) in the GSE30718 dataset (Figure 3H and I), and an AUC of 0.834 (95% CI: 0.692–0.955) in the GSE13906 dataset (Figure 3J and K). These results show variability in performance between the modeling set and the validation datasets, indicating potential differences in predictive accuracy across datasets.
GSEA and GSVA Enrichment Analysis of the CMGM
To explore the signaling pathways involved by the cuproptosis marker genes, we performed GSEA for each individual gene to identify pathways associated with this model. The GSEA results indicated that LIPA and LIPT1 are primarily involved with pathways such as the spliceosome, ribosome, RNA degradation, and ubiquitin-mediated proteolysis. For NDUFB6 and SDHB, the analysis highlighted their involvement in fatty acid metabolism and peroxisomal pathways. Additionally, SDHB was associated with the degradation pathways of amino acids such as valine and leucine (Figure 4A-D).
 |
Figure 4 Gene set enrichment and pathway activity analysis of cuproptosis-related differential expression genes (CRDEGs). (A-D) Gene set enrichment analyses (GSEA) for LIPA, LIPT1, NDUFB6, and SDHB. (E-H) Gene set variation analysis (GSVA) showcasing pathway activity between low and high expression subtypes for four pivotal genes. |
Subsequently, we utilized GSVA to identify differentially active pathways between low and high expression subtypes based on the expression levels of the four pivotal genes. Low expression of LIPA was related to various pathways including spliceosome function, water reabsorption regulation, response to pathogenic Escherichia coli infection, SNARE interactions in vesicular transport, RNA degradation, and nucleotide excision repair. Overexpression of LIPT1 activated pathways like proximal tubule bicarbonate reabsorption, beta-alanine metabolism, and the metabolism of glycine, serine, and threonine, as well as the interconversion of pentose and glucuronate, tryptophan metabolism, ascorbate, and aldarate metabolism. Conversely, low expression of LIPT1 was associated with pathways including regulation of mammalian heart rhythm, response to pathogenic Escherichia coli, mRNA splicing, RNA degradation, SNARE interactions in vesicular transport, vasopressin-regulated water reabsorption, nucleotide excision repair, protein export, glycosylphosphatidylinositol (GPI)-anchor biosynthesis, and ribosome function. Low expression of NDUFB6 was implicated in pathways related to Parkinson’s disease, oxidative phosphorylation, Huntington’s disease, pyruvate metabolism, the TCA cycle, ribosome function, protein export, aminoacyl-tRNA biosynthesis, glutathione metabolism, nucleotide excision repair, selenoamino acid metabolism, RNA polymerase, biosynthesis of valine, leucine, and isoleucine, response to cholera, and proteasome function. Lastly, low expression of SDHB was linked with oxidative TCA cycle, pyruvate metabolism, Parkinson’s disease, metabolism of glyoxylate and dicarboxylate, propionate metabolism, degradation of valine, leucine, and isoleucine, peroxisomes, butanoate metabolism, glutathione metabolism, Huntington’s disease, and fatty acid metabolism (Figure 4E-H).
Clustering Analysis and WGCNA of CRDEGs in RIRI
We applied a consensus clustering algorithm to categorize 203 RIRI samples by analyzing the expression profiles of 18 CRDEGs. The cluster stability was optimal at k=2, as evidenced by Figure 5A-H. The area under the curve (AUC) for the cumulative distribution function (CDF) curves between clusters k-1 and k showed significant changes. Consistency scores, demonstrating cluster stability, exceeded 0.9 only at k=2, as depicted in Figure 5I. The CDF curve exhibited minimal variations within a consensus index range of 0.4 to 0.6, shown in Figure 5J. A tracking plot (Figure 5K) illustrated the distribution of samples across the clusters. The analysis ultimately segregated the 203 RIRI samples into two distinct subtypes: C1 (N=93) and C2 (N=110). PCA performed on these subtypes revealed marked differences between C1 and C2, particularly in the expression levels of the CRDEGs (Figure 5L).
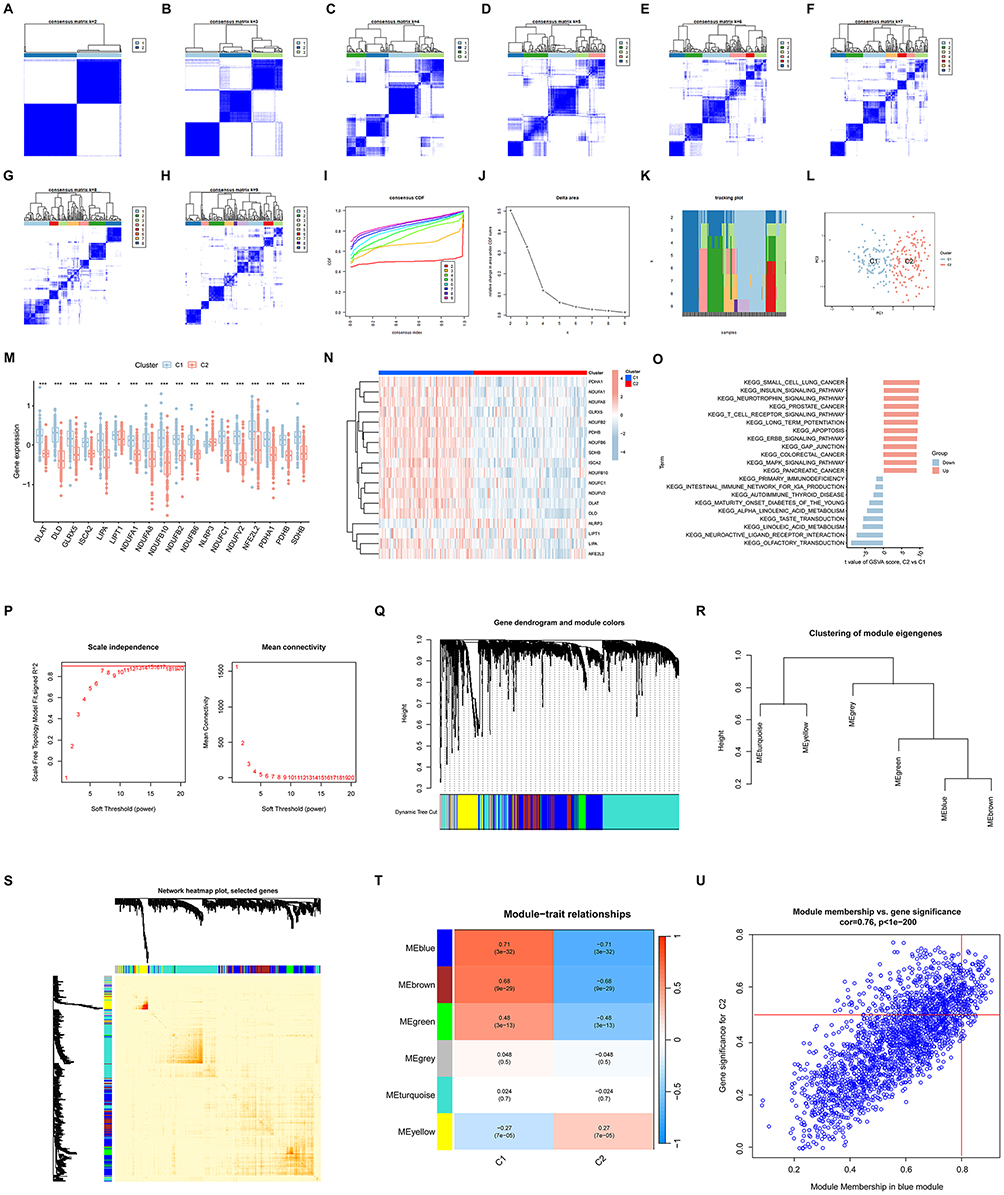 |
Figure 5 Characteristics and WGCNA analysis of clusters related to CRDEGs in RIRI. (A-H) Cluster analysis of 203 RIRI samples using consensus clustering algorithms, showing cluster stability under different k-values. (I) CDF curve depicting consistency scores from k=1 to k=9, with high consistency achieved at k=2. (J) Consensus index fluctuation range, illustrating minimal changes between 0.4 and 0.6. (K) Tracking plot showing sample distribution across different clusters. (L) Principal Component Analysis (PCA), highlighting significant differences between two subtypes, C1 and C2, based on CRDEG expression. (M and N) Box plots and heatmaps of CRDEG expression differences between C1 and C2 subtypes. (O) GSVA results comparing functional pathway differences between subtypes C1 and C2. (P) Soft-threshold power analysis using the WGCNA package, depicting fit of the scale-free network. (Q-S) Detailed views of co-expression modules identified by dynamic tree cutting and module interactions. (T) Heatmap of module-trait relationships, analyzing correlations between specific gene clusters and expression modules. (U) Scatter plot of gene significance vs module membership within the blue module, identifying key genes. Notes: Data presented as mean ± SEM; statistical significance indicated by *p < 0.05, ***p < 0.001. |
To identify the molecular characteristics distinguishing C1 and C2, we evaluated the expression differences of the 18 CRDEGs. As depicted in Figure 5M and N, significant expression differences were observed between C1 and C2, with all genes except NLRP3, which exhibited higher expression levels in C2, showing lower expression in C2.
Subsequent GSVA revealed functional differences between the two clusters. Pathways such as olfactory transduction, neuroactive ligand-receptor interaction, metabolism of linoleic and alpha-linolenic acids, and primary immunodeficiency were upregulated in C1. In contrast, C2 demonstrated upregulation in pathways including the insulin signaling pathway, neurotrophin signaling pathway, T-cell receptor signaling pathway, long-term potentiation, apoptosis, ERBB signaling pathway, gap junction, and MAPK signaling pathway (Figure 5O).
We employed the WGCNA package to explore significant gene modules within our dataset. We set the soft threshold power at 8, achieving a scale-free fit index (R²) of 0.9, which indicated a robust network structure, as shown in Figure 5P. Utilizing the dynamic tree cut algorithm, we delineated ten distinct color-coded co-expression modules. Further exploration of the relationships between these modules was depicted in Figure 5Q-S. Our correlation analysis revealed a notable association between a specific gene cluster and the blue module, which comprised 132 genes, highlighted in Figure 5T. To corroborate the significance of key genes within this module, we plotted gene significance against module membership for the blue module, as presented in Figure 5U. This analysis helped to validate the influential roles of these genes in the network.
WGCNA Analysis of RIRI Samples and Normal Controls
Initially, we utilized the WGCNA algorithm to construct gene co-expression modules from expression data collected from 203 RIRI samples and 188 normal controls. We focused on the top 25% of genes with the highest variability for deeper analysis. Clustering of these samples was executed using the “flashClust” package, with the results illustrated in Figure 6A. Setting the power value to 10 allowed us to achieve an independence measure of 0.9 and maintain a high average connectivity, as depicted in Figure 6B.
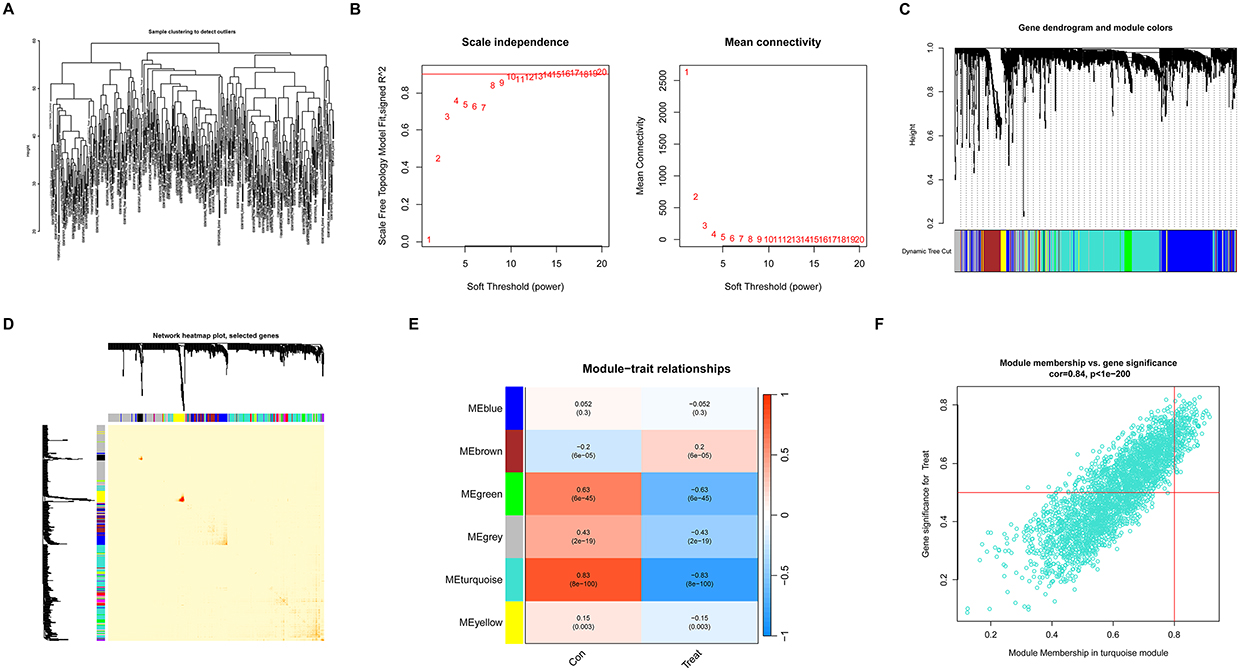 |
Figure 6 WGCNA analysis of co-expression modules in RIRI samples and normal controls. (A) Clustering analysis results for 203 RIRI and 188 normal control samples using the “flashClust” package to detect outlier samples. (B) Soft thresholding power analysis, achieving an Independence of 0.9 at power value 10, illustrated by the average connectivity graph. (C) Identification of seven different gene co-expression modules in RIRI samples using a dynamic cutting algorithm. (D) Network heatmap displaying the topological overlap matrix (TOM) among gene modules. (E) Heatmap of module-trait relationships, analyzing the association of genes in seven modules with clinical traits. (F) Scatter plot of gene significance vs module membership in the turquoise module, showing the relationship between gene significance and module membership. |
Employing the dynamic tree cutting algorithm, we identified seven distinct gene co-expression modules within the RIRI dataset. The TOM heatmap for these modules is shown in Figure 6C and D. We also conducted an analysis to determine the associations between module eigengenes and clinical traits using the genes from these seven modules, shown in Figure 6E. The turquoise module, which includes 218 genes, exhibited the highest correlation with RIRI characteristics. Furthermore, a significant positive correlation was observed between the genes’ module membership and the turquoise module, highlighting strong module-trait relationships (shown in Figure 6F).
Establishment of the 5 Hub-Gene SVM Model from RIRI Module-Associated Genes and CRDEGs-Related Clusters
By intersecting genes from RIRI module-associated clusters with CRDEGs, we identified 112 central hub genes, as illustrated in Figure 7A. To further investigate these genes’ predictive values, we developed three machine learning models—SVM, RF, and XGB—based on the expression profiles of these genes. The SVM and XGB models demonstrated notably lower root mean square residuals, shown in Figure 7B and C. ROC analysis highlighted the SVM model’s superior performance, with the largest area under the curve (AUC = 0.909), as presented in Figure 7E.
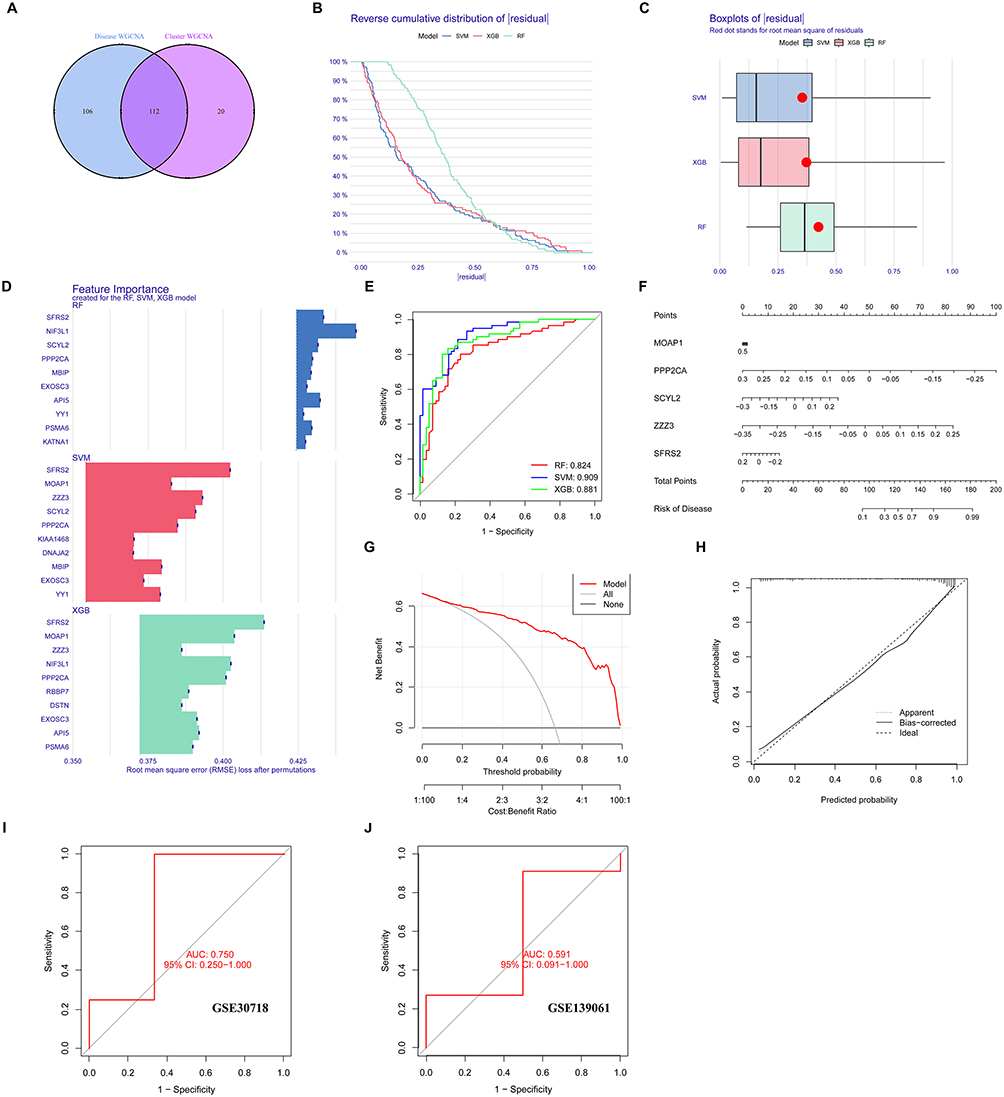 |
Figure 7 Identification of hub genes and predictive model analysis through cross-analysis of RIRI module-related genes and CRDEG-related clusters. (A) Venn diagram of identified 112 hub genes. (B) Cumulative distribution plot of residuals for SVM, RF, and XGB machine learning models, assessing model prediction accuracy. (C) Box plot of root mean square error (RMSE) residuals comparing model performance. (D) Feature importance graph for the top 10 most important variables of each model based on permuted RMSE loss. (E) ROC curves for SVM, RF, and XGB models, comparing prediction efficacy of different models. (F) Column line chart of the top five prediction variables in the SVM model, used to infer RIRI risk. (G) Decision curve analysis (DCA) for the SVM model, evaluating clinical benefits of the model. (H) Calibration curve for the SVM model, assessing the accuracy of model prediction probabilities. (I and J) ROC curves and AUC values for datasets GSE30718 and GSE139061. |
We also identified the top 10 most important variables for each model based on permutation RMSE loss, detailed in Figure 7D. Given these outcomes, we selected the SVM model for further exploration due to its optimal discriminative capabilities. The most crucial variables identified within the SVM model were MOAP1, PPP2CA, SYL2, ZZZ3, and SFRS2. These variables were used to develop a nomogram model (Figure 7F), enabling the calculation of RIRI risk through a “total score”. We assessed the predictive accuracy of this nomogram through calibration curves and DCA, with results indicating high precision and minimal error, detailed in Figure 7G and H. These metrics aid clinicians in formulating more effective treatment plans.
Finally, the robustness of our predictive model was validated using two external datasets. The ROC curves for these datasets showed varying discriminative ability, with an AUC of 0.750 (95% CI: 0.250–1.000) for the GSE30718 dataset and 0.591 (95% CI: 0.091–1.000) for the GSE139061 dataset, as shown in Figure 7I and J. These results suggest that the model’s performance varied between datasets, indicating potential limitations in its generalizability.
Copper Chelation Mitigates RIRI and Cuproptosis in Mice
To investigate the role of cuproptosis in RIRI and to partially validate our bioinformatics findings, we conducted experiments using the copper chelator D-PCA. Figure 8A provides a visual representation of the process by which animal experiments are conducted. Figure 8B shows the visual inspection of kidneys from different groups. Compared to the Sham group, kidneys in the IR group appeared paler, indicating reduced blood perfusion, while noticeable reperfusion was observed in the IR+D group. As depicted in Figure 8C, copper ion content in renal homogenate protein was significantly increased in the IR group compared to the Sham group, suggesting copper overload. Pre-treatment with D-PCA effectively reduced copper levels. HE staining of heart, liver, spleen, and lung tissues in the Sham+D group confirmed that the used concentration of D-PCA was non-toxic (Figure 8D).
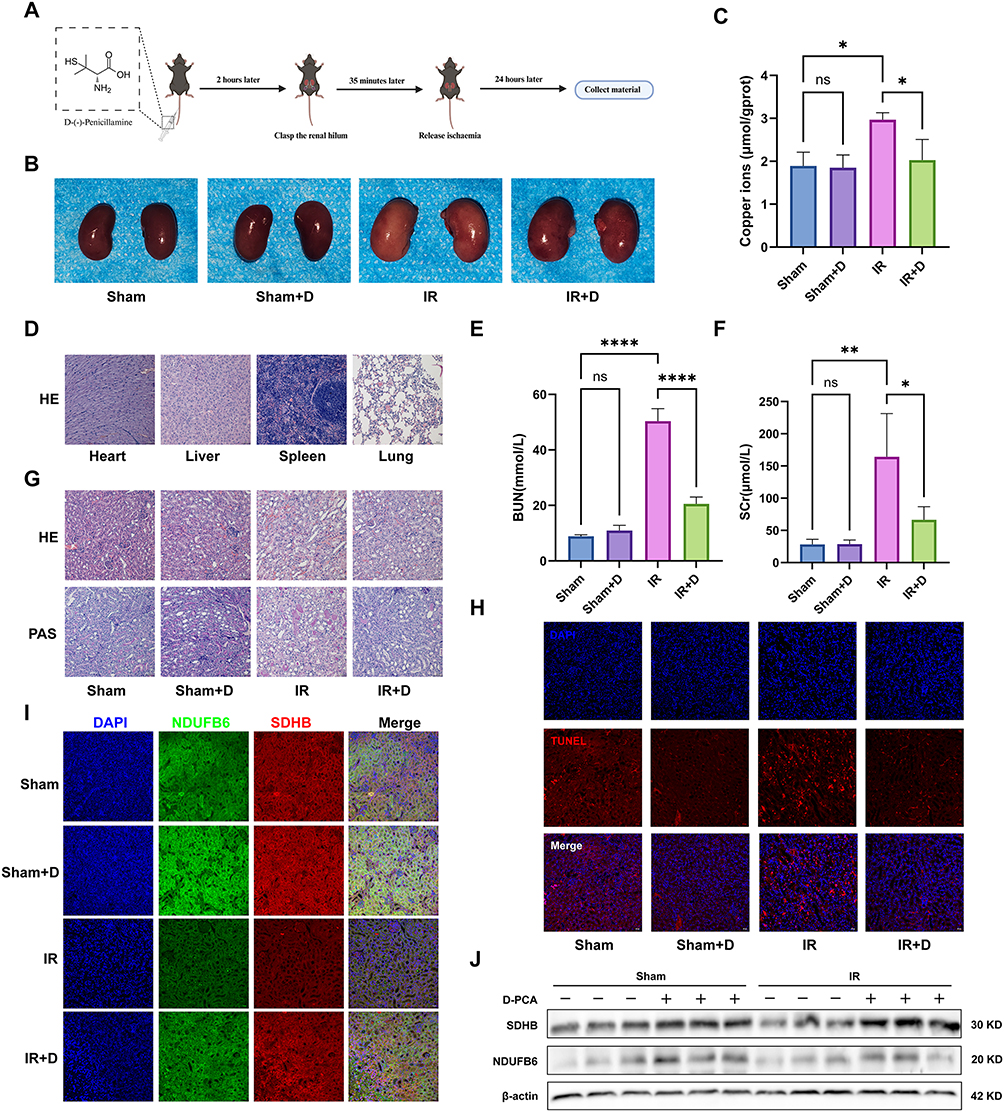 |
Figure 8 Impact of the copper chelator D-PCA on RIRI in mice. (A) Experimental workflow diagram, outlining stages from pretreatment to material collection. (B) Direct views of mouse kidneys across experimental groups (n = 6). (C) Statistical chart of copper ion content in kidney homogenates per unit protein across groups (n = 6). (D) H&E staining of heart, liver, spleen, and lung tissues from different mouse groups (n = 6). (E and F) Blood urea nitrogen (BUN) and creatinine (SCr) levels in different mouse groups (n = 6). (G) H&E and PAS staining of kidney tissues from different groups to assess cellular apoptosis (n = 6). (H) TUNEL staining of kidney tissues from different groups (n = 6). (I) Immunofluorescence detection in kidney tissues, showcasing expression changes of SDHB and NDUFB6 (n = 6). (J) Western blot analysis of SDHB and NDUFB6 protein expression in kidney tissues from different groups. Notes: Data presented as mean ± SEM; statistical significance denoted by *p < 0.05, **p < 0.01, ****p < 0.0001. The analysis was performed using ImageJ (n = 6). |
BUN and creatinine levels were markedly elevated in the IR group, indicating kidney function impairment, while these levels were significantly reduced in the IR+D group (Figure 8E and F). Histological examination with HE and PAS staining revealed vacuolar degeneration, thinning and loss of tubular epithelial cells, loss of brush borders, tubular casts, and inflammatory cell infiltration in the IR group. These markers of kidney damage were substantially alleviated by D-PCA pre-treatment (Figure 8G).
TUNEL staining showed a significant increase in apoptotic cells in the IR group, a trend that was mitigated by D-PCA pre-treatment (Figure 8H). Immunofluorescence and Western blot analysis revealed trends in cuproptosis-associated proteins SDHB and NDUFB6: a notable decrease in their levels during IR, which was reversed by D-PCA pre-treatment (Figure 8I and J). These findings suggest that cuproptosis is a key mechanism in the development and progression of RIRI.
Copper Chelation Reduces Hypoxia-Reoxygenation Injury in HK-2 Cells
To validate the presence of cuproptosis in an in vitro model of RIRI, we established a HR model using the HK-2 cell line. Figure 9A shows that after establishing the HR model, the JC-1 Aggregate levels significantly decreased, and JC-1 Monomer levels increased in the HR group compared to the control, indicating a reduction in mitochondrial membrane potential. Pre-treatment with D-PCA (10 μmol/mL) significantly mitigated this trend. Similarly, TUNEL staining demonstrated an increase in cell apoptosis in the HR group, while pre-treatment with D-PCA effectively rescued the cells from apoptosis induced by HR alone (Figure 9B). Measurements of mitochondrial membrane potential and cell apoptosis indicate that reducing copper ions alleviates cell damage in HK-2 cells during HR. Consistent with the cellular experiment results, Western blot analysis revealed trends in the copper metabolism-related proteins SDHB and NDUFB6. During HR, levels of these proteins significantly decreased, while D-PCA pre-treatment effectively restored their expression (Figure 9C).
 |
Figure 9 Effects of the copper chelator D-PCA on hypoxia-reoxygenation (HR) injury in HK-2 cells. (A) JC-1 staining indicating mitochondrial membrane potential changes (n = 6); red JC-1 aggregates denote normal mitochondrial membrane potential, green JC-1 monomers indicate reduced membrane potential. Increased green JC-1 monomers in HR group, with pretreatment in HR+D group mitigating this effect. (B) TUNEL staining assessing cell apoptosis (n = 6); DAPI stains nuclei blue, TUNEL-positive cells appear red indicating apoptosis. Significantly increased apoptosis in HR group, visibly reduced in HR+D group. (C) Western blot analysis of copper metabolism-related proteins SDHB and NDUFB6, showing significantly decreased levels during HR, with D-PCA pre-treatment effectively restoring their expression (n = 6). |
Figure 10 illustrates the mechanism by which D-PCA facilitates the chelation of copper ions (Cu2+) and its impact on cuproptosis in RIRI.
 |
Figure 10 Schematic diagram of the mechanism of cuproptosis. This illustration demonstrates how D-PCA chelates copper ions (Cu2+) affecting the cuproptosis pathway in RIRI. Created in BioRender. Xu, (C) (2024) https://BioRender.com/c10m189. |
Discussion
In this study, we identified and validated the critical role of cuproptosis-related genes (CRDEGs) in RIRI. By integrating bioinformatics, machine learning, and experimental validation, we demonstrated that these genes are closely associated with mitochondrial dysfunction and immune response, key processes in RIRI pathology. Our diagnostic models, based on CRDEGs, showed relatively promising predictive accuracy across multiple datasets, highlighting their potential as biomarkers for early diagnosis. Moreover, experimental validation further confirmed the involvement of cuproptosis in RIRI, suggesting that targeting this pathway could offer new therapeutic strategies. These findings provide novel insights into the molecular mechanisms of RIRI and underscore the clinical relevance of cuproptosis as both a diagnostic marker and a therapeutic target.
We initially characterized the expression profiles of a set of cuproptosis-related genes in the dataset GSE43974 across control and RIRI groups in this study. Among the 38 cuproptosis-related genes, 18 CRDEGs including LIPT1, NLRP3, LIPA, NFE2L2, PDHA1, NDUFA1, NDUFA8, NDUFC1, NDUFV2, PDHB, NDUFB2, NDUFB6, SDHB, GLRX5, DLAT, DLD, ISCA2, and NDUFB10 were identified. Correlation analysis during the RIRI process suggested strong interactions between proteins such as SDHB and NDUFB6, and a negative correlation trend between LIPT1 and NLRP3 with other genes, possibly reflecting their similar or opposing functions. The research by Zhenya Guo et al16 also supports our findings, showing a strong positive correlation between SDHB and NDUFB6 in acetaminophen-induced liver injury. Enrichment analysis indicated that CRDEGs are closely associated with pathways involved in reactive oxygen species, oxidative phosphorylation, and fatty acid oxidation, and primarily participate in critical mitochondrial respiratory processes such as the electron transport chain and aerobic respiration. Tsvetkov et al’s6 discovery that cuproptosis results from the direct binding of copper to components of the TCA cycle, leading to the aggregation of lipoylated proteins and loss of Fe-S cluster proteins, ultimately causing mitochondrial respiratory dysfunction, aligns closely with our bioinformatics analysis results.
The infiltration of immune cells is a hallmark event in the process of RIRI. Therefore, we explored the relationship between cuproptosis and immune cell infiltration. Our analysis demonstrated that the levels of Plasma Cells, Follicular Helper T Cells, Activated Mast Cells, and Eosinophils were significantly elevated in the RIRI group, consistent with previous studies indicating the onset of acute inflammation and activation of the immune system. Prior research has shown that an increase in Eosinophils plays a crucial protective role in hepatic IRI, where eosinophil-derived IL-4 (but not IL-13) is closely associated with the reparative functions of liver cells.17,18 However, the role of eosinophils in RIRI has yet to be explored. Our bioinformatics analysis revealed that pro-inflammatory M1 macrophages were notably less numerous in the RIRI group, a finding that contradicts previous studies. Xie et al19 reported that M1 macrophages appear in renal tissues during the early stages (within 48 hours) of ischemia-reperfusion injury, while M2 macrophages dominate during the later stages. The transformation of macrophages from the M1 to the M2 phenotype, which produces a plethora of growth factors, promotes the regeneration and repair of renal tubular epithelial cells. Thus, the balance between M1 and M2 determines the self-repair progress of AKI.20 This discrepancy may relate to differences in the timing of tissue biopsy collection; hence, further investigation is necessary. Correlation analysis indicated that cuproptosis marker genes are associated with the expression of various immune cells, particularly SDHB and LIPA, which appear to be extensively involved in the immunoregulation processes during RIRI. The expression of SDHB is closely related to the expression of M2 macrophages, while the expression of LIPA shows a positive correlation with an increase in eosinophils. A major characteristic of RIRI is the reduction in mitochondrial TCA cycle activity, leading to mitochondrial dysfunction, fragmentation, swelling, cristae reduction or disappearance, and the release of mitochondrial DNA (mtDNA).21 These changes and the release of products further influence the activation and differentiation of immune cells, suggesting that cuproptosis-related genes may play a role in activating and regulating the immune system during RIRI.
In addition to CRDEGs, we performed a clustering analysis to categorize RIRI patients into subgroups based on their molecular profiles. This clustering allowed us to identify distinct molecular subtypes of RIRI, each characterized by different pathway activities, particularly related to oxidative phosphorylation and immune responses. These subgroups were critical for our subsequent WGCNA, which enabled the identification of key gene modules associated with each patient cluster. Similar clustering approaches have been successfully used in other studies to reveal molecular subtypes and identify key biological processes in kidney-related diseases and IRI. For instance, recent research demonstrated the importance of mitophagy-associated immune microenvironment (IME) genes in predicting RIRI prognosis.22 This study identified key genes such as FUNDC1, SQSTM1, and CDKN1A that contribute to excessive mitophagy and immune infiltration in IRI, findings that align with our results, where mitochondrial dysfunction and immune responses were prominent in RIRI subtypes. Furthermore, both studies identified immune cell types like neutrophils and M1 macrophages as critical components of the immune response after IRI.
To comprehensively, fully, and accurately establish gene diagnostic prediction models based on cuproptosis-related differentially expressed genes, we utilized tools such as LASSO logistic regression, SVM-RFE algorithms, WGCNA, and machine learning algorithms to construct two types of gene diagnostic models: the Cuproptosis Marker Gene Model and the 5 hub-Gene SVM Model. The Cuproptosis Marker Gene Model includes four key genes: LIPA, LIPT1, SDHB, and NDUFB6; the 5 hub-Gene SVM Model comprises MOAP1, PPP2CA, SYL2, ZZZ3, and SFRS2. LIPA is a member of the radical S-adenosyl methionine (SAM) enzyme superfamily, responsible for catalyzing the final step in the biosynthesis of lipoic acid, a cofactor necessary for multi-enzyme complexes. Deficiencies in lipoic acid biosynthesis can lead to various diseases, including multiple mitochondrial dysfunctions syndrome, resulting in severe developmental delays, seizures, and mortality.23 LIPT1, or Lipoyltransferase 1, primarily functions to transfer lipoic acid (LA) onto proteins that play crucial roles in mitochondrial metabolism and the TCA cycle.24 SDHB encodes the iron-sulfur protein subunit of succinate dehydrogenase (Complex II), a key enzyme in the TCA cycle and the electron transport chain.25 NDUFB6 encodes a protein that is a subunit of the multi-subunit NADH: ubiquinone oxidoreductase (Complex I). Complex I, located in the mitochondrial inner membrane, consists of 45 different subunits and has NADH dehydrogenase and oxidoreductase activities.26 During IRI, cellular copper overload can elevate lipoylation of TCA cycle enzymes, with copper ions binding to the lipoyl portion, leading to the aggregation of lipoylated proteins and consequently the loss of Fe-S cluster-containing proteins like SDHB and NDUFB6. Our bioinformatics analysis showed that the expression levels of SDHB and NDUFB6 are negatively correlated with cellular levels of cuproptosis. MOAP1 plays a central role in regulating apoptosis, containing a Bcl-2 homology 3 (BH3) motif necessary for binding to BAX. When overexpressed, this gene has been shown to mediate caspase-dependent apoptosis.27 PPP2CA, located on human chromosome 5, is the catalytic subunit of the protein phosphatase 2A (PP2A) complex. It is a serine/threonine phosphatase that plays a key role in protein dephosphorylation, related to the negative control of cell growth and division.28 SCYL2 is a pseudokinase with a kinase-like domain but typically lacks kinase activity, containing specific domains such as HEAT repeats and Tetratricopeptide repeats (TPR). It functions in intracellular transport systems, particularly in the protein transport and processing within the Golgi apparatus. Additionally, this protein acts in the Wnt signaling pathway through targeting Frizzled 5 (Fzd5) for lysosomal degradation.29 ZZZ3 plays an important role in epigenetic regulation, especially as part of histone modification complexes, such as interacting with the ADA2a-containing complex (ATAC complex). ZZZ3 interacts directly with specific DNA sequences and mRNA or non-coding RNAs (such as miRNAs) through its zinc finger domains, regulating the transcriptional activity of specific genes.30 SFRS2 is a component of the spliceosome, essential for the splicing of precursor mRNA. It regulates the selection of splice sites by recognizing and binding to specific splicing enhancer sequences.31 In the validation using external datasets, both diagnostic models demonstrated substantial diagnostic efficacy, indicating that the targets identified within these models may be involved in the mechanisms underlying RIRI. However, considering the variability across datasets, further research is needed to confirm the roles of these targets and to explore their potential as biomarkers or therapeutic targets in RIRI. These findings provide a basis for future research into the biological significance of cuproptosis-related genes in this context.
Our in vivo and in vitro experimental results demonstrate that cuproptosis is an objectively occurring pathophysiological phenomenon during the process of RIRI. We elucidated the occurrence of cuproptosis and its relationship with renal damage using methods such as tissue copper ion determination, TUNEL, HE, PAS, and JC-1 staining, alongside the application of the copper chelator D-PCA, at both in vivo and in vitro levels. Additionally, the expression levels of the cuproptosis marker genes, SDHB and NDUFB6, were verified using immunofluorescence and Western blot (WB) analyses. In recent years, urinary trace elements, particularly urinary copper ions, have been recognized as novel early biomarkers for AKI under conditions of RIRI, and an increase in urinary copper ions is closely associated with higher mortality rates.12 This suggests that during IR, the efficiency of copper ion filtration and reabsorption in the kidneys is altered, leading to disturbances in copper metabolism and balance within the body. Qiu et al32 found that in acute kidney injury induced by cisplatin, copper ion overload occurs within renal tubular epithelial cells, and knocking out SLC31A1, an inward copper ion transporter, significantly alleviates renal damage. This finding is consistent with our study. A recently published study showed that the copper chelator Ammonium tetrathiomolybdate can protect against oxidative stress in cisplatin-induced acute kidney injury by inhibiting the ubiquitination of NRF2;33 however, the study did not specifically explore the relationship between this drug and cuproptosis.
Nevertheless, our study has the following limitations: (i) only a preliminary verification of cuproptosis in RIRI was conducted, and the specific underlying mechanisms were not thoroughly explored; (ii) due to ethical issues, local clinical samples such as renal biopsy samples and urine samples from RIRI patients were not included in the study; (iii) due to the lack of RIRI datasets, only one public dataset was included, which might introduce bias. These limitations will continue to guide our work in the future.
Conclusion
This study, by integrating bioinformatics analysis, machine learning, and experimental validation, demonstrates the significant role of cuproptosis in RIRI. We identified cuproptosis-related differentially expressed genes (CRDEGs), which are strongly associated with mitochondrial dysfunction and immune responses in RIRI. Two diagnostic models were developed—the Cuproptosis Marker Gene Model (CMGM) and a five-hub-gene SVM model (5HGSM)—both of which exhibited robust predictive performance across multiple datasets. Experimental validation using copper chelation therapy showed its potential to mitigate renal damage by targeting cuproptosis-related pathways. The findings provide new insights into the molecular mechanisms of RIRI, highlighting cuproptosis as a potential therapeutic target. The diagnostic models offer tools for early detection, and copper chelation presents a promising strategy for the prevention and treatment of RIRI. Future research should focus on further elucidating the underlying mechanisms and validating these therapeutic strategies in clinical settings.
Data Sharing Statement
The datasets generated and/or analysed during the current study are available in the Gene Expression Omnibus (GEO) repository, GSE43974 (GEO Accession viewer (nih.gov)), GSE30718 (GEO Accession viewer (nih.gov)), GSE139061 (GEO Accession viewer (nih.gov)).
Funding
This work was supported by The Special Fund Project for Central Guiding Local Science and Technology Development (No.24ZYQA050); Traditional Chinese medicine scientific research project of Gansu province(No. GZKG-2024-70); Lanzhou University cui ying students research training program(Grant No. CYXZ2024-03); Cuiying Scientific and Technology Innovation Program of Lanzhou University Second Hospital (No. CY2021-QN-B15); Science and Technology Fund Program of Gansu Province (No. 21JR7RA428); Science and Technology Programme Project of Lanzhou Science and Technology Bureau(No. 2023-4-39); Cuiying Scientific and Technology Innovation Program of Lanzhou University Second Hospital (No. CY2023-MS-B10).
Disclosure
The authors report no conflicts of interest in this work.
References
1. Pefanis A, Ierino FL, Murphy JM, Cowan PJ. Regulated necrosis in kidney ischemia-reperfusion injury. Kidney Int. 2019;96(2):291–301. doi:10.1016/j.kint.2019.02.009
2. Choi ME. Autophagy in kidney disease. Annu Rev Physiol. 2020;82(1):297–322. doi:10.1146/annurev-physiol-021119-034658
3. Rojas-Morales P, Pedraza-Chaverri J, Tapia E. Ketone bodies, stress response, and redox homeostasis. Redox Biol. 2020;29:101395. doi:10.1016/j.redox.2019.101395
4. Jiayi H, Ziyuan T, Tianhua X, et al. Copper homeostasis in chronic kidney disease and its crosstalk with ferroptosis. Pharmacol Res. 2024;202:107139. doi:10.1016/j.phrs.2024.107139
5. Garza NM, Swaminathan AB, Maremanda KP, Zulkifli M, Gohil VM. Mitochondrial copper in human genetic disorders. Trends Endocrinol Metab. 2023;34(1):21–33. doi:10.1016/j.tem.2022.11.001
6. Tsvetkov P, Coy S, Petrova B, et al. Copper induces cell death by targeting lipoylated TCA cycle proteins. Science. 2022;375(6586):1254–1261. doi:10.1126/science.abf0529
7. Bitter RM, Oh S, Deng Z, Rahman S, Hite RK, Yuan P. Structure of the Wilson disease copper transporter ATP7B. Sci Adv. 2022;8(9):eabl5508. doi:10.1126/sciadv.abl5508
8. Qin Y, Liu Y, Xiang X, et al. Cuproptosis correlates with immunosuppressive tumor microenvironment based on pan-cancer multiomics and single-cell sequencing analysis. Mol Cancer. 2023;22(1):59. doi:10.1186/s12943-023-01752-8
9. Mao C, Wang M, Zhuang L, Gan B. Metabolic cell death in cancer: ferroptosis, cuproptosis, disulfidptosis, and beyond. Protein Cell. 2024:pwae003.
10. Sieckmann T, Schley G, Ögel N, et al. Strikingly conserved gene expression changes of polyamine regulating enzymes among various forms of acute and chronic kidney injury. Kidney Int. 2023;104(1):90–107. doi:10.1016/j.kint.2023.04.005
11. Zhu SY, Zhou WQ, Niu YY, et al. COX17 restricts renal fibrosis development by maintaining mitochondrial copper homeostasis and restoring complex IV activity. Acta Pharmacol Sin. 2023;44(10):2091–2102. doi:10.1038/s41401-023-01098-3
12. Gardner DS, Allen JC, Goodson D, et al. Urinary trace elements are biomarkers for early detection of acute kidney injury. Kidney Int Rep. 2022;7(7):1524–1538. doi:10.1016/j.ekir.2022.04.085
13. Xu X, Li H, Tong B, et al. Biomimetic nano-regulator that induces cuproptosis and lactate-depletion mediated Ros storm for metalloimmunotherapy of clear cell renal cell carcinoma. Adv Healthc Mater. 2024;13(28). doi:10.1002/adhm.202470182.
14. Chen Y, Liao L, Wang B, Wu Z. Identification and validation of immune and cuproptosis - related genes for diabetic nephropathy by WGCNA and machine learning. Front Immunol. 2024;15:1332279. doi:10.3389/fimmu.2024.1332279
15. Xiao F, Huang G, Yuan G, et al. Identification and validation of potential diagnostic signature and immune cell infiltration for HIRI based on cuproptosis-related genes through bioinformatics analysis and machine learning. Front Immunol. 2024;15:1372441. doi:10.3389/fimmu.2024.1372441
16. Guo Z, Liu J, Liang G, et al. Identification and validation of cuproptosis-related genes in Acetaminophen-induced liver injury using bioinformatics analysis and machine learning. Front Immunol. 2024;15:1371446. doi:10.3389/fimmu.2024.1371446
17. Yang Y, Xu L, Atkins C, et al. Novel IL-4/HB-EGF-dependent crosstalk between eosinophils and macrophages controls liver regeneration after ischaemia and reperfusion injury. Gut. 2024;73(9):1543–1553. doi:10.1136/gutjnl-2024-332033
18. Xu L, Yang Y, Wen Y, et al. Hepatic recruitment of eosinophils and their protective function during acute liver injury. J Hepatol. 2022;77(2):344–352. doi:10.1016/j.jhep.2022.02.024
19. Xie X, Yang X, Wu J, et al. Exosome from indoleamine 2,3-dioxygenase-overexpressing bone marrow mesenchymal stem cells accelerates repair process of ischemia/reperfusion-induced acute kidney injury by regulating macrophages polarization. Stem Cell Res Ther. 2022;13(1):367. doi:10.1186/s13287-022-03075-9
20. Wang Y, Chang J, Yao B, et al. Proximal tubule-derived colony stimulating factor-1 mediates polarization of renal macrophages and dendritic cells, and recovery in acute kidney injury. Kidney Int. 2015;88(6):1274–1282. doi:10.1038/ki.2015.295
21. Li J, Sun X, Yang N, et al. Phosphoglycerate mutase 5 initiates inflammation in acute kidney injury by triggering mitochondrial DNA release by dephosphorylating the pro-apoptotic protein Bax. Kidney Int. 2023;103(1):115–133. doi:10.1016/j.kint.2022.08.022
22. Chen RY, Li DW, Xie H, et al. Gene signature and prediction model of the mitophagy-associated immune microenvironment in renal ischemia-reperfusion injury. Front Immunol. 2023;14:1117297. doi:10.3389/fimmu.2023.1117297
23. McCarthy EL, Booker SJ. Destruction and reformation of an iron-sulfur cluster during catalysis by lipoyl synthase. Science. 2017;358(6361):373–377. doi:10.1126/science.aan4574
24. Habarou F, Hamel Y, Haack TB, et al. Biallelic mutations in LIPT2 cause a mitochondrial lipoylation defect associated with severe neonatal encephalopathy. Am J Hum Genet. 2017;101(2):283–290. doi:10.1016/j.ajhg.2017.07.001
25. Goncalves J, Moog S, Morin A, et al. Loss of SDHB promotes dysregulated iron homeostasis, oxidative stress, and sensitivity to ascorbate. Cancer Res. 2021;81(13):3480–3494. doi:10.1158/0008-5472.CAN-20-2936
26. Dieteren CE, Willems PH, Vogel RO, et al. Subunits of mitochondrial complex I exist as part of matrix- and membrane-associated subcomplexes in living cells. J Biol Chem. 2008;283(50):34753–34761. doi:10.1074/jbc.M807323200
27. Chang HC, Tao RN, Tan CT, Wu YJ, Bay BH, Yu VC. The BAX-binding protein MOAP1 associates with LC3 and promotes closure of the phagophore. Autophagy. 2021;17(11):3725–3739. doi:10.1080/15548627.2021.1896157
28. Hoermann B, Kokot T, Helm D, et al. Dissecting the sequence determinants for dephosphorylation by the catalytic subunits of phosphatases PP1 and PP2A. Nat Commun. 2020;11(1):3583. doi:10.1038/s41467-020-17334-x
29. Liu H, Fredimoses M, Niu P, et al. EPRS/GluRS promotes gastric cancer development via WNT/GSK-3β/β-catenin signaling pathway. Gastric Cancer. 2021;24(5):1021–1036. doi:10.1007/s10120-021-01180-x
30. Mi W, Zhang Y, Lyu J, et al. The ZZ-type zinc finger of ZZZ3 modulates the ATAC complex-mediated histone acetylation and gene activation. Nat Commun. 2018;9(1):3759. doi:10.1038/s41467-018-06247-5
31. Lu Y, Loh YH, Li H, et al. Alternative splicing of MBD2 supports self-renewal in human pluripotent stem cells. Cell Stem Cell. 2014;15(1):92–101. doi:10.1016/j.stem.2014.04.002
32. Qiu Z, Liu Q, Wang L, et al. The copper transporter, SLC31A1, transcriptionally activated by ELF3, imbalances copper homeostasis to exacerbate cisplatin-induced acute kidney injury through mitochondrial dysfunction. Chem Biol Interact. 2024;393:110943. doi:10.1016/j.cbi.2024.110943
33. Qi H, Shi H, Yan M, et al. Ammonium tetrathiomolybdate relieves oxidative stress in cisplatin-induced acute kidney injury via NRF2 signaling pathway. Cell Death Discov. 2023;9(1):259. doi:10.1038/s41420-023-01564-1
 © 2024 The Author(s). This work is published and licensed by Dove Medical Press Limited. The
full terms of this license are available at https://www.dovepress.com/terms.php
and incorporate the Creative Commons Attribution
- Non Commercial (unported, 3.0) License.
By accessing the work you hereby accept the Terms. Non-commercial uses of the work are permitted
without any further permission from Dove Medical Press Limited, provided the work is properly
attributed. For permission for commercial use of this work, please see paragraphs 4.2 and 5 of our Terms.
© 2024 The Author(s). This work is published and licensed by Dove Medical Press Limited. The
full terms of this license are available at https://www.dovepress.com/terms.php
and incorporate the Creative Commons Attribution
- Non Commercial (unported, 3.0) License.
By accessing the work you hereby accept the Terms. Non-commercial uses of the work are permitted
without any further permission from Dove Medical Press Limited, provided the work is properly
attributed. For permission for commercial use of this work, please see paragraphs 4.2 and 5 of our Terms.