")
Back to Journals » Journal of Inflammation Research » Volume 17
Exploring the Role of Inflammatory Genes and Immune Infiltration in Vestibular Schwannomas Pathogenesis
Authors Gan J, Zhang Y, Lei D, Zhou Y, Zhao H, Wang L
Received 1 July 2024
Accepted for publication 26 October 2024
Published 6 November 2024 Volume 2024:17 Pages 8335—8353
DOI https://doi.org/10.2147/JIR.S476745
Checked for plagiarism Yes
Review by Single anonymous peer review
Peer reviewer comments 2
Editor who approved publication: Dr Tara Strutt
Jinlu Gan,1,* Yanling Zhang,2,* Deqiang Lei,1 Yingchun Zhou,1 Hongyang Zhao,1 Lei Wang1
1Department of Neurosurgery, Union Hospital, Tongji Medical College, Huazhong University of Science and Technology, Wuhan, 430022, People’s Republic of China; 2Department of Obstetrics and Gynecology, Union Hospital, Tongji Medical College, Huazhong University of Science and Technology, Wuhan, 430022, People’s Republic of China
*These authors contributed equally to this work
Correspondence: Lei Wang, Department of Neurosurgery, Union Hospital, Tongji Medical College, Huazhong University of Science and Technology, 1277 Jiefang Avenue, Wuhan, Hubei Province, 430022, People’s Republic of China, Email [email protected]; [email protected] Hongyang Zhao, Department of Neurosurgery, Union Hospital, Tongji Medical College, Huazhong University of Science and Technology, 1277 Jiefang Avenue, Wuhan, Hubei Province, 430022, People’s Republic of China, Email [email protected]
Background: Vestibular schwannomas (VSs) exhibit a range of tumor behaviors, such as growth patterns and auditory dysfunction. Recent research has offered insights into the inflammatory microenvironment in modulating tumor dynamics. This study investigates the role of inflammatory genes and immune infiltration in VS pathogenesis.
Methods: We retrieved mRNA microarray data of VSs and normal nerves from the GEO database (GSE141801, GSE108524, and GSE56597), focusing on bioinformatic analysis of inflammatory response genes. Based on the evidence provided by bioinformatics analysis, we assessed the expression levels of Iba-1, IL-10, IL-10RA, and IL-18 in 31 VS patients via immunohistochemistry and delved into their association with tumor size and auditory dysfunction.
Results: We identified 1117 differentially expressed genes (DEGs) in VSs compared to normal nerves, showing an upregulation in inflammatory pathways. Intersection with inflammatory response genes (IRG) yielded 41 significant IRG-DEGs. Network analysis identified a core module of 10 IRG-DEGs and 11 hub genes, most of which were inflammatory cytokines. Immune infiltration analysis showed macrophage activation and M2 polarization. These findings were validated in an independent dataset (GSE39645). To further explore the association between inflammation and tumor behaviors, immunohistochemistry analysis was conducted on VS samples and the results exhibited notable associations between the macrophage marker (Iba1) and inflammatory cytokines (IL-10, IL-10RA, and IL-18) with both tumor size and auditory dysfunction. In particular, the multiple regression analysis of inflammatory cytokines demonstrated that IL-10 and IL-10RA were statistically significant predictors of tumor size, while IL-18 was associated with hearing loss.
Conclusion: Our study underscores the role of inflammation in VS pathogenesis, showing that macrophage activation with M2 polarization and the expression of inflammatory cytokines, especially IL-10/IL-10RA and IL-18, are linked to tumor size and auditory function. This study highlights the inflammatory landscape’s impact on VS behaviors, providing a basis for targeted therapeutic strategies.
Keywords: vestibular schwannomas, inflammatory response, macrophages, immune infiltration, auditory dysfunction, tumor size
Introduction
Vestibular schwannomas (VSs) are benign tumors arising from myelin-forming Schwann cells (SCs) of the VIII cranial nerve, comprising about 85% of cerebellopontine angle tumors with a most recent incidence rate of 3.0 to 5.2 per 100,000 person-years.1,2 In the clinical setting, VSs are commonly sporadic and unilateral, while bilateral VSs, approximately 5%, are related to Neurofibromatosis Type 2.3 The initial clinical manifestation of VSs varies but is featured by auditory and balance dysfunction. In occult development, VSs may grow and affect adjacent nerves, nearby vessels, and the brainstem leading to severe neurological manifestations (eg, facial paralysis, facial numbness, choking, dysphagia, hydrocephalus, etc).4 Currently, VSs are managed through conservative strategies, microsurgery, and radiotherapy.5 Balancing tumor control with the preservation of neurological functions presents a significant challenge, particularly in cases involving large tumors. Moreover, profound hearing loss, a potential sequela of surgical or radiological interventions, markedly diminishes patients’ life quality. Thus, exploring and understanding the intrinsic behaviors of VSs, especially tumor size and auditory dysfunction, is crucial for developing innovative therapeutic approaches.
VSs exhibit a range of tumor behaviors, such as growth patterns and auditory dysfunction.2,6 What renders certain tumors quiescent over extended periods, while others proliferate progressively? How come auditory impairments manifest early in some cases, yet others, even with large tumor size, continue to maintain functional hearing? Unfortunately, the underlying mechanism of varied VS behaviors remains unclear. Recent research offered insights into the tumor microenvironment, particularly inflammation, in modulating tumor dynamics. Emerging evidence suggests that VSs are not merely proliferation of Schwann cells but complex inflammatory microenvironment with the crosstalk between them.7 The key inflammatory events include macrophage infiltration, inflammatory cytokine expression, activation of various pro-inflammatory molecular pathways, and the interaction between VS cells and inflammation.7 In the histological examination, Rossi et al revealed a moderate presence of macrophages in 96% of VS tumors with varying levels of CD8+ and CD4+ lymphocytes with limited B-lymphocytes,8 and their presence, especially M2 type macrophage, seemed to contribute to angiogenesis and tumor growth.9 More interestingly, bioinformatics analysis of VS patients with tinnitus identified that the allograft rejection pathway, an inflammatory pathway, and associated genes, such as MMP9, CXCL9, and IL16, were differentially expressed compared to those without, suggesting more active inflammation processes in the patients with tinnitus.10 However, it is important to note that this evidence is based on gene set enrichment analysis (GSEA), which suggests an association rather than a definitive causal link. Further experimental validation is necessary to confirm these findings and elucidate inflammation’s role in VS-associated tinnitus.
In our study, we identified the inflammatory response genes by analyzing mRNA microarray data. Using the leads from the bioinformatic analysis, we specifically focus on macrophage activation and associated inflammatory cytokines to investigate their correlation with tumor size and auditory dysfunction (the study design flowchart refers to Figure 1). Combining the genomic profiling and molecular analysis of VS samples, we aim to delve into the pivotal role of inflammatory response-related genes and immune infiltration in VS pathogenesis.
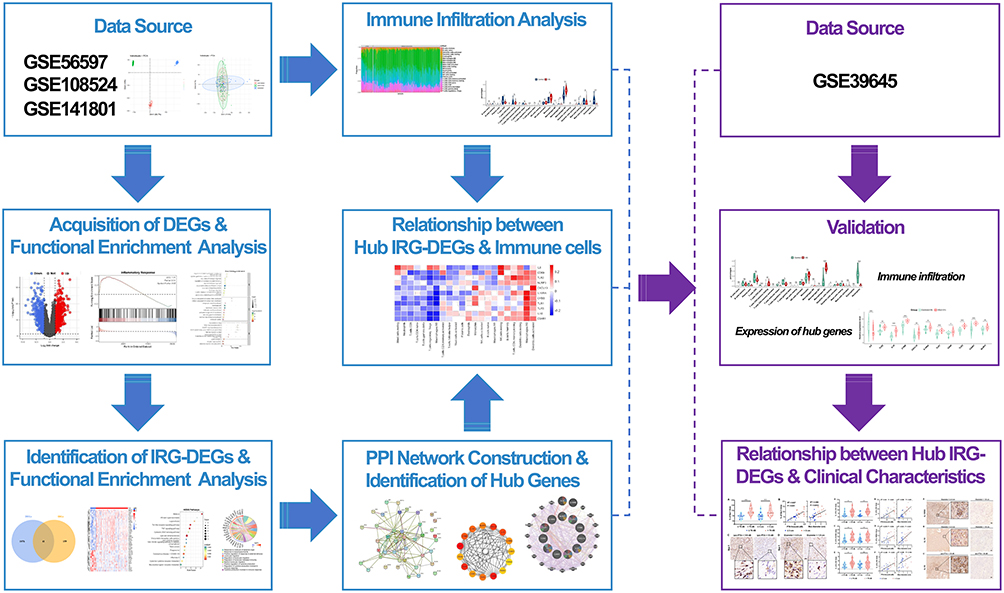 |
Figure 1 The study design flowchart. |
Material and Methods
Data Acquisition
The mRNA microarray expression profiles of VS and normal nerves were obtained from NCBI GEO database (http://www.ncbi.nlm.nih.gov/geo),11 including four datasets (GSE141801, GSE108524, GSE56597, and GSE39645). Excluding the irradiated ones, a total of 116 VS tissues and 20 normal nerve tissues were selected from GSE141801, GSE108524, and GSE56597. After converting the probe IDs or transcript IDs to the gene names, we combined three data sets per established protocol by using the R “merge” function (R version 4.2.3), and adjusted batch effects with the ComBat function in the R package “sva” (version 3.46.0).12 Principal component analysis (PCA) was performed to visualize the reduction of batch effects. The dataset GSE39645 served for external validation, including 31 VS tissues and 9 normal nerve tissues. The study design flowchart details our approach in Figure 1.
Selection of Differentially Expressed Genes and Functional Enrichment Analysis
We utilized linear model analyses with the “limma (version 3.54.2)” R package to screen for differentially expressed genes (DEGs) between VSs and normal nerve tissues, and the cutoff was set at adjusted p-value <0.05 and log2FC >1 (up-regulated) or log2FC < −1 (down-regulated). The visualization of DEGs was accomplished using ‘ggplot2’ (version 3.4.2) for volcano plots.
Gene Ontology (GO) enrichment analysis and Kyoto Encyclopedia of Genes and Genomes (KEGG) pathway analysis were conducted by R package “clusterProfiler” (version 4.6.2) to investigate potential biological functions between VSs and normal control nerves. In addition, GSEA was performed on the differential analysis results using the “h.all.v2023.1.Hs.entrez.gmt” dataset obtained from the Molecular Signature Database (MSigDB) via R package “clusterProfiler”.13 False discovery rate (FDR) < 0.05 was set as the cut-off value for determining statistical significance.
Identifying Inflammation Response-Related Differentially Expressed Genes and Functional Enrichment Analysis
From GSEA (http://www.gsea-msigdb.org/gsea/index.jsp),14 we extracted 200 genes defining inflammatory response in the gene set M5932. By intersecting these genes with previously identified DEGs, we identified inflammatory response-related DEGs (IRG-DEGs) using a Venn diagram, which was then visualized as a heatmap with the R package “pheatmap” (version 1.0.12). Subsequently, we conducted GO and KEGG pathway analyses on the IRG-DEGs to delve deeper into their top signaling pathways.
Protein-Protein Interaction Network and Module Analysis
We constructed the Protein-Protein Interaction (PPI) network for IRG-DEGs using the STRING database (version 11.5, https://string-db.org/). The visualization and further analysis of this PPI network were carried out with Cytoscape software (version 3.9.1), employing its Molecular Complex Detection (MCODE) plug-in to identify key functional modules (the selection criteria: degree cutoff = 2, node score cutoff = 0.2, K-core = 2, and max depth = 100).
Identification and Co-Expression Network of Hub Genes
CytoHubba plug-in of Cytoscape software was used to identify hub genes, and here, we used seven common algorithms (MCC, MNC, Degree, Closeness, Radiality, Stress, EPC) to evaluate and select hub genes. Subsequently, the intersections of these seven sets were visualized using the R package “UpSetR” (version 1.4.0) to figure out common hub genes. We constructed a co-expression network of these common hub genes via GeneMANIA (http://www.genemania.org/), a reliable tool for identifying internal associations in gene sets.15
Immune Infiltration Analyses
We utilized the CIBERSORTx platform (https://cibersortx.stanford.edu) to estimate the levels of immune cell infiltration across 22 cell types in the samples by running the LM22 signature over 1000 permutations on normalized gene expression matrix data. Samples with a CIBERSORTx output of p < 0.05 were selected for further analysis, with the immune cell infiltration profiles visualized in stacked bar graphs. The composition of immune cells between VSs and normal nerve tissues was statistically analyzed using the Wilcoxon test, with differences depicted through violin plots created with the “ggpubr” R package (version 0.6.0). Spearman correlation between hub genes and infiltrating immune cells was performed by the package ‘psych’ and visualized by the package ‘pheatmap’ in R (version 1.0.12).
Validation of Hub IRG-DEGs and Immune Infiltration in GSE39645
The expressions of the IRG-DEGs were extracted from GSE39645, and the difference between VSs and normal nerve tissues was calculated and visualized by R packages “ggpubr” and “ggplot2”. Differences between VSs and normal tissues were quantified using Wilcoxon tests, with significance set at a p-value <0.05. Additionally, we assessed relative immune cell infiltration levels in GSE39645 using the CIBERSORTx platform, maintaining consistent settings as described previously.
Clinical Sample Collection
We retrospectively reviewed electronic health records for VS patients, who underwent tumor resection in our institute. Patient demographics, including age, gender, and medical history, audiometric evaluations, and MRI scans, were systematically recorded. Patients who received radiation therapy before surgery were excluded. VS samples were harvested during surgical resection. The samples were promptly preserved in 10% neutral-buffered formalin and embedded in paraffin to maintain specimen integrity. The study was conducted according to the guidelines of the Declaration of Helsinki and approved by the ethics committee of the Union Hospital, Tongji Medical College, Huazhong University of Science and Technology (No. 2024-LS-303), and written informed consent was obtained from all patients before their enrollment in the study.
Immunohistochemistry
Paraffin-embedded VS tissue specimens were sectioned at 4 µm, dewaxed, dehydrated, performed antigen retrieval in EDTA retrieval buffer (pH 9.0, DAKO, Carpinteria, CA, USA), and blocked the endogenous peroxidase activity with 3% H2O2 (DAKO) for 25 mins. The samples were incubated with 3% bovine serum albumin (DAKO) in phosphate buffer saline (PBS) for 30 mins to block non-specific binding. Subsequently, the samples were incubated with primary antibodies at 4°C overnight, including rabbit polyclonal anti-IL-18 (1:100, ABclonal, Woburn, MA, USA), anti-IL-10RA (1:100, Cusabio, Houston, TX, USA), anti-IL-10 (1:200, Bioss, Woburn, MA, USA), and anti-Iba1 (1:800, Wako, Shanghai, China). Then, the samples were incubated with HRP-conjugated goat anti-rabbit IgG secondary antibodies (1:500, SeraCare, Milford, MA, USA) at room temperature for 50 mins. Following antibody staining, color was developed with DAB solution (DAKO), and the nuclei were counterstained with hematoxylin. Slides were observed under a microscope (Olympus, Tokyo, Japan) and images were obtained using Pannoramic SCAN (3DHistech, Hungary).
Statistical Analysis
For the bioinformatics analysis, we employed R software (version 4.2.3) for conducting statistical analyses and generating graphical visualizations, specifying the versions of R packages where necessary. In the immunohistochemistry analysis, statistical analyses were performed using Prism (version 8.4, GraphPad Software, Boston, MA, USA). To assess differences between the two groups, we applied either Independent Student’s t-test or Wilcoxon test. Additionally, we explored the relationships between parameters utilizing linear regression analysis.
Results
Identification of Differentially Expressed Genes and Functional Enrichment Analysis in Vestibular Schwannomas
Three VSs GEO datasets (GSE141801, GSE108524, and GSE56597) with a total of 116 VS tissues and 20 normal nerve tissues were selected for analysis. After using the ComBat function, PCA demonstrated that the batch effect had been removed satisfactorily, and mRNA microarray expression profiles were comparable among the three datasets (Supplement Figure 1). Following merging the expression data in the three datasets, differential analysis revealed 1117 DEGs with 614 genes upregulated and 503 genes downregulated in VSs compared to normal nerves (the volcano plot is shown in Figure 2A).
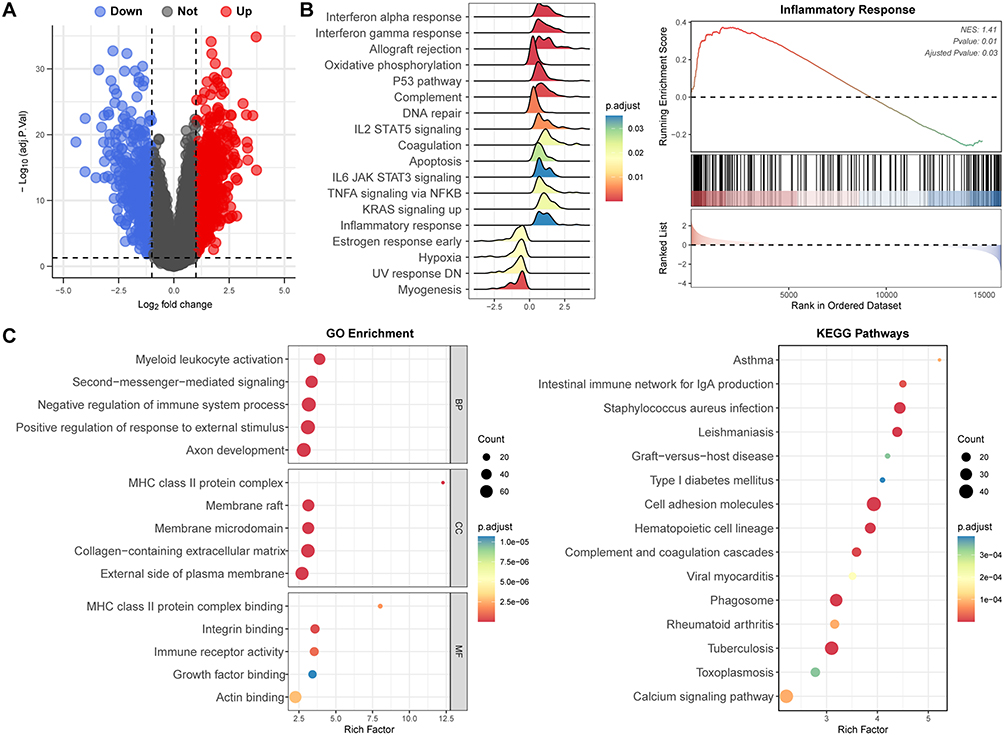 |
Figure 2 Identification of differentially expressed genes (DEGs) and functional enrichment analysis in vestibular schwannomas (VSs). (A) Volcano plot of DEGs in GSE141801, GSE108524, and GSE56597. (B) Gene set enrichment analysis (GSEA) revealed inflammatory response and related pathways were significantly activated in VSs. (C) GO enrichment and KEGG analysis of DEGs further depicted the role of inflammation response-related pathways in VSs. |
Subsequently, the DEGs were analyzed for functional enrichment with GSEA, GO, and KEGG pathway analysis. Using “h.all.v2023.1.Hs.entrez.gmt”gene sets, GSEA revealed that the DEGs were enriched in the inflammatory response associated pathways, such as interferon response, allograft rejection, oxidative phosphorylation, etc. (Figure 2B). The most enriched GO terms classified by Biological Processes (BP), Cellular Components (CC) and Molecular Functions (MF) primarily focused on myeloid leukocyte activation, negative regulation of immune system process, MHC class Il protein complex binding, immune receptor activity, etc. (Figure 2C). The top five dominated KEGG pathways included asthma, intestinal immune network for IgA production, staphylococcus aureus infection, leishmaniasis and graft-versus-host disease (Figure 2C).
Identification of Inflammatory Response-Related Differentially Expressed Genes and Functional Enrichment Analysis in Vestibular Schwannomas
By intersecting 200 genes defining inflammatory response and previously identified DEGs, we pinpointed forty-one overlapped genes in Venn diagrams (Figure 3A), which were regarded as IRG-DEGs. The expression changes of IRG-DEGs, involving 27 upregulated and 14 downregulated genes, were vividly demonstrated by the heat map (Figure 3B). Subsequently, we performed GO enrichment and KEGG pathway analysis to elucidate the functions and related pathways of the IRG-DEGs, revealing 965 significantly related GO biological processes and 36 KEGG signaling pathways. The notably enriched GO terms encompassed regulation of leukocyte migration, response to molecule of bacterial origin, membrane raft, membrane microdomain, lipopeptide binding, NAD+ nucleosidase activity, etc. (Figure 3C). The top five involved KEGG pathways were Malaria, African trypanosomiasis, Legionellosis, Toll-like receptor signaling pathway and TNF signaling pathway (Figure 3D). The chord diagrams demonstrated the relationships between the IRG-DEGs and the associated GO terms (Figure 3E) and KEGG pathways (Figure 3F), providing a comprehensive overview of the data.
 |
Figure 3 Identification of inflammatory response-related differentially expressed genes (IRG-DEGs) and functional enrichment analysis in vestibular schwannomas (VSs). (A) Venn diagram showing 41 overlapped genes between DEGs and inflammatory response genes, identified as IRG-DEGs. (B) The heatmap presenting the relative expression level of IRG-DEGs across VSs and control nerves (CN). (C) Top five enriched items of biological process (BP), cellular component (CC), and molecular function (MF) in GO analysis of IRG-DEGs. (D) Top 15 enriched items in KEGG pathway analysis of IRG-DEGs. (E and F) Chord diagram presenting 10 GO enriched items and 10 KEGG enriched items of the IRG-DEGs. |
Protein-Protein Interactions Network Construction and Modules Analysis
The protein-protein interactions (PPI) network of IRG-DEGs in VSs was constructed using the STRING database, showcasing 41 nodes and 133 edges (Figure 4A). Utilizing the MCODE plugin for in-depth analysis, a critical module was identified within the PPI network, encompassing 10 IRG-DEGs and 43 interaction pairs, which was recognized as a significant cluster (Score=9.556, Figure 4B).
 |
Figure 4 Protein-protein interactions (PPI) Network, hub gene identification and co-expression analysis. (A) The PPI network illustrates 41 proteins engaged in 133 interactions. (B) Molecular Complex Detection network clustering analysis by Cytoscape software. (C) Top 15 hub genes, as identified by the CytoHubba MCC algorithm in Cytoscape. (D) Common hub genes determined through the intersection of Venn diagrams of hub genes identified by the seven algorithms. (E). Co-expression network and function analysis of common hub genes. |
Selection and Analysis of Hub Genes
Based on the PPI network, we employed seven algorithms (MCC, MNC, Degree, Closeness, Radiality, Stress, EPC) from CytoHubba plug-in of Cytoscape software to identify the top 15 hub genes, as listed in Supplement Table 1. The network of the top 15 hub genes determined via the MCC algorithm was shown in Figure 4C. After taking the intersection of the selected hub genes in the seven algorithms via Venn diagram, we found 11 common hub genes, including IL6, TLR2, IL18, CYBB, CXCL10, IL10RA, TLR1, CD69, TLR3, C3AR1, and NLRP3 (Figure 4D), with Supplement Table 2 providing their full names and associated functions.16–27 Utilizing the GeneMANIA database, we further explored the co-expression network and functionalities of these genes, uncovering an intricate PPI network characterized by 66.13% co-expression, 25.13% physical interactions, 5.80% shared protein domains, 1.58% predictions, 0.81% co-localization, and 0.54% pathway involvement (Figure 4E). The pie chart segments within each node correspond to the contribution of the protein to different functions, and top involved functionalities were tumor necrosis factor production, regulation of inflammatory response, cytokine production involved in immune response, neuroinflammatory response, toll-like receptor signaling pathway, pattern recognition receptor signaling pathway, and microglial cell activation (Figure 4E).
Immune Infiltration Analyses and Its Correlation with Hub Genes
To determine the differences in immune cell composition between the VSs and the control nerves, we utilized CIBERSORTx for cell-type deconvolution, which estimated cell-type proportions within bulk tissues based on global gene expression profiles. The identified significant disparities in nine immune cell types between VS tissues and controls, including CD8+ T cells (p = 0.031), regulatory T cells (Tregs, p < 0.001), monocytes (p = 0.004), M0 and M2 macrophages (p =0.001 and p < 0.001, respectively), activated dendritic cells (p < 0.001), resting mast cells (p = 0.045), eosinophils (p = 0.010), and neutrophils (p < 0.001), of which monocytes, M2 macrophages and activated dendritic cells in VSs were significantly enriched (Figure 5A and B). In particular, monocytes and macrophages exhibited significant changes in proportions when comparing VS tissues to controls. Specifically, there was an increase in the proportion of total macrophages, a decrease in M0 macrophages, and alterations in M1 and M2 macrophage proportions—highlighting a significant increase in M2 macrophages (Figure 5C). This shift suggests the crucial role of M2 macrophage polarization in VS pathogenesis. Additionally, we explored the relationship between immune infiltration and the common hub genes, finding a correlation with several hub genes and eight immune cells, including M2 macrophages, M0 macrophages, monocytes, resting mast cells, resting NK cells, Tregs, resting memory CD4+ T cells and activated dendritic cells (Figure 5D). Focusing on M2 macrophages, their proportion was positively correlated with 6 hub genes (IL-10 RA, IL-18, CYBB, TLR1, TLR3 and C3AR1, Figure 5D).
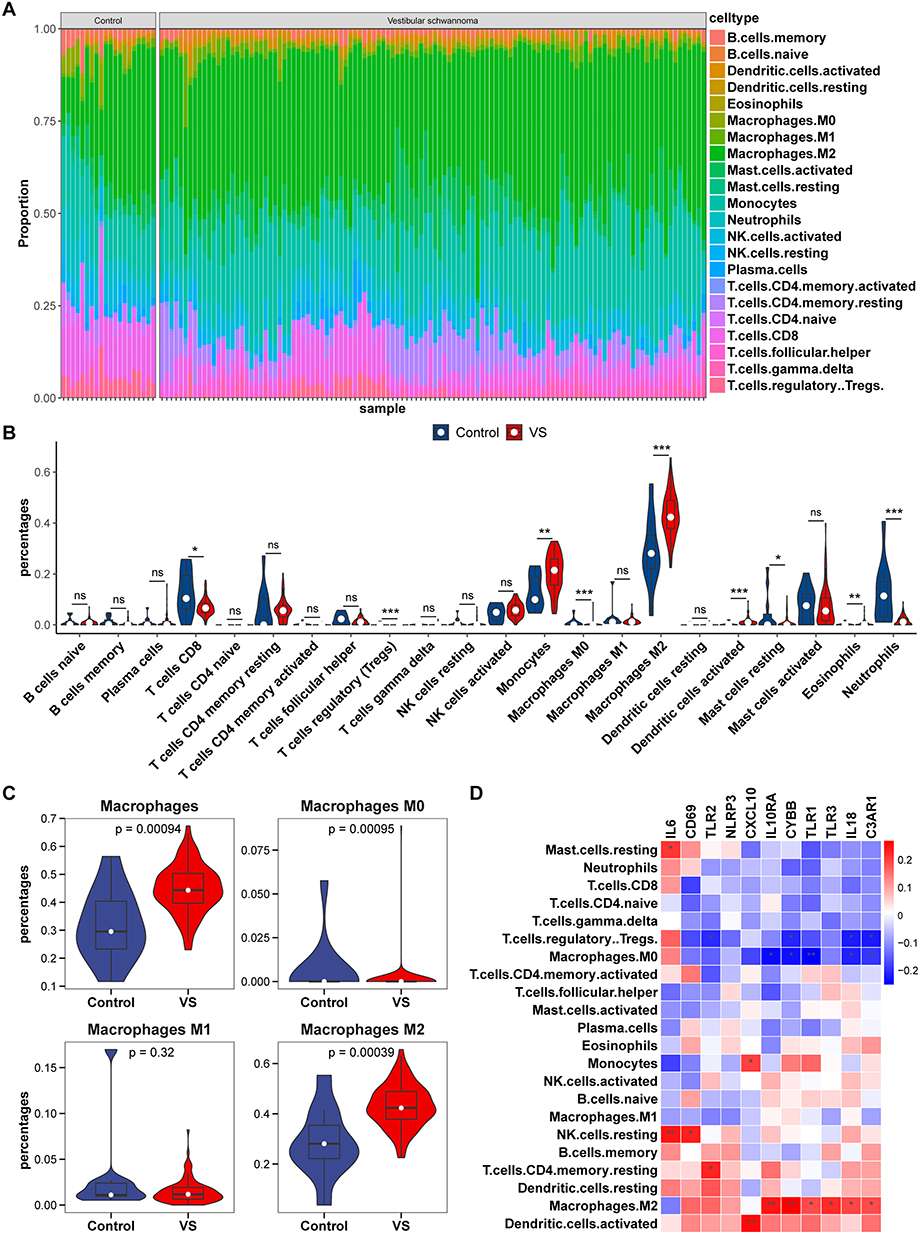 |
Figure 5 The landscape of immune infiltration in vestibular schwannomas (VSs) and the correlation between immune infiltration and hub genes. (A) Proportion of immune cell types across samples. Each stacked segment represented the relative proportion of an immune cell type in each sample. Cell types were color-coded as indicated in the legend. (B) Comparison of immune cell proportions between VSs and control group. (C) Differential distribution of macrophages and its subsets in VS versus control groups. (D) the heatmap of hub gene expression correlations across immune cell types. * p<0.05, ** p<0.01, *** p<0.001. |
Validation of Immune Infiltration and Hub Genes
To corroborate our findings, we employed an independent dataset GSE39645 to repeat the immune Infiltration analysis and validate the expression levels of hub genes. In the GSE39645, VS samples displayed a pronounced infiltration of M2 macrophages, resting memory CD4+ T cells, and dendritic cells, whereas the control group predominantly exhibited neutrophils, Treg cells, naive CD4 T cells, and follicular helper T cells (Figure 6A). Consistent with earlier observations, the expression profiles of 11 key IRG-DEGs were extracted, and the same expression profile was observed in the validated dataset (Figure 6B). This cross-dataset validation strengthened the credibility of the hub gene expression patterns and immune infiltration in our analysis.
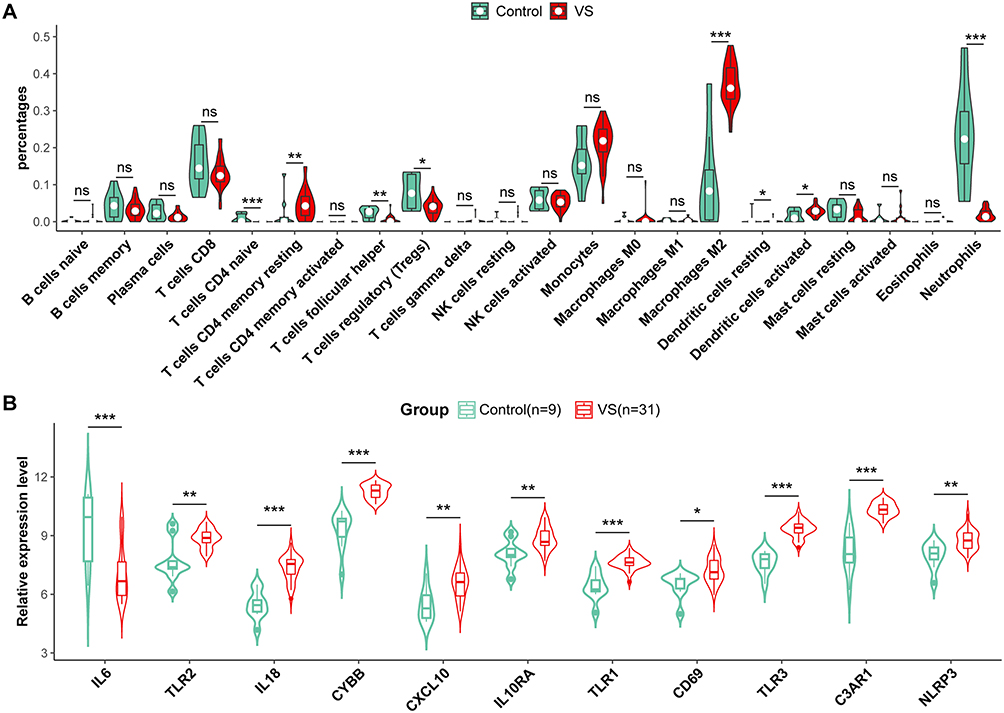 |
Figure 6 Validation of immune infiltration and hub genes in GSE39645. (A) The violin plot of the immune cell proportions demonstrates the difference between VS and the control group in GSE39645. (B) Relative expression levels of 11 hub genes between VS and control group in GSE39645. * p<0.05, ** p<0.01, *** p<0.001. |
Patients Characteristics
A total of 31 patients diagnosed with VSs who underwent surgery between May 2022 and April 2023 were involved in this study. Patients with neurofibromatosis Type 2 or recurrent VSs were excluded. Among the individuals, 19 (61.29%) were female and 12 (38.71%) were male. The average age was 54.0 ± 11.5 years old with a majority (54.84%) in the range of 50 to 60 years old. The average tumor size, determined by the maximum diameter in MRI scan, was 3.3 ± 0.7 cm with 15 individuals (48.39%) at Stage II–III and 16 (51.61%) at Stage IV. With respect to auditory dysfunction on the affected side, the average pure tone audiometry (PTA) was 75.7 ± 33.1 dB with 15 participants (48.39%) having a PTA of 70dB or less and 16 participants (51.61%) exceeding 70dB (Table 1).
 |
Table 1 Clinical Characteristics |
To explore the molecular mechanism influencing tumor size and auditory dysfunction, patients were categorized into two groups according to specific metrics. To ensure a balanced comparison between these groups, we selected a maximum diameter of 3 cm and a PTA of 70 dB as the threshold values. No statistical differences in sex, age, and affected side were detected among the two compared groups (Table 1).
Confirmation of Iba-1 Expression in Vestibular Schwannomas and Its Association with Tumor Size and Auditory Dysfunction
Based on the immune infiltration analysis, macrophages emerged as the predominant immune cells within the microenvironment of VSs. Consequently, our subsequent molecular investigations concentrated on these cells, utilizing Ionized calcium-binding adapter molecule 1 (Iba-1), a well-established macrophage marker, to examine its association with tumor size and auditory dysfunction. Interestingly, immunohistochemical assessments revealed a marked increase in the percentage of Iba-1 positive area in tumors exceeding 3 cm in diameter compared to those measuring 3 cm or smaller (p = 0.002, Student’s t-test, Figure 7A). Similarly, tumors presenting a PTA threshold above 70 dB exhibited a higher percentage of Iba-1 positivity than those at or below 70 dB (p < 0.001, Student’s t-test, Figure 7A). Correlation analysis further identified a significant positive relationship, demonstrating an increase in the percentage of Iba-1 positive area in parallel with rising PTA threshold (R² = 0.527, P < 0.001, Figure 7B) and tumor diameter (R² = 0.306, P = 0.0012, Figure 7B). The representative Iba-1+ cells were shown in Figure 7C and D displaying typical morphology of activated macrophages with enlarged cell bodies and shorter processes in large VSs and the patients with worse hearing. These outcomes suggested a link between macrophage infiltration and increased tumor size as well as augmented auditory dysfunction in VSs.
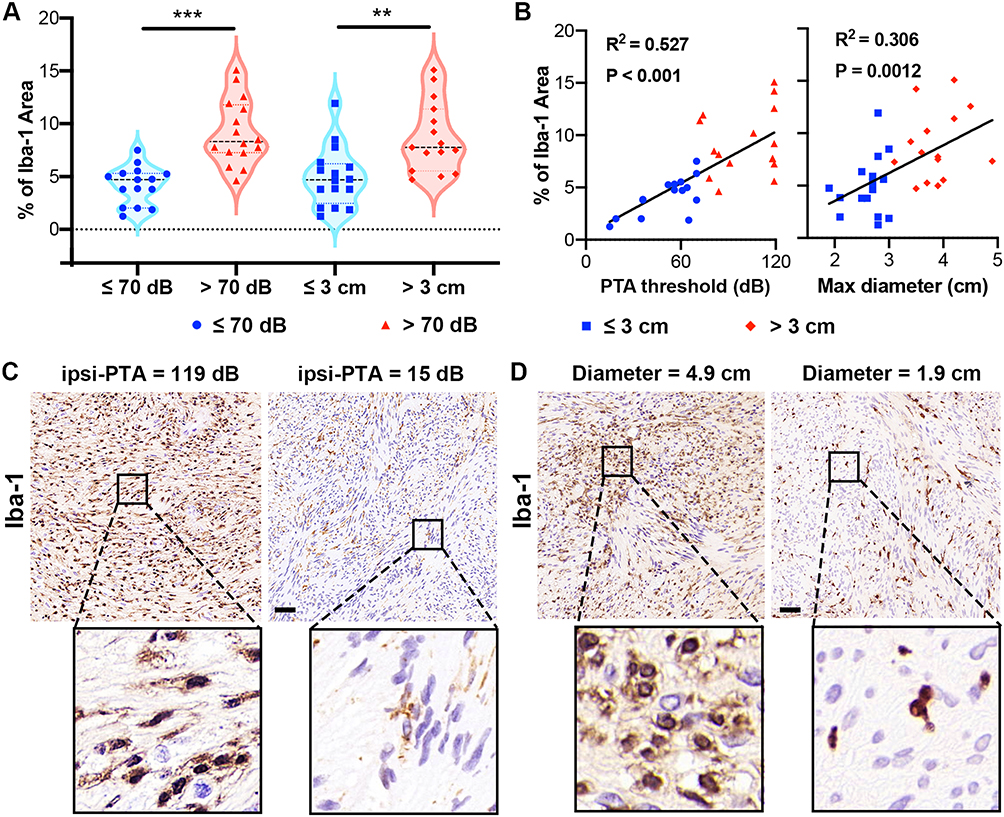 |
Figure 7 Iba-1 expression in vestibular schwannomas (VSs) correlates with tumor size and auditory dysfunction. (A) Immunohistochemical analysis demonstrated a significantly higher percentage of Iba-1+ area in VSs larger than 3 cm, and in tumors with a pure tone audiometry (PTA) threshold above 70 dB. (B) Correlation plots indicated a positive relationship between the percentage of Iba-1+ area and both the PTA threshold and tumor diameter. (C) Representative morphology of Iba-1+ cells in VS patients with different PTA thresholds on the tumor side. (D) Representative morphology of Iba-1+ cells in VS patients with varied tumor sizes. ** p<0.01, *** p<0.001. |
Inflammatory Cytokine Expression in Vestibular Schwannomas and Its Association with Tumor Size and Auditory Dysfunction
The inflammatory microenvironment is increasingly recognized as a contributor to tumor pathogenesis, influencing processes such as tumor growth, immune evasion, angiogenesis, etc.28,29 Inflammatory cytokines play a pivotal role in the tumor inflammatory microenvironment by mediating both pro-inflammatory and anti-inflammatory responses.30 Thus, based on the identified hub genes, we investigated the expression of inflammatory cytokines and their receptors, specifically interleukin-10 (IL-10)/Interleukin-10 Receptor Alpha (IL-10RA) and IL-18, and unveiled their links with the clinical features of VSs. The expression profiles assessed by the percentage of positive area in IHC staining demonstrated a statistically significant elevation of IL-10/IL-10RA in tumors exceeding 3 cm in diameter and those associated with a PTA threshold beyond 70 dB (Figure 8A–D). Correlation coefficients substantiated a positive relationship between IL-10/IL-10RA levels and PTA threshold (IL-10: R² = 0.39, p < 0.001; IL-10RA: R² = 0.259, p = 0.004; Figure 8B and D) as well as maximum tumor diameter (IL-10: R² = 0.589, p < 0.001; IL-10RA: R² = 0.521, p < 0.001; Figure 8B and D). Contrastingly, IL-18 exhibited a significantly increased expression in the patients with PTA exceeding 70 dB (Figure 8E) and a positive association with the PTA threshold (R² = 0.458, p < 0.001, Figure 8F), but not with tumor size (R² = 0.089, p = 0.104, Figure 8F).
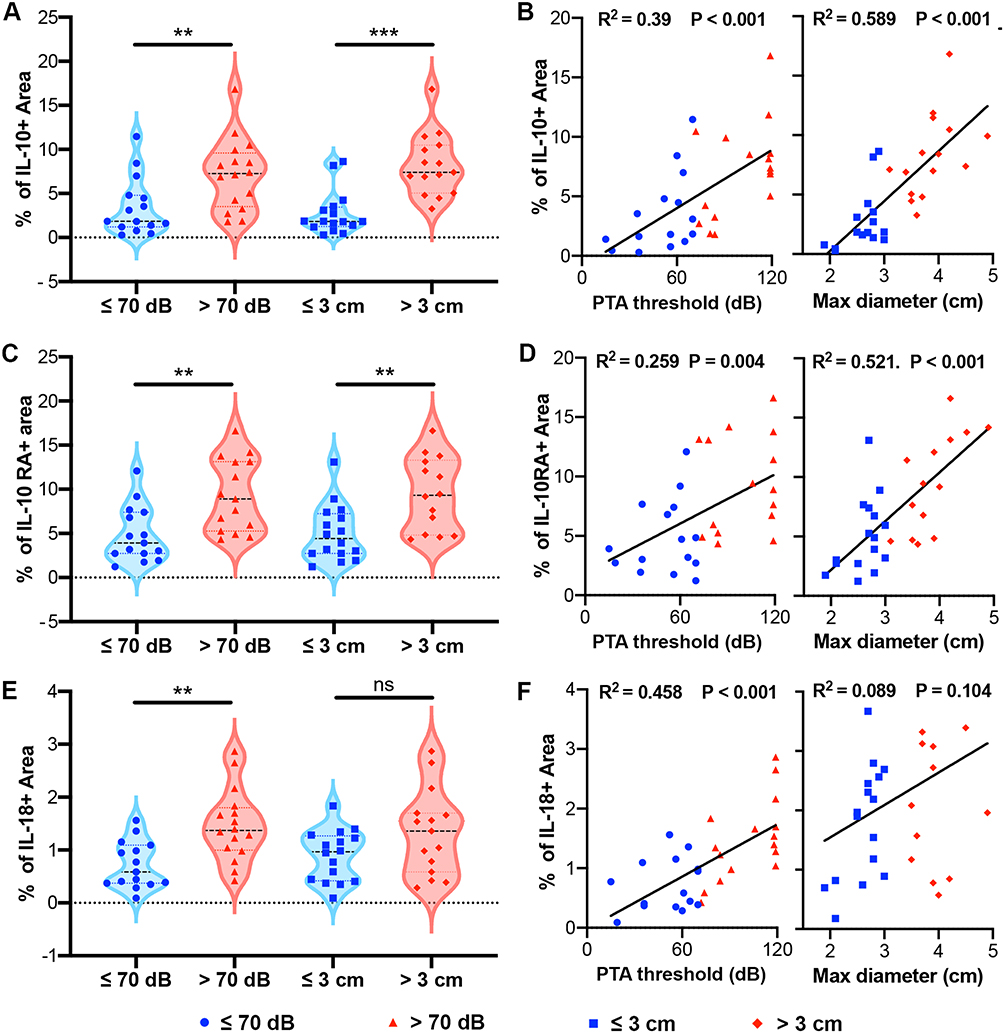 |
Figure 8 Expression of inflammatory cytokines in vestibular schwannomas (VSs) and their correlation with tumor size and auditory dysfunction. (A) Immunohistochemical staining showed elevated levels of IL-10 in VSs larger than 3 cm in diameter or with a pure-tone average (PTA) threshold above 70 dB. (B) Correlation analysis demonstrated a positive relationship between IL-10 levels and both tumor size and PTA threshold on the tumor side. (C) Increased IL-10RA expression was observed in tumors larger than 3 cm in diameter or with a PTA threshold above 70 dB. (D) IL-10RA levels exhibited a positive correlation with both PTA threshold and tumor diameter. (E) IL-18 expression was significantly higher in patients with a PTA exceeding 70 dB but not in larger VSs. (F) A positive association was identified between IL-18 levels and the PTA threshold, with no significant correlation to tumor size. ** p<0.01, *** p<0.001. |
Given the intricacies of real-world data, we further conducted the multiple regression analysis of inflammatory cytokines to distill their interaction effects. This refined model identified that IL-10 (p = 0.003) and IL-10RA (p = 0.020) were statistically significant predictors of tumor size, whereas IL-18 was not (p = 0.169). For the auditory impairment, our findings indicated that IL-18 was positively associated with the PTA threshold on the affected side (p = 0.003). However, IL-10/IL-10RA were not significantly associated with PTA threshold (p = 0.068 and p = 0.98 respectively). Supporting these findings, illustrative immunohistochemistry images of IL-10/IL-10RA and IL-18 in VS patients with different tumor sizes and PTA threshold were showcased in Figure 9A–C. Collectively, these results highlight the differential roles of IL-10/IL-10RA and IL-18 on VS pathogenesis.
 |
Figure 9 Representative immunohistochemistry staining of IL-10RA, IL-10 and IL-18 in vestibular schwannomas (VSs) with varied sizes and PTA thresholds on the tumor side. (A) Representative IL-10RA immunohistochemistry staining in VS patients with different tumor sizes. (B) Representative IL-10 immunohistochemistry staining in VS patients with different tumor sizes. (C) Representative IL-18 immunohistochemistry staining in VS patients with varied PTA thresholds on the tumor side. |
Discussion
Vestibular schwannomas (VSs), as the most common benign tumors in the cerebellopontine angle, exhibit an insidious onset and diverse symptoms.31 When diagnosed, they are often already large and accompanied by severe neurological impairments, especially auditory impairment. Therefore, delving into the mechanisms of tumor growth and neurological function damage is crucial for the precise treatment of VSs.
Recent research offered insights into the tumor microenvironment, particularly inflammation, in modulating tumor dynamics.30 VSs are characterized not only by Schwann cell proliferation but also by a complex tumor microenvironment, where inflammation plays a crucial role in their pathogenesis.7 In an earlier investigation regarding the inflammation in VSs, Labit-Bouvier and colleagues examined immune infiltration in 69 sporadic VS specimens, finding a link between the presence of immune cells, marked by CD45 immunostaining, and symptom duration.32 Recently Gregory et al integrated data from bulk transcriptomic analyses and imaging mass cytometry to explore the gene expression profiles and immune cell infiltration in sporadic and NF2-related schwannomas, and they concluded that there were strong similarities in the inflammatory microenvironment in both types of VSs, with enrichment in immune-related pathways, immune gene expression, macrophages as the most abundant immune population in both types compared to vestibular nerves.33 Mirroring our results, Wu et al employed bioinformatics analysis to identify critical pathways and genes in VSs. In comparison with human Schwann tissues, they identified 20 hub genes including BCL2, AGT, IL6, ITGA2, etc., and the authors emphasized the essential involvement of inflammation in VS pathogenesis.34 Zhang et al reviewed the literature regarding molecular pathways and biomarkers involved in the inflammatory response within VSs and they pointed to proteins regulating merlin conformation changes, inflammatory cytokines, and components of the cerebrospinal fluid (CSF) as being closely related to VS growth.35 However, the bioinformative analysis focused on the inflammation response is still lacking and the key involving inflammation-associated pathways are unknown. Thus, in this study, via analyzing mRNA microarray data from both VSs and control nerve tissues, we identified a significant array of 1117 DEGs in VSs compared to controls. In alignment with previous findings, the enrichment and pathway analysis highlighted the upregulation of the inflammatory response pathways, such as interferon response, allograft rejection, myeloid leukocyte activation, negative regulation of immune system process, immune receptor activity, etc. Subsequently, we focused on investigation into IRG-DEGs, and identified 41 key IRG-DEGs with 11 central hub genes, including IL-6, TLR2, IL-18, CYBB, CXCL10, IL10RA, TLR1, CD69, TLR3, C3AR1, and NLRP3, which formed the backbone of our study’s inquiry into the immune landscape of VSs.
To date, the specific contribution of inflammation and immune infiltration to VS pathogenesis remains unclear. However, tumor-associated macrophages (TAMs) have gained increasing attention for their potential role.9,36 Within the tumor microenvironment, diverse cytokines expression profiles resulted in different functional status of TAMs. At the spectrum’s ends, two primary TAMs categories emerge: the pro-inflammatory M1-type, triggered by interferon-γ and lipopolysaccharide, known for producing IL-1 and IL-6; and the anti-inflammatory M2-type, associated with IL-10, IL-13, etc., promoting tumor growth and angiogenesis.37 In histological assessments, de Vries et al investigated CD68 and CD163 markers in VSs, and they uncovered not just their association with tumor enlargement but also the link between CD163+ presence and higher microvessel density, supporting CD163+ M2 macrophages’ role in promoting angiogenesis and tumor growth.9 More striking evidence was from the study by Lewis et al.38 They combined positron emission tomography (PET) imaging (tracer 11C-(R)-PK11195) with dynamic contrast-enhanced MRI and provided the first in vivo imaging evidence that macrophages, rather than tumor cells themselves, accounted for the majority of proliferating cells in growing VSs.38 In addition, regarding hearing impairment, a recent study provided evidence that there were qualitative differences in CD163+ macrophage morphologies between serviceable and unserviceable hearing VS patients, and higher expression of CD163+ might contribute to poorer hearing outcomes.39 In alignment with the studies above, our immune infiltration analysis delineated a distinct immune landscape in VSs characterized by macrophage activation and M2 polarization. More interestingly, the M2 macrophage polarization was linked to 6 out of 11 identified hub genes. Via performing IHC in 31 VS patients with varied sizes and auditory impairment, we found significantly higher Iba-1+ macrophages existed in the larger tumor and the patients with poor hearing, which reinforced the pivotal role of macrophage activation in VS pathogenesis. Current evidence suggests that the interaction between Schwann cells and macrophages may contribute to this process.40–43 Schwann cells not only facilitate macrophage recruitment and activation but also influence macrophage polarization. Stratton et al discussed that Schwann cells might express several ligands (eg, GDNF), which could interact with receptors expressed by macrophages and thereby regulated their behavior, facilitating their transition to a pro-regenerative state in the nerve injury.40 In RN22 schwannoma cells, researchers found that schwannoma cells produced macrophage chemoattractant protein-1 (MCP-1) and leukemia inhibitory factor (LIF), which attracted macrophages. In addition, the interplay of IL-6, LIF, and MCP-1 formed an autocrine signaling loop that amplified Schwann cell-derived chemotactic signals.41 Macrophages, in turn, play a pivotal role in Schwann cell dedifferentiation and proliferation.42,43 Zhan et al demonstrated that macrophage-derived microvesicles enhanced Schwann cell activity both in vitro and in vivo, which were identified as key mediators in promoting Schwann cell proliferation and migration.42 Moreover, in a model of Cx32-deficient mice, Groh et al identified colony-stimulating factor 1 (CSF-1) as a key regulator, with macrophages acting as essential mediators of Schwann cell dedifferentiation and dysfunction.43
Recent investigations also shed light on the impact of the inflammatory cytokines and growth factors on VS progression.44,45 In 2015, Taurone et al compared the expression levels of pro-inflammatory cytokines and growth factors in VSs against those in normal vestibular nerve tissue. This study found increased expression of pro-inflammatory cytokines (TGF-β1, IL-1β, and IL-6) and elevated levels of vascular endothelial growth factor (VEGF) in larger VS, implying a pro-growth influence through angiogenesis.44 This notion was further supported by observations of increased macrophage colony-stimulating factor (M-CSF) in rapidly enlarging and cystic VSs.45 Moreover, Leisz et al delved into the relationship between macrophage markers and tumor volume, and their analysis exhibited CD68, CD163, and granulocyte macrophage colony-stimulating factor (GM-CSF) increased significantly in the larger VSs, which suggested macrophage infiltration itself might contribute to tumor growth.46
The literature on the IL-10/IL-10RA pathway, known for its anti-inflammatory actions in M2 macrophages, remains sparse in the context of VSs. Previous research on tumor growth and IL-10/IL-10RA indicated that it had a dual role in tumor progression. IL-10/IL-10RA could either promote tumor growth by enhancing immune suppression or inhibit tumor expansion by activating anti-tumor immune responses.47–49 For example, in diffuse large B-cell lymphoma, IL-10 was reported to promote tumor growth through the STAT3 pathway and reduce the activity of intratumoral effector T cells.47 In lung cancer, Sharma et al demonstrated that IL-10 fostered tumor growth by inhibiting the function of antigen-presenting cells and T cells. On the other hand, in a model suppressing IL-10, there was a significant increase in tumor growth and immunosuppressive cells, indicating that IL-10 might limit tumor expansion by modulating the immune environment.48 In recurrent and malignant schwannomas, there were significantly higher levels of IL-10 in comparison with benign and primary tumors.50 Our findings identified IL-10RA, a cell surface receptor subunit for the IL10, as a hub IRG-DEG in VSs and, through molecular analysis, established its positive association with tumor size alongside Iba-1 and IL-10, underlining the IL-10/IL-10RA signaling pathway’s role in VS development.
Historically, VS-associated auditory impairment was primarily attributed to the physical compression exerted by tumor growth. However, new evidence suggested that pro-inflammatory cytokines were key contributors to hearing impairment.10,51,52 In an ex vivo experiment, Dilwali et al utilized murine cochlear explant cultures treated with VS secretions to establish the first model to study the role of VS-secreted factors in causing auditory impairment. They identified TNFα as an ototoxic molecule and fibroblast growth factor 2 as an otoprotective molecule.52 Through comprehensive pathway analysis utilizing gene expression data from 80 VSs and 16 control nerves, Sagers et al highlighted the role of the NLRP3 inflammasome in VS-induced hearing loss and they observed NLRP3 inflammasome and IL-1β activation in the patients with poor hearing.51 More interesting, via a comparative transcriptomic analysis of VS tissues from patients with and without tinnitus, researchers demonstrated an increased expression of NLRP3 inflammasome and CD68+ macrophages in the patients with tinnitus, suggesting the activation of NLRP3 inflammasome might contribute to early hearing symptoms in VSs.10 In our study, bioinformatics analysis identified that two out of eleven hub genes in VSs were associated with the activation of the NLRP3 inflammasome, namely IL-18 and NLRP3. In the previous research, significant upregulation of IL-18 was observed in the cochleae of mice exposed to broadband noise.53 Similarly, Sai et al indicated that NLRP3, IL-1β, IL-18, and cleaved-caspase-1 were highly expressed in the miniature pigs’ cochlea injured by noise, which suggested IL-18 with NLRP3-inflammasomes might be activated after acoustic trauma and served as an important mechanism of noise-induced auditory impairment.54 In VSs, for the first time, the immunohistochemistry analysis in our study unveiled differential IL-18 expression levels within VSs, which was positively correlated with auditory impairment. That is, patients with more severe hearing loss exhibited elevated levels of IL-18 expression.
In this study, we investigated the intricate relationship between inflammatory responses and VS pathogenesis. Our findings underscored the profound impact of the inflammatory microenvironment on VS behavior and offered avenues for targeted therapies toward tumor control and hearing protection. While bridging valuable insights from bioinformatics and clinical sample analysis, this study was also subject to several limitations that warrant consideration. One limitation of our study is the reliance on IHC for evaluating macrophage infiltration and cytokines expression in VSs. Comprehensive techniques such as immunofluorescence, flow cytometry, etc., should be incorporated in the future study to confirm and better characterize different macrophage subtypes and functional status for a more in-depth understanding of macrophage behavior in the tumor microenvironment. For the identified genes and pathways, in vitro studies using cell lines or primary cells were lacking to uncover the step-by-step processes by which certain inflammatory genes or pathways contributed to certain behaviors of VSs. Future studies are needed to validate the exact role of IL-10/IL-10RA, IL-18, and other hub genes in VS pathogenesis. Additionally, for the clinical data, the sample size and retrospective design limit the generalizability of our findings to a wider population. Further research with prospective study design is needed to reduce the potential bias.
Conclusion
Our study underscored the inflammatory landscape in the VSs and demonstrated that macrophage activation with M2 polarization and the expression of inflammatory cytokines were linked to tumor size and auditory function. In particular, IL-10 and IL-10RA were statistically significant predictors of tumor size, while IL-18 was associated with hearing loss. The pilot results underscore the significance of a distinct immune landscape within VSs, pointing to the inflammatory microenvironment as a key factor in modulating tumor dynamics and providing a basis for targeted therapeutic strategies. Continued research should further validate the exact role of IL-10/IL-10RA, IL-18, and other hub genes in VS pathogenesis and dive into the underlying molecular mechanism.
Ethics Approval
The study was conducted according to the guidelines of the Declaration of Helsinki and approved by the ethics committee of the Union Hospital, Tongji Medical College, Huazhong University of Science and Technology (No. 2024-LS-303).
Acknowledgments
We would like to thank all the patients enrolled in this study.
Author Contributions
Jinlu Gan and Yanling Zhang contributed equally to this work and share the first authorship. Hongyang Zhao and Lei Wang have contributed equally to this work and are co-correspondent authors. All authors made a significant contribution to the work reported, whether that is in the conception, study design, execution, acquisition of data, analysis and interpretation, or in all these areas; took part in drafting, revising or critically reviewing the article; gave final approval of the version to be published; have agreed on the journal to which the article has been submitted; and agree to be accountable for all aspects of the work.
Funding
This project was supported by the National Natural Science Foundation of China (grant 82301573 to L Wang) and the Free Innovation Fund of Wuhan Union Hospital (grant 2021xhyn105 to L Wang).
Disclosure
The authors declare that the research was conducted in the absence of any commercial or financial relationships that could be construed as a potential conflict of interest.
References
1. Marinelli JP, Beeler CJ, Carlson ML, Caye-Thomasen P, Spear SA, Erbele ID. Global Incidence of Sporadic Vestibular Schwannoma: a Systematic Review. Otolaryngol Head Neck Surg. 2022;167(2):209–214. doi:10.1177/01945998211042006
2. Gan J, Zhang Y, Wu J, et al. Current Understanding of Hearing Loss in Sporadic Vestibular Schwannomas: a Systematic Review. Front Oncol. 2021;11:687201. doi:10.3389/fonc.2021.687201
3. Eldridge R, Parry D. Vestibular schwannoma (acoustic neuroma). Consensus development conference. Neurosurgery. 1992;30(6):962–964.
4. Goldbrunner R, Weller M, Regis J, et al. EANO guideline on the diagnosis and treatment of vestibular schwannoma. Neuro Oncol. 2020;22(1):31–45. doi:10.1093/neuonc/noz153
5. Lyu F, Gan J, Wang H, Zhao H, Wang L, Zhang F. Case Report: extensive Temporal Bone Invasion in a Giant Vestibular Schwannoma. Front Surg. 2022;9:759163. doi:10.3389/fsurg.2022.759163
6. Stangerup SE, Caye-Thomasen P. Epidemiology and natural history of vestibular schwannomas. Otolaryngol Clin North Am. 2012;45(2):257–268. doi:10.1016/j.otc.2011.12.008
7. Hannan CJ, Lewis D, O’Leary C, et al. The inflammatory microenvironment in vestibular schwannoma. Neurooncol Adv. 2020;2(1):vdaa023. doi:10.1093/noajnl/vdaa023
8. Rossi ML, Jones NR, Esiri MM, Havas L, Nakamura N, Coakham HB. Mononuclear cell infiltrate, HLA-Dr expression and proliferation in 37 acoustic schwannomas. Histol Histopathol. 1990;5(4):427–432.
9. de Vries M, Briaire-de Bruijn I, Malessy MJ, de Bruïne SF, van der Mey AG, Hogendoorn PC. Tumor-associated macrophages are related to volumetric growth of vestibular schwannomas. Otol Neurotol. 2013;34(2):347–352. doi:10.1097/MAO.0b013e31827c9fbf
10. Bommakanti K, Seist R, Kukutla P, et al. Comparative Transcriptomic Analysis of Archival Human Vestibular Schwannoma Tissue from Patients with and without Tinnitus. J Clin Med. 2023;12(7):2642. doi:10.3390/jcm12072642
11. Barrett T, Wilhite SE, Ledoux P, et al. NCBI GEO: archive for functional genomics data sets--update. Nucleic Acids Res. 2013;41(D1):D991–995. doi:10.1093/nar/gks1193
12. Zhang Y, Parmigiani G, Johnson WE. ComBat-seq: batch effect adjustment for RNA-seq count data. NAR Genom Bioinform. 2020;2(3):lqaa078. doi:10.1093/nargab/lqaa078
13. Yu G, Wang LG, Han Y, He QY. Cluster profiler: an R package for comparing biological themes among gene clusters. Omics. 2012;16(5):284–287. doi:10.1089/omi.2011.0118
14. Subramanian A, Tamayo P, Mootha VK, et al. Gene set enrichment analysis: a knowledge-based approach for interpreting genome-wide expression profiles. Proc Natl Acad Sci U S A. 2005;102(43):15545–15550. doi:10.1073/pnas.0506580102
15. Warde-Farley D, Donaldson SL, Comes O, et al. The GeneMANIA prediction server: biological network integration for gene prioritization and predicting gene function. Nucleic Acids Res. 2010;38:W214–220. doi:10.1093/nar/gkq537
16. Colleselli K, Stierschneider A, Wiesner C. An Update on Toll-like Receptor 2, Its Function and Dimerization in Pro- and Anti-Inflammatory Processes. Int J Mol Sci. 2023;24(15):12464. doi:10.3390/ijms241512464
17. Vijay K. Toll-like receptors in immunity and inflammatory diseases: past, present, and future. Int Immunopharmacol. 2018;59:391–412. doi:10.1016/j.intimp.2018.03.002
18. Matsumoto M, Funami K, Oshiumi H, Seya T. Toll-like receptor 3: a link between toll-like receptor, interferon and viruses. Microbiol Immunol. 2004;48(3):147–154. doi:10.1111/j.1348-0421.2004.tb03500.x
19. Gorabi AM, Hajighasemi S, Kiaie N, et al. The pivotal role of CD69 in autoimmunity. J Autoimmun. 2020;111:102453. doi:10.1016/j.jaut.2020.102453
20. Thomas DC. The phagocyte respiratory burst: historical perspectives and recent advances. Immunol Lett. 2017;192:88–96. doi:10.1016/j.imlet.2017.08.016
21. He Y, Hara H, Núñez G. Mechanism and Regulation of NLRP3 Inflammasome Activation. Trends Biochem Sci. 2016;41(12):1012–1021. doi:10.1016/j.tibs.2016.09.002
22. Kaplanski G. Interleukin-18: biological properties and role in disease pathogenesis. Immunol Rev. 2018;281(1):138–153. doi:10.1111/imr.12616
23. Moore KW, de Waal Malefyt R, Coffman RL, O’Garra A. Interleukin-10 and the interleukin-10 receptor. Annu Rev Immunol. 2001;19(1):683–765. doi:10.1146/annurev.immunol.19.1.683
24. Mihara M, Hashizume M, Yoshida H, Suzuki M, Shiina M. IL-6/IL-6 receptor system and its role in physiological and pathological conditions. Clin Sci (Lond). 2012;122(4):143–159. doi:10.1042/CS20110340
25. Rodriguez P, Laskowski LJ, Pallais JP, et al. Functional profiling of the G protein-coupled receptor C3aR1 reveals ligand-mediated biased agonism. J Biol Chem. 2024;300(1):105549. doi:10.1016/j.jbc.2023.105549
26. Sabat R, Grütz G, Warszawska K, et al. Biology of interleukin-10. Cytokine Growth Factor Rev. 2010;21(5):331–344. doi:10.1016/j.cytogfr.2010.09.002
27. Vazirinejad R, Ahmadi Z, Kazemi Arababadi M, Hassanshahi G, Kennedy D. The biological functions, structure and sources of CXCL10 and its outstanding part in the pathophysiology of multiple sclerosis. Neuroimmunomodulation. 2014;21(6):322–330. doi:10.1159/000357780
28. Schmitt M, Greten FR. The inflammatory pathogenesis of colorectal cancer. Nat Rev Immunol. 2021;21(10):653–667. doi:10.1038/s41577-021-00534-x
29. Kadhim H, Tabarki B, Verellen G, De Prez C, Rona AM, Sébire G. Inflammatory cytokines in the pathogenesis of periventricular leukomalacia. Neurology. 2001;56(10):1278–1284. doi:10.1212/WNL.56.10.1278
30. Zhao H, Wu L, Yan G, et al. Inflammation and tumor progression: signaling pathways and targeted intervention. Signal Transduct Target Ther. 2021;6(1):263. doi:10.1038/s41392-021-00658-5
31. Brooks KA, Vivas EX. Natural History of Hearing Loss in Sporadic Vestibular Schwannoma. Otolaryngol Clin North Am. 2023;56(3):435–444. doi:10.1016/j.otc.2023.02.005
32. Labit-Bouvier C, Crebassa B, Bouvier C, Andrac-Meyer L, Magnan J, Charpin C. Clinicopathologic growth factors in vestibular schwannomas: a morphological and immunohistochemical study of 69 tumours. Acta Otolaryngol. 2000;120(8):950–954. doi:10.1080/00016480050218681
33. Gregory GE, Jones AP, Haley MJ, et al. The comparable tumour microenvironment in sporadic and NF2-related schwannomatosis vestibular schwannoma. Brain Commun. 2023;5(4):fcad197. doi:10.1093/braincomms/fcad197
34. Wu B, Dou G, Zhang Y, et al. Identification of key pathways and genes in vestibular schwannoma using bioinformatics analysis. Exp Ther Med. 2022;23(3):217. doi:10.3892/etm.2022.11141
35. Zhang Y, Long J, Ren J, Huang X, Zhong P, Wang B. Potential Molecular Biomarkers of Vestibular Schwannoma Growth: progress and Prospects. Front Oncol. 2021;11:731441. doi:10.3389/fonc.2021.731441
36. Noy R, Pollard JW. Tumor-associated macrophages: from mechanisms to therapy. Immunity. 2014;41(1):49–61. doi:10.1016/j.immuni.2014.06.010
37. Liu J, Geng X, Hou J, Wu G. New insights into M1/M2 macrophages: key modulators in cancer progression. Cancer Cell Int. 2021;21(1):389. doi:10.1186/s12935-021-02089-2
38. Lewis D, Roncaroli F, Agushi E, et al. Inflammation and vascular permeability correlate with growth in sporadic vestibular schwannoma. Neuro Oncol. 2019;21(3):314–325. doi:10.1093/neuonc/noy177
39. Nisenbaum E, Misztal C, Szczupak M, et al. Tumor-Associated Macrophages in Vestibular Schwannoma and Relationship to Hearing. OTO Open. 2021;5(4):2473974. doi:10.1177/2473974X211059111
40. Stratton JA, Shah PT. Macrophage polarization in nerve injury: do Schwann cells play a role? Neural Regen Res. 2016;11(1):53–57. doi:10.4103/1673-5374.175042
41. Tofaris GK, Patterson PH, Jessen KR, Mirsky R. Denervated Schwann cells attract macrophages by secretion of leukemia inhibitory factor (LIF) and monocyte chemoattractant protein-1 in a process regulated by interleukin-6 and LIF. J Neurosci. 2002;22(15):6696–6703. doi:10.1523/JNEUROSCI.22-15-06696.2002
42. Zhan C, Ma CB, Yuan HM, Cao BY, Zhu JJ. Macrophage-derived microvesicles promote proliferation and migration of Schwann cell on peripheral nerve repair. Biochem Biophys Res Commun. 2015;468(1–2):343–348. doi:10.1016/j.bbrc.2015.10.097
43. Groh J, Klein I, Hollmann C, Wettmarshausen J, Klein D, Martini R. CSF-1-activated macrophages are target-directed and essential mediators of Schwann cell dedifferentiation and dysfunction in Cx32-deficient mice. Glia. 2015;63(6):977–986. doi:10.1002/glia.22796
44. Taurone S, Bianchi E, Attanasio G, et al. Immunohistochemical profile of cytokines and growth factors expressed in vestibular schwannoma and in normal vestibular nerve tissue. Mol Med Rep. 2015;12(1):737–745. doi:10.3892/mmr.2015.3415
45. de Vries WM, Briaire-de Bruijn IH, van Benthem PPG, van der Mey AGL, Hogendoorn PCW. M-CSF and IL-34 expression as indicators for growth in sporadic vestibular schwannoma. Virchows Arch. 2019;474(3):375–381. doi:10.1007/s00428-018-2503-1
46. Leisz S, Klause CH, Vital Dos Santos T, et al. Vestibular Schwannoma Volume and Tumor Growth Correlates with Macrophage Marker Expression. Cancers. 2022;14(18):4429. doi:10.3390/cancers14184429
47. Stirm K, Leary P, Bertram K, et al. Tumor cell-derived IL-10 promotes cell-autonomous growth and immune escape in diffuse large B-cell lymphoma. Oncoimmunology. 2021;10(1):2003533. doi:10.1080/2162402X.2021.2003533
48. Lee BR, Kwon BE, Hong EH, et al. Interleukin-10 attenuates tumour growth by inhibiting interleukin-6/signal transducer and activator of transcription 3 signalling in myeloid-derived suppressor cells. Cancer Lett. 2016;381(1):156–164. doi:10.1016/j.canlet.2016.07.012
49. Sharma S, Stolina M, Lin Y, et al. T cell-derived IL-10 promotes lung cancer growth by suppressing both T cell and APC function. J Immunol. 1999;163(9):5020–5028. doi:10.4049/jimmunol.163.9.5020
50. Li Z, Xu J, Liu X, Guo R, Wang P. Dysregulation of IL-10 by macrophages and T cells in recurrent and malignant schwannomas. Int J Clin Exp Pathol. 2016;9(7):7302–7309.
51. Sagers JE, Sahin MI, Moon I, et al. NLRP3 inflammasome activation in human vestibular schwannoma: implications for tumor-induced hearing loss. Hear Res. 2019;381:107770. doi:10.1016/j.heares.2019.07.007
52. Dilwali S, Landegger LD, Soares VY, Deschler DG, Stankovic KM. Secreted Factors from Human Vestibular Schwannomas Can Cause Cochlear Damage. Sci Rep. 2015;5(1):18599. doi:10.1038/srep18599
53. Li M, Zhang Y, Qiu S, et al. Oridonin ameliorates noise-induced hearing loss by blocking NLRP3 - NEK7 mediated inflammasome activation. Int Immunopharmacol. 2021;95:107576. doi:10.1016/j.intimp.2021.107576
54. Sai N, Yang YY, Ma L, et al. Involvement of NLRP3-inflammasome pathway in noise-induced hearing loss. Neural Regen Res. 2022;17(12):2750–2754. doi:10.4103/1673-5374.339499
 © 2024 The Author(s). This work is published and licensed by Dove Medical Press Limited. The
full terms of this license are available at https://www.dovepress.com/terms.php
and incorporate the Creative Commons Attribution
- Non Commercial (unported, 3.0) License.
By accessing the work you hereby accept the Terms. Non-commercial uses of the work are permitted
without any further permission from Dove Medical Press Limited, provided the work is properly
attributed. For permission for commercial use of this work, please see paragraphs 4.2 and 5 of our Terms.
© 2024 The Author(s). This work is published and licensed by Dove Medical Press Limited. The
full terms of this license are available at https://www.dovepress.com/terms.php
and incorporate the Creative Commons Attribution
- Non Commercial (unported, 3.0) License.
By accessing the work you hereby accept the Terms. Non-commercial uses of the work are permitted
without any further permission from Dove Medical Press Limited, provided the work is properly
attributed. For permission for commercial use of this work, please see paragraphs 4.2 and 5 of our Terms.