")
Back to Journals » Journal of Inflammation Research » Volume 17
Exploring the Role of SMPD3 in the lncRNA-miRNA-mRNA Regulatory Network in TBI Progression by Influencing Energy Metabolism
Authors Cui C, Xu B, Liu H, Wang C, Zhang T, Jiang P, Feng L
Received 7 October 2024
Accepted for publication 5 December 2024
Published 11 December 2024 Volume 2024:17 Pages 10835—10848
DOI https://doi.org/10.2147/JIR.S491290
Checked for plagiarism Yes
Review by Single anonymous peer review
Peer reviewer comments 2
Editor who approved publication: Professor Ning Quan
Changmeng Cui,1 Biao Xu,1 Hui Liu,2 Changshui Wang,1 Tao Zhang,2 Pei Jiang,2 Lei Feng3
1Department of Neurosurgery, Affiliated Hospital of Jining Medical University, Jining, Shandong, 272000, People’s Republic of China; 2Translational Pharmaceutical Laboratory, Jining First People’s Hospital, Shandong First Medical University, Jining, Shandong, 272000, People’s Republic of China; 3Department of Neurosurgery, Jining First People’s Hospital, Shandong First Medical University, Jining, Shandong, 272000, People’s Republic of China
Correspondence: Lei Feng, Department of Neurosurgery, Jining First People’s Hospital, Shandong First Medical University, No. 6 Jiankang Road, Jining City, Shandong Province, 272000, People’s Republic of China, Tel +86-0537-2337201, Email [email protected] Pei Jiang, Translational Pharmaceutical Laboratory, Jining First People’s Hospital, Shandong First Medical University, No. 6 Jiankang Road, Jining City, Shandong Province, 272000, People’s Republic of China, Tel +86-0537-2337200, Email [email protected]
Background: Traumatic brain injury (TBI) is associated with disturbances in energy metabolism. This study aimed to construct a lncRNA-miRNA-mRNA network through bioinformatics methods to explore energy metabolism-related genes in the pathogenesis of TBI.
Methods: Data from datasets GSE171718, GSE131695, and GSE223245 obtained from the Gene Expression Omnibus, were analyzed to identify differentially expressed (DE) genes. Regulatory relationships were investigated through miRDB, miRTarBase, and TargetScan, thereby forming a lncRNA-miRNA-mRNA network. The Molecular Signatures Database (MSigDB) was utilized to identify energy metabolism-related genes, and a protein-protein interaction (PPI) network was established through the STRING database. Functional annotation and enrichment analysis were conducted using GO and KEGG. The TBI mouse model was established to detect the expression levels of GOLGA8B, ZNF367, and SMPD3 in brain tissues.
Results: SMPD3 emerged as the key DE gene linked to energy metabolism in TBI, demonstrating a negative correlation with miR-218-5p and being associated with moderate unconsciousness and female patients. The PPI network revealed SMPD3 interactions with proteins associated with cell death, sphingolipid metabolism, and neurodegenerative diseases such as Alzheimer’s disease. In vivo, GOLGA8B, ZNF367, and SMPD3 mRNA levels were significantly lower in TBI mice.
Conclusion: In summary, SMPD3 represents a crucial metabolic gene in the progression of TBI. It potentially provides a new therapeutic target for metabolic disorders caused by traumatic brain injury (TBI) and holds significant theoretical value for further research.
Keywords: traumatic brain injury, bioinformatics analysis, lncRNA-miRNA-mRNA network, energy metabolism, SMPD3
Introduction
Traumatic brain injury (TBI), generally resulting from blunt and penetrating mechanisms, stands as one of the leading causes of disability and death in both developing and developed countries, representing a significant global public health challenge.1 According to the TBI Model System National Database Statistics from 2017, gender differences exist in the epidemiology of TBI, with male cases accounting for more than 73% of all TBIs reported.2 Each year, the incidence of TBI is estimated at 50 million cases worldwide, a figure that continues to grow rapidly.3 The global economy burden of TBI is approximately 400 billion dollars, accounting for 0.5% of the gross world product.4 Clinically, the severity of TBI can be stratified into mild (14–15), moderate (9–13) and severe (3–8) based on the Glasgow Coma Scale (GCS) score, and the corresponding disability rates are 10%, 60%, and 100%, respectively.5,6 For moderate to severe TBI, the pathological features vary during different stages of TBI progression, such as a series of metabolic changes take place, such as those in glucose, lipid, and acid-base balance.7 In addition, after TBI, especially after moderate to severe TBI, the function of the blood-brain barrier is disrupted and inflammation infiltrates, which leads to neuronal damage in the hypothalamus region and subsequently results in a series of neurometabolic dysfunctions.8 These indications help to better distinguish the types of TBI patients and adopt more targeted treatment methods. In addition, global trends also indicate that there are gender differences in the incidence of traumatic brain injury, with males being more likely to experience it than females, but females have significant differences in the severity of initial injury and mortality rate.9 This gender-based difference might be attributed to the fact that women present more favorable brain physiological states subsequent to TBI, particularly better mitochondrial function and decreased excitotoxicity.10 Therefore, it is of great significance to conduct research using clinical samples from different genders and various TBI stages, with the aim of identifying specific targeted marker genes for the purpose of precise clinical diagnosis and treatment.
There are intricate mechanisms in TBI-induced brain energy metabolism disorders involving multiple factors and links. The uptake and utilization of glucose in the brains of patients are inhibited to varying degrees after TBI. GLENN et al conducted a study on 49 TBI patients and 31 normal volunteers. This research found that, compared with the normal volunteers, the CMRglc in TBI patients decreased and the oxygen to glucose ratio (OGR) also dropped.11 Similarly, lactate and pyruvate are intermediate products of glucose metabolism. Clinically, LPR (lactate/pyruvate ratio) reflects anaerobic glucose metabolism. Its increase can be caused by cerebral ischemia-hypoxia or non-ischemic factors. LPR>25 indicates cerebral energy metabolism disorder, and LPR>40 indicates cerebral metabolic crisis.12 Although metabolites contribute to clinical diagnosis, the specific regulatory mechanisms and key regulatory networks are still unclear. It’s significant to explore the regulatory mechanisms related to energy metabolism and the connections between key genes, it’s crucial for elucidating the progression mechanism of TBI disease and providing targets for clinical treatment and diagnosis.
Recent advancements in bioinformatics and high-throughput technologies have created unprecedented opportunities to delve into the molecular landscape of TBI.4,13 By integrating diverse omics data, ranging from transcriptomics to small non-coding RNA analyses, researchers have sought to decipher the intricate regulatory networks that govern the pathogenesis of TBI.14–16 Among these, the competing endogenous RNA (ceRNA) hypothesis has emerged as a prominent paradigm that postulated the crosstalk among long non-coding RNAs (lncRNAs), microRNAs (miRNAs), and messenger RNAs (mRNAs) as key players in gene expression regulation.17,18 LncRNAs function as competing endogenous RNAs (ceRNAs) which compete with miRNAs in a sponge-like manner. This reduces the activity of miRNAs and eventually undermines the interaction between miRNAs and their target genes.19,20 Especially, some people believe that lncRNAs can affect neurological function and the progression of neurological related diseases and TBI through the ceRNA mechanism. For example, He et al discovered that Astrocyte derived lncRNA 4933431K23Rik exosome modules exhibit microglial phenotype and improve post-traumatic recovery via SMAD7 regulation.21 Astrocyte-derived extracellular vesicles carrying lncRNA NKILA can relieve neuronal injury in TBI. This is achieved by up-regulating nucleotide-binding oligomerization domain-like receptor family pyrin domain-containing 3 (NLRX1) and competitively binding to miR-195.22 Therefore, ceRNA is regarded as being closely associated with the progression of TBI, and has great research value.
Energy metabolism is a fundamental process in cellular homeostasis, which plays a critical role in various neurological disorders, including TBI.23–25 It is well-known that glutamatergic neurotransmission and ion homeostasis are disturbed following TBI, resulting in an increased energy demand.26,27 According to reports, the brain immediately enters a high metabolic state after TBI, during which glucose utilization increases for up to 30 minutes.28 After this brief high metabolic state, the brain undergoes a prolonged period of low metabolism, lasting from several days to several weeks.29,30 Therefore, improving brain energy metabolism after TBI is a promising therapeutic area. Studies have shown that during TBI, the levels of interstitial hypoxanthine, inosine, adenosine and lactate are increased, while glucose content decreases.31–33 These alterations suggest that energy metabolism is disturbed following TBI, leading to neuronal cell loss and the increased ATP consumption.34,35 Dysregulation of energy metabolism genes may impact cellular responses to TBI-induced stress and plays a pivotal role in the pathogenesis of TBI.36,37 Given the important role of energy metabolism in the progression of TBI, it is of great significance to search for key energy metabolism genes related to TBI, explore the molecules involved in different stages of TBI disease progression and their dynamic changes at each stage, both for basic research and clinical treatment diagnosis.
In this study, we conducted a comprehensive bioinformatics analysis. First, by analyzing differentially expressed lncRNAs (DElncRNAs), DEmiRNAs, and DEmRNAs and utilizing the publicly available transcriptome and expression profile data in the Gene Expression Omnibus (GEO), this research revealed the functional role of energy metabolism genes in the progression of moderate to severe TBI through the lncRNA-miRNA-mRNA regulatory network. We investigated the relationship between energy-related miRNAs and clinical symptoms in TBI samples in order to reveal potential links between molecular subtypes and disease phenotypes. Additionally, functional enrichment analyses of core marker mRNAs within the regulatory network illuminated the biological processes and pathways involved in TBI, particularly highlighting energy metabolism-related pathways that could be crucial in TBI pathophysiology. The insights garnered from this research may significantly advance our understanding of TBI pathogenesis and provide a solid foundation for future experimental investigations.
Methods
Data Retrieval of TBI-Related Transcriptome, Expression Profiling and Energy Metabolism Genes
Data sets containing transcriptome and expression profiling data related to “traumatic brain injury” or “TBI” were acquired from the GEO database. According to Article 32 in Chapter 3 of the “Ethical Review Measures for Life Science and Medical Research Involving Human Subjects” (Reference: https://www.gov.cn/zhengce/zhengceku/2023-02/28/content_5743658.htm) issued by the National Science and Technology Ethics Committee of China, the use of legally obtained publicly available personal information data or biological samples for life science and medical research can be exempted from ethical review.
Clinical sample information of GSE171718, GSE131695, and GSE223245 is displayed in Supplementary Table 1A-C respectively. The lncRNA/mRNA expression profile dataset in serum samples is GSE171718, and the TBI patients have a GCS score ranging from 9–12, the samples collected from Affiliated Hospital of Zunyi Medical University from January 2019 to March 2019.38 The miRNA expression profile dataset in blood samples is GSE131695, and the GCS score of 5.6–7.38 for TBI patients.39 The miRNA expression profile dataset in blood samples is GSE223245, and the GCS score of 3–12 for TBI patients.40
To identify energy metabolism-related genes, we searched the MSigDB (v7.4; http://software.broadinstitute.org/gsea/msigdb) with the keyword “energy” and selected gene sets annotated as “all collection”, then integrated them in Supplementary Table 2. The bioinformatics analysis workflow is shown in Figure 1.
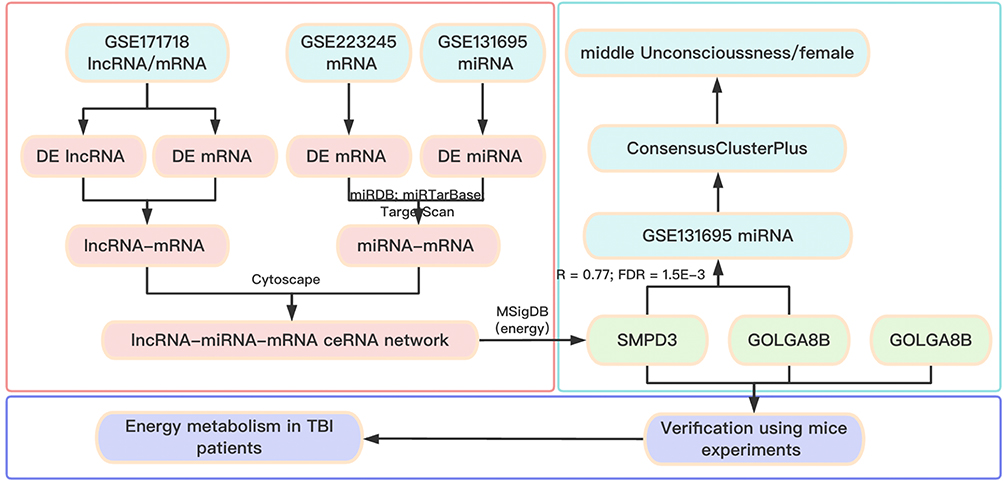 |
Figure 1 Flow chart of the overall analysis. |
Screening of DElncRNAs, DEmiRNAs and DEmRNAs in TBI Samples
The factoextra package in R (https://github.com/kassambara/factoextra) was utilized for the principal components analysis (PCA) of gene expression and manifested as fviz_pca_ind function. Thereafter, differential expression analysis was conducted using the R package “limma” to screen the DElncRNAs, DEmiRNAs and DEmRNAs and construct the competing endogenous RNA (ceRNA) network. For the selection of DElncRNAs, DEmiRNAs and DEmRNAs, respectively, the following cutoff points were used: lncRNA (P value < 0.05, |log2(Foldchange)| > 0.58), miRNA (P value < 0.05, |log2(Foldchange)| > 0.58) and mRNA (P value < 0.05, |log2(Foldchange)| > 0.58).
Construction of the lncRNA-miRNA-mRNA ceRNA Network
The construction process of the lncRNA-mRNA-miRNA ceRNA regulatory network in TBI as follow: First, Spearman correlation analysis of DElncRNAs and DEmRNAs in serum samples was performed with the “cor.test” function in R, and the Benjamin & Hochberg method was used to calculate the FDR. FDR < 0.05 and |R| > 0.2 was used to determine significant lncRNA-mRNA association pairs. Then, we matched highly-expressed DEmiRNAs with lowly-expressed DEmRNAs in TBI samples, and vice versa. Subsequently, based on the miRDB (http://mirdb.org/index.html), miRTarBase (https://mirtarbase.cuhk.edu.cn) and TargetScan (https://www.targetscan.org/vert_80/) databases, we selected mRNA - miRNA pairs confirmed by at least two databases for further analysis. Finally, shared mRNAs between DElncRNA-DEmRNA pairs and DEmiRNA-DEmRNA pairs were used to construct the lncRNA-mRNA-miRNA ceRNA regulatory network, visualized with Cytoscape 3.8.1. (https://cytoscape.org/).
Identification of Marker mRNAs in the lncRNA-miRNA-mRNA ceRNA Network
Random Forest classifiers were constructed based on the expression levels of core marker mRNAs in the lncRNA-mRNA-miRNA ceRNA network of GSE171718 and GSE223245 datasets. The training set was selected at 80%, and 1000 validation cycles were done to determine the credibility of the AUC evaluation of core marker mRNA in the ceRNA network. Subsequently, intersections of core marker mRNAs and energy - metabolism-related genes were identified. Then, energy metabolism-related miRNAs interacting with these core marker mRNAs in the ceRNA network were extracted.
Identification of Relationships Between Energy Metabolism-Related miRNAs and Clinical Symptoms in TBI Patients
Using the expression data of energy metabolism-related miRNAs in the GSE131695 database, consistency clustering analysis was done for TBI samples using the R package Consensus Cluster Plus with parameters max K=10 (maximum cluster number to evaluate) and reps=100 (number of subsamples). The optimal number of clusters was determined and the samples were classified into subtypes. Then, PCA was used to verify classification reliability. Subsequently, TBI subtypes and clinical symptoms like coma degree and gender were analyzed for enrichment using the fisher test. To identify representative genes for subtypes with significantly enriched clinical indicators, differential analysis was done between subtype and non-subtype samples using the limma package of R. Only highly expressed genes (P value < 0.05, log2(Foldchange) > 1) within the subtype were selected as representative miRNA of the subtype. Based on the miRDB, miRTarBase and TargetScan database, mRNA regulated by these representative miRNAs were selected, and then functional annotation and enrichment analysis were conducted using Gene Ontology (GO) and Kyoto Encyclopedia of Genes and Genomes (KEGG). Term P.adjust-value < 0.05 was considered statistically significant difference.
Functional Enrichment Analysis and Protein-Protein Interaction (PPI) Network Construction
To investigate protein interactions involving core marker mRNAs within the lncRNA-miRNA-mRNA regulatory network, the STRING database (https://string-db.org/) was used to construct a PPI network. Functional annotation and enrichment analysis were performed using GO and KEGG.
Establishment of a TBI Mouse Model
Twelve C57BL/6J mice weighing 18–22 g (8 to 10-week-old) were obtained from Pengyue Laboratory Animal Breeding Co., Ltd. (Jinan, China). Housing facility were maintained at 21 ± 2 °C and 50–70% humidity, with a 12 hours light/12 hours dark cycle. All animal feeding and housing procedures followed the Guideline for the Care and Use of Laboratory Animals. There mice were randomly divided into two groups: control group and TBI model group, with six mice in each group. The experimental design adheres to the 3R principle of “Replacement, Reduction, and Refinement”. Throughout the entire experiment, strict compliance with the drug instructions is maintained, the surgical time is effectively shortened, and the pain endured by the experimental animals is thereby minimized. Mice were anesthetized with intraperitoneal injection of pentobarbital (50 mg/kg) and placed on a brain stereotaxic apparatus. A craniotomy was done on the right parietal cortex. The free-fall impact method was used to establish the TBI mouse model. A 40 g weight was dropped from 20 cm to impact the mouse’s head with 100 ms dwell time and 1 mm depth. TBI model was confirmed by observing apnea and limb convulsions. After hemostasis, the wound was sutured. Control group had the same procedures without impact injury. One week later, mice were euthanized with an overdose of pentobarbital (200 mg/kg) and brain tissues were collected. Two experienced operators blinded to the design performed these experiments. All experimental procedures complied with the ARRIVE guidelines and the NIH guide for laboratory animal care and use, and were approved by the ethical committee of Jining First People’s Hospital (JNRM-2023-DW-061).
Total RNA Isolation and RT-qPCR
Total RNA was isolated from 5 mg of brain tissue using the Total RNA Extraction Kit (Promega, Madison, WI, USA) following the manufacturer’s instructions. RT-qPCR analysis was performed using Hifair® II 1st Strand cDNA Synthesis SuperMix (Yeasen Biotechnology, Shanghai, China) and Hiff® qPCR SYBR Green Master Mix (Yeasen Biotechnology). Gene expression levels were calculated with the 2−ΔΔCt method with U6 as the normalization control. The primer sequences are listed in Table 1.
 |
Table 1 Real-Time PCR Primer Synthesis List |
Statistical Analysis
A quantile normalization scheme was applied to all samples. Following log2 transformation of the data, the limma package was employed for differential expression analyses. Correlation analyses were conducted with Spearman correlation, applying the Benjamini & Hochberg (BH) correction to control for multiple comparisons. Fisher’s exact test to examine associations between TBI classifications and patient characteristics, including coma scale and gender. Data are presented as the mean ± standard deviation (SD). P < 0.05 was considered statistically significant.
Result
The Data Integration and Analysis for lncRNA/mRNA and miRNA/mRNA Association Pairs
PCA was employed to analyze the expression differences of lncRNA/mRNA between control and TBI samples. As shown in Supplementary Figure 1A and B, significant differences in lncRNA/mRNA expression were observed between control and TBI samples. The R package “limma” was used to perform differential expression analysis for GSE171718 dataset. Using a cutoff of P value < 0.05 and |log2(Foldchange)| > 0.58, 229 DElncRNAs were identified, with 160 lncRNAs upregulated and 69 downregulated in TBI samples (Figure 2A and Supplementary Table 3A). Additionally, 683 DEmRNAs were identified, with 381 mRNAs upregulated and 302 downregulated in TBI samples (Figure 2B and Supplementary Table 3B). The Spearman correlation coefficient between DElncRNAs and DEmRNAs was calculated using the cor.test function, yielding 48985 lncRNA/mRNA association pairs with a cutoff of P value < 0.05 and |R| > 0.6. PCA was then applied to the mRNA data from the GSE223245 dataset and the miRNA data from the GSE131695 dataset (Supplementary Figure 1C and D), revealing significant differences between control and TBI samples. In the GSE223245 dataset, using the R package “limma” (P value < 0.05 and |log2(Foldchange)| > 0.58), 744 DEmRNAs were identified, including 251 upregulated and 493 downregulated in TBI samples (Figure 2C and Supplementary Table 3C). Moreover, 144 DEmiRNAs were identified in the GSE131695 dataset. Among these, 96 mRNAs were upregulated, while 48 were downregulated in TBI samples (Figure 2D and Supplementary Table 3D). Based on the miRDB, miRTarBase and TargetScan databases, we identified miRNA/mRNA association pairs with opposite expression trend in TBI samples.
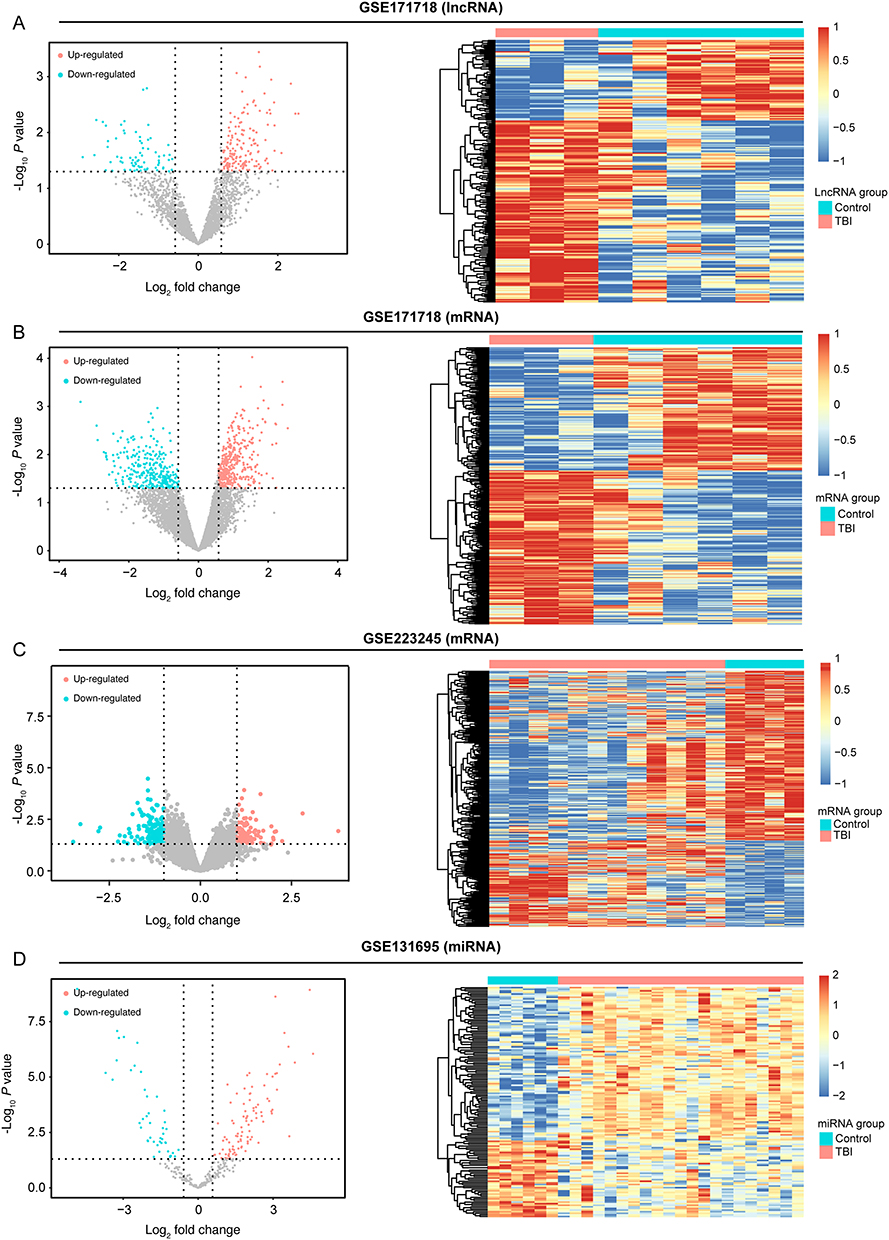 |
Figure 2 The data integration and analysis for lncRNA/mRNA and miRNA/mRNA association pairs. Notes: (A) Volcano plots and heat map of DE-lncRNAs in the GSE171718 dataset. (B) Volcano plots and heat map of DE-mRNAs in the GSE171718 dataset. (C) Volcano plots and heat map of DE-mRNAs in the GSE223245 dataset. (D)Volcano plots and heat map of DE-miRNAs in the GSE131695 dataset. |
Construction of lncRNA-miRNA-mRNA Network
Using the lncRNA/mRNA association pairs from the GSE171718 dataset and miRNA/mRNA association pairs from the GSE223245 and GSE131695 datasets, we constructed the lncRNA-miRNA-mRNA ceRNA network (Figure 3A and Supplementary Table 4). Furthermore, the expression levels of the three marker genes (GOLGA8B, ZNF367 and SMPD3) in the GSE171718 and GSE223245 datasets were utilized to construct a random forest classifier. As illustrated in Figure 3B and C, both datasets exhibited high AUC density curves, suggesting that these mRNAs play a critical role in the pathogenesis of TBI.
 |
Figure 3 Establishment of ceRNAs regulatory network. Notes: (A) The lncRNA-miRNA-mRNA ceRNAs regulatory network. (B) AUC and accuracy density distributions of GSE171718. (C) AUC and accuracy density distributions of GSE223245. |
Relationships Between Energy Metabolism-Related Genes and TBI Pathogenesis
As illustrated in Figure 4A, only one overlapping gene was identified between DEmRNAs and energy metabolism-related gene sets: SMPD3. Additionally, significant co-expression was observed among the three marker genes (SMPD3, GOLGA8B, and ZNF367) in the GSE223245 dataset, with a notable interaction between SMPD3 and GOLGA8B (Table 2). Consequently, the significantly interacting miRNAs with GOLGA8B and SMPD3 in the ceRNA network were selected (Table 3), and consensus clustering analysis was performed on the GSE131695 dataset, resulting in well-defined clustering into four classes (Supplementary Figure 2A-L). PCA analysis further demonstrated significant separation among the clusters (Figure 4B). Among the various clinical symptoms, cluster 4 was significantly associated with moderate unconsciousness (Figure 4C), while cluster 1 was significant associated with female patients (Figure 4D).
 |
Table 2 Three Marker Genes (SMPD3, GOLGA8B, and ZNF367) Were Co-Expressed in the GSE223245 Dataset |
 |
Table 3 The Significantly Interacting miRNAs with GOLGA8B and SMPD3 in the ceRNA Network |
 |
Figure 4 Relationships between energy metabolism-related genes and TBI pathogenesis. Notes: (A) Venn diagram between DE-mRNAs of ceRNAs regulatory network and marker genes in MSigDB. (B) Principal components analysis among the four clusters in the GSE131695 dataset. The column chart of clinical symptoms (C) and gender (D) in the GSE131695 dataset. *P < 0.05. |
Functional Analysis of mRNA Enriched in Cluster 1 and 4
Subsequently, representative miRNAs for cluster 1 and 4 were identified based on their expression levels. Gender difference-related miRNAs are presented in Supplementary Table 5A, and moderate unconsciousness-related miRNAs are presented in Supplementary Table 5B. The regulatory relationships between miRNAs and mRNAs were determined using the miRDB, miRTarBase, and TargetScan databases for cluster 1-regulated mRNAs (Supplementary Table 5C) and cluster 4-regulated mRNAs (Supplementary Table 5D). GO and KEGG enrichment analyses revealed that mRNAs in cluster 1 were primarily associated with lactose metabolism, response to parathyroid hormone, and long-term depression, whereas mRNAs in cluster 4 were primarily involved in the regulation of heart and organ growth and mesenchyme morphogenesis (Supplementary Table 5E and F).
PPI Analysis of SMPD3, GOLGA8B, and ZNF367
The PPI network of the three core marker mRNAs was constructed using the STRING database (Figure 5A). As shown in Supplementary Table 6A and B, functional enrichment analysis of the interacting proteins revealed their primary involvement in programmed necrotic cell death, glycosphingolipid metabolic process, Alzheimer’s disease, and insulin resistance. Additionally, a TBI mouse model was established to validate the expression levels of SMPD3, GOLGA2D and ZNF367 in brain tissues. Because the GOLGA8B gene does not exist in murine, we measured the expression levels of GOLGA2D, which has the highest homology to GOLGA8B. As illustrated in Figure 5B-D, the expression of SMPD3, GOLGA2D, and ZNF367 was significantly downregulated in TBI samples compared to control samples (P < 0.05), consistent with our analysis results (Supplementary Table 7A-C).
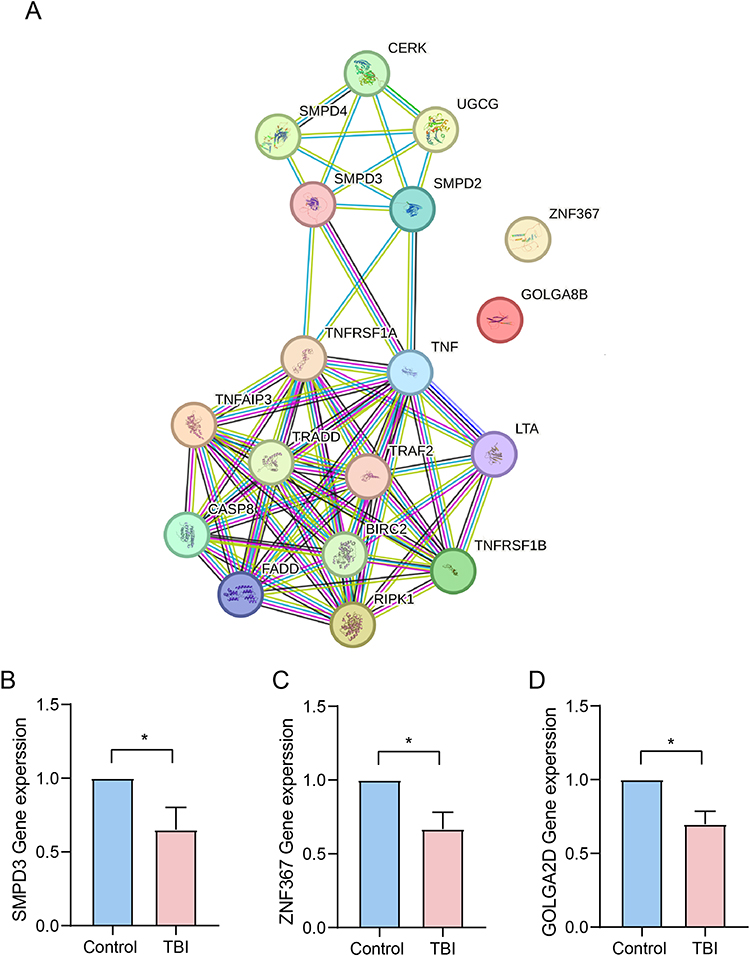 |
Figure 5 PPI analysis of SMPD3, GOLGA8B, and ZNF367. Notes: (A) The PPI network of the three core marker mRNAs was constructed using the STRING database. The expression of SMPD3 (B), ZNF367 (C) and GOLGA2D (D) in different groups. *P < 0.05. |
Discussion
TBI can be defined as the disruption in brain function caused by external physical forces.41 Glucose aerobic metabolism is the primary energy source for the normal brain. Adequate cerebral blood flow delivers glucose, oxygen, and other nutrients to sustain normal neurologic function.30 During TBI progression, multiple pathological alterations occur, including impaired cerebral blood flow regulation, brain tissue damage, brain metabolism disturbance, and inflammatory responses, resulting in neuronal death.42 Preclinical animal studies consistently reported that energy metabolic stress occurs following TBI.43,44
In the current study, we identified DElncRNAs, DEmiRNAs, and DEmRNAs in TBI and control samples from the GSE171718, GSE131695 and GSE223245 datasets. Using lncRNA/mRNA association pairs from the GSE171718 dataset and miRNA/mRNA association pairs from the GSE223245 and GSE131695 datasets, we constructed a lncRNA-miRNA-mRNA ceRNA network that includes three core marker mRNAs: GOLGA8B, ZNF367 and SMPD3. GOLGA8B, located on chromosome 15, belongs to the Golgin family and is primarily expressed in brain tissues, particularly in the cerebellum and cerebellar hemisphere tissues.45,46 Previous studies have linked GOLGA8B to various neurological diseases, including dementia and amyotrophic lateral sclerosis.47 In this study, GOLGA8B was identified as a differentially expressed marker gene in TBI samples from the GSE171718 and GSE223245 datasets. Furthermore, our animal experiments confirmed that GOLGA2D, the gene with the highest homology to GOLGA8B in mice, was expressed at lower levels in TBI mice compared to control mice. Additionally, miRNAs such as miR-30b-5p, miR-30c-5p, miR-30d-5p, and miR-32-5p, which interact with GOLGA8B, were associated with moderate unconsciousness and female patients in TBI, suggesting that GOLGA8B was a pathogenic role in in TBI.
ZNF367, located on chromosome 9q22.32, is part of the zinc finger protein family.48 It is differentially expressed in cancers such as breast cancer, glioma and adrenocortical carcinoma, and papillary thyroid cancer.49–51 ZNF367 has been reported to be an important modulator of neuroblast proliferation and plays a key role in DNA replication and cell cycle regulation.52 In our study, ZNF367 was found to be downregulated in TBI samples from the GSE171718 and GSE223245 datasets and in the brain tissues of TBI mice. This suggests that, similar to GOLGA8B, ZNF367 may also contribute to the pathogenic of TBI. However, PPI analysis did not reveal any interacting proteins with GOLGA8B or ZNF367, indicating that while these genes may be involved in TBI pathogenesis, they are likely not related to energy metabolism. The precise functions of GOLGA8B and ZNF367 in TBI pathogenesis require further investigation.
Sphingomyelin is the major component of subcellular membranes in the central nervous system, can be hydrolyzed into phosphorylcholine and ceramide by SMPD1, SMPD2 and SMPD3. Ceramide, among these hydrolysis products, plays a crucial role in cell growth, differentiation, senescence, and apoptosis.53,54 Previous research has demonstrated that SMPD3 deficiency can disrupt the hypothalamus–pituitary growth axis and promote the progressive depositions of neuronal proteins, ultimately leading to neurodegenerative and cognitive decline-related diseases such as Alzheimer’s disease.55,56 The translation product of SMPD3 is nSMase2. It’s strongly expressed in the brain and generates ceramide, a bioactive lipid involved in many cellular processes like gene expression control.57 nSMase2 is a target for treating cancer and neurological disorders.58 In the cerebral ischemia model, inhibiting nSMase2 to stop ceramide production and accumulation mainly happens in hippocampal astrocytes, lessening neuronal damage. This indicates that targeting nSMase2 activity to inhibit ceramide production might be a good way to prevent pathological ceramide accumulation in neurological diseases.59 The analysis and prediction of RNA seq data from the cerebral cortex of mice lacking nSMase2 showed enhanced neural plasticity and stronger resistance to some neurodegenerative diseases.60 In addition, there have been reports indicating that nSMase2 can regulate insulin resistance, which is similar to our findings on energy metabolism.61 Multiple studies have shown that the activity of nSMase2 is closely related to the progression of neurological diseases such as cerebral ischemia and Alzheimer’s disease. In the nervous system, SMPD3 has been shown to regulate neuronal survival and differentiation.62 Therefore, we screened SMPD3 from the TBI dataset and speculated that it also plays a key role in the progression of TBI.
Consistent with this, our study identified SMPD3 as the only differentially expressed gene associated with energy metabolism in TBI progression. The predicted miR-218-5p, which interacts with SMPD3, was also linked to moderate unconsciousness and female patients in TBI. Furthermore, our animal experiments revealed significant downregulation of SMPD3 expression in TBI mice compared to control mice. These results strongly suggest that SMPD3 functions as an energy metabolism gene involved in TBI progression. To further substantiate this hypothesis, we analyzed the PPI network for the SMPD3 protein. The analysis indicated that SMPD3-interacting protein are primarily involved in programmed cell death, apoptosis, sphingolipid metabolism, Alzheimer’s disease, and insulin resistance. Therefore, we conclude that SMPD3, acts as an energy metabolism gene, contributes to programmed cell death, apoptosis, and sphingolipid metabolism, ultimately influencing the progression of TBI.
Limitations and Strengths
Our study also has certain limitations, such as not distinguishing age, gender, and strict TBI staging. In future research, we will refine clinical samples of TBI of different classifications, actively explore the regulatory role and mechanism of SMPD3 in the progression of TBI by regulating energy metabolism, detect dynamic expression profiles, and construct a complete TBI energy metabolism regulatory network. Furthermore, we will also actively utilize basic experiments to verify and explore the underlying mechanism of action at a deeper level. Nevertheless, our research findings can provide insights for TBI energy metabolism related research and clinical diagnosis and treatment, valuable theoretical basis for TBI related research and offer new reference biomarkers and therapeutic targets for the diagnosis, staging, and treatment of TBI in clinical practice.
Conclusion
In summary, a lncRNA-miRNA-mRNA network centered on three core marker mRNAs—GOLGA8B, ZNF367 and SMPD3—was constructed. Among these, SMPD3 emerged as the only differentially expressed gene associated with energy metabolism in TBI progression, particularly linked to moderate unconsciousness and female TBI patients. This study highlights potential targets for future experimental validation and offers valuable insights for further research on the role of energy metabolism in TBI.
Data Sharing Statement
The datasets analyzed during the current study are available from the corresponding author on reasonable request.
Acknowledgments
We acknowledge the strong support of Affiliated Hospital of Jining Medical University, Jining First People’s Hospital and Tengzhou Central People’s Hospital.
Author Contributions
All authors made a significant contribution to the work reported, whether that is in the conception, study design, execution, acquisition of data, analysis and interpretation, or in all these areas; took part in drafting, revising or critically reviewing the article; gave final approval of the version to be published; have agreed on the journal to which the article has been submitted; and agree to be accountable for all aspects of the work.
Funding
This work was supported by National Natural Science Foundation of China (Grant number: 81901954 & 82272253), Natural Science Foundation of Shandong Province (Grant number: ZR2023MH365 & ZR2023QH094) and Taishan Scholar Project of Shandong Province (Grant number: tsqn201812159).
Disclosure
The authors declare that they have no competing interest.
References
1. Najem D, Rennie K, Ribecco-Lutkiewicz M, et al. Traumatic brain injury: classification, models, and markers. Biochem Cell Biol. 2018;4(96):391–406. doi:10.1139/bcb-2016-0160
2. Eum RS, Brown AW, Watanabe TK, et al. Risk Factors for Institutionalization After Traumatic Brain Injury Inpatient Rehabilitation. J Head Trauma Rehabil. 2017;3(32):158–167. doi:10.1097/HTR.0000000000000246
3. Taylor CA, Bell JM, Breiding MJ, et al. Traumatic Brain Injury-Related Emergency Department Visits, Hospitalizations, and Deaths - United States, 2007 and 2013. MMWR CDC Surveill Summ. 2017;9(66):1–16. doi:10.15585/mmwr.ss6609a1
4. O’Connell GC, Smothers CG, Winkelman C. Bioinformatic analysis of brain-specific miRNAs for identification of candidate traumatic brain injury blood biomarkers. Brain Inj. 2020;7(34):965–974. doi:10.1080/02699052.2020.1764102
5. Crandall M, Rink RA, Shaheen AW, et al. Patterns and predictors of follow-up in patients with mild traumatic brain injury. Brain Inj. 2014;11(28):1359–1364. doi:10.3109/02699052.2014.919533
6. Hartings JA, Bullock MR, Okonkwo DO, et al. Spreading depolarisations and outcome after traumatic brain injury: a prospective observational study. Lancet Neurol. 2011;12(10):1058–1064. doi:10.1016/S1474-4422(11)70243-5
7. Lai JQ, Shi YC, Lin S, et al. Metabolic disorders on cognitive dysfunction after traumatic brain injury. Trends Endocrinol Metab. 2022;7(33):451–462. doi:10.1016/j.tem.2022.04.003
8. Mele C, Pingue V, Caputo M, et al. Neuroinflammation and Hypothalamo-Pituitary Dysfunction: focus of Traumatic Brain Injury. Int J Mol Sci. 2021;5(22). doi:10.3390/ijms22052686
9. Johnson LW, Prenshaw C, Corbin A. Patient-Centered Approaches to Cognitive Assessment in Acute TBI. Curr Neurol Neurosci Rep. 2023;3(23):59–66. doi:10.1007/s11910-023-01253-7
10. Svedung WT, Hanell A, Howells T, et al. Females Exhibit Better Cerebral Pressure Autoregulation, Less Mitochondrial Dysfunction, and Reduced Excitotoxicity after Severe Traumatic Brain Injury. J Neurotrauma. 2022;(39):1507–1517. doi:10.1089/neu.2022.0097
11. Glenn TC, Kelly DF, Boscardin WJ, et al. Energy dysfunction as a predictor of outcome after moderate or severe head injury: indices of oxygen, glucose, and lactate metabolism. J Cereb Blood Flow Metab. 2003;10(23):1239–1250. doi:10.1097/01.WCB.0000089833.23606.7F
12. Hutchinson PJ, Jalloh I, Helmy A, et al. Consensus statement from the 2014 International Microdialysis Forum. Intensive Care Med. 2015;9(41):1517–1528. doi:10.1007/s00134-015-3930-y
13. Toledano FN, Gottlieb A, Prabhakara KS, et al. High-resolution and differential analysis of rat microglial markers in traumatic brain injury: conventional flow cytometric and bioinformatics analysis. Sci Rep. 2020;1(10):11991. doi:10.1038/s41598-020-68770-0
14. Di Pietro V, Amin D, Pernagallo S, et al. Transcriptomics of traumatic brain injury: gene expression and molecular pathways of different grades of insult in a rat organotypic hippocampal culture model. J Neurotrauma. 2010;2(27):349–359. doi:10.1089/neu.2009.1095
15. Meng Q, Zhuang Y, Ying Z, et al. Traumatic Brain Injury Induces Genome-Wide Transcriptomic, Methylomic, and Network Perturbations in Brain and Blood Predicting Neurological Disorders. EBioMedicine. 2017;16:184–194. doi:10.1016/j.ebiom.2017.01.046
16. Puccio AM, Alexander S. Chapter 4 genomics, transcriptomics, and epigenomics in traumatic brain injury research. Annu Rev Nurs Res. 2015;33:75–109. doi:10.1891/0739-6686.33.75
17. Wang S, Sun Y, Hu S, et al. Construction of a lncRNA-associated competing endogenous RNA regulatory network after traumatic brain injury in mouse. Mol Brain. 2022;1(15):40. doi:10.1186/s13041-022-00925-8
18. Yu J, Lu Z, Liu R, et al. Characterization of the lncRNA-miRNA-mRNA regulatory network to reveal potential functional competing endogenous RNAs in traumatic brain injury. Front Neurosci. 2022;16:1089857. doi:10.3389/fnins.2022.1089857
19. Kalpachidou T, Kummer KK, Kress M. Non-coding RNAs in neuropathic pain. Neuronal Signal. 2020;1(4):NS20190099. doi:10.1042/NS20190099
20. Moreno-Garcia L, Lopez-Royo T, Calvo AC, et al. Competing Endogenous RNA Networks as Biomarkers in Neurodegenerative Diseases. Int J Mol Sci. 2020;24(21). doi:10.3390/ijms21249582
21. He X, Huang Y, Liu Y, et al. Astrocyte-derived exosomal lncRNA 4933431K23Rik modulates microglial phenotype and improves post-traumatic recovery via SMAD7 regulation. Mol Ther. 2023;5(31):1313–1331. doi:10.1016/j.ymthe.2023.01.031
22. He B, Chen W, Zeng J, et al. Long noncoding RNA NKILA transferred by astrocyte-derived extracellular vesicles protects against neuronal injury by upregulating NLRX1 through binding to mir-195 in traumatic brain injury. Aging. 2021;6(13):8127–8145. doi:10.18632/aging.202618
23. Marklund N, Salci K, Ronquist G, et al. Energy metabolic changes in the early post-injury period following traumatic brain injury in rats. Neurochem Res. 2006;8(31):1085–1093. doi:10.1007/s11064-006-9120-0
24. Schurr A. Energy metabolism, stress hormones and neural recovery from cerebral ischemia/hypoxia. Neurochem Int. 2002;1(41):1–8. doi:10.1016/s0197-0186(01)00142-5
25. Yin F, Sancheti H, Patil I, et al. Energy metabolism and inflammation in brain aging and Alzheimer’s disease. Free Radic Biol Med. 2016;100:108–122. doi:10.1016/j.freeradbiomed.2016.04.200
26. Dorsett CR, McGuire JL, DePasquale EA, et al. Glutamate Neurotransmission in Rodent Models of Traumatic Brain Injury. J Neurotrauma. 2017;2(34):263–272. doi:10.1089/neu.2015.4373
27. Stiefel MF, Tomita Y, Marmarou A. Secondary ischemia impairing the restoration of ion homeostasis following traumatic brain injury. J Neurosurg. 2005;4(103):707–714. doi:10.3171/jns.2005.103.4.0707
28. Yoshino A, Hovda DA, Kawamata T, et al. Dynamic changes in local cerebral glucose utilization following cerebral conclusion in rats: evidence of a hyper- and subsequent hypometabolic state. Brain Res. 1991;1(561):106–119. doi:10.1016/0006-8993(91)90755-k
29. Prins ML. Glucose metabolism in pediatric traumatic brain injury. Childs Nerv Syst. 2017;10(33):1711–1718. doi:10.1007/s00381-017-3518-7
30. Xiong Y, Peterson PL, Lee CP. Alterations in cerebral energy metabolism induced by traumatic brain injury. Neurol Res. 2001;(23):129–138. doi:10.1179/016164101101198460
31. Jackson EK, Kotermanski SE, Menshikova EV, et al. Adenosine production by brain cells. J Neurochem. 2017;5(141):676–693. doi:10.1111/jnc.14018
32. Mellergard P, Sjogren F, Hillman J. The cerebral extracellular release of glycerol, glutamate, and FGF2 is increased in older patients following severe traumatic brain injury. J Neurotrauma. 2012;1(29):112–118. doi:10.1089/neu.2010.1732
33. Xu XJ, Yang MS, Zhang B, et al. Glucose metabolism: a link between traumatic brain injury and Alzheimer’s disease. Chin J Traumatol. 2021;1(24):5–10. doi:10.1016/j.cjtee.2020.10.001
34. Cousar JL, Conley YP, Willyerd FA, et al. Influence of ATP-binding cassette polymorphisms on neurological outcome after traumatic brain injury. Neurocrit Care. 2013;2(19):192–198. doi:10.1007/s12028-013-9881-7
35. Krishnamurthy K, Laskowitz DT. Cellular and Molecular Mechanisms of Secondary Neuronal Injury following Traumatic Brain Injury; 2016.
36. Amorini AM, Lazzarino G, Di Pietro V, et al. Metabolic, enzymatic and gene involvement in cerebral glucose dysmetabolism after traumatic brain injury. Biochim Biophys Acta. 2016;4(1862):679–687. doi:10.1016/j.bbadis.2016.01.023
37. Michael DB, Byers DM, Irwin LN. Gene expression following traumatic brain injury in humans: analysis by microarray. J Clin Neurosci. 2005;3(12):284–290. doi:10.1016/j.jocn.2004.11.003
38. Zheng P, Zhang N, Ren D, et al. Integrated spatial transcriptome and metabolism study reveals metabolic heterogeneity in human injured brain. Cell Rep Med. 2023;6(4):101057. doi:10.1016/j.xcrm.2023.101057
39. Weisz HA, Kennedy D, Widen S, et al. MicroRNA sequencing of rat hippocampus and human biofluids identifies acute, chronic, focal and diffuse traumatic brain injuries. Sci Rep. 2020;1(10):3341. doi:10.1038/s41598-020-60133-z
40. Guo G, Gou Y, Jiang X, et al. Long Non-coding RNAs in Traumatic Brain Injury Accelerated Fracture Healing. Front Surg. 2021;8:663377. doi:10.3389/fsurg.2021.663377
41. Timofeev I, Santarius T, Kolias AG, et al. Decompressive craniectomy - operative technique and perioperative care. Adv Tech Stand Neurosurg. 2012;38:115–136. doi:10.1007/978-3-7091-0676-1_6
42. Vella MA, Crandall ML, Patel MB. Acute Management of Traumatic Brain Injury. Surg Clin -North Am. 2017;5(97):1015–1030. doi:10.1016/j.suc.2017.06.003
43. Casey PA, McKenna MC, Fiskum G, et al. Early and sustained alterations in cerebral metabolism after traumatic brain injury in immature rats. J Neurotrauma. 2008;6(25):603–614. doi:10.1089/neu.2007.0481
44. Robertson CL, Saraswati M, Scafidi S, et al. Cerebral glucose metabolism in an immature rat model of pediatric traumatic brain injury. J Neurotrauma. 2013;24(30):2066–2072. doi:10.1089/neu.2013.3007
45. Feronato SG, Silva MLM, Izbicki R, et al. Selecting Genetic Variants and Interactions Associated with Amyotrophic Lateral Sclerosis: a Group LASSO Approach. J Pers Med. 2022;8(12). doi:10.3390/jpm12081330
46. Munro S. The golgin coiled-coil proteins of the Golgi apparatus. Cold Spring Harbor Perspect Biol. 2011;6(3). doi:10.1101/cshperspect.a005256
47. Blue EE, Thornton TA, Kooperberg C, et al. Non-coding variants in MYH11, FZD3, and SORCS3 are associated with dementia in women. Alzheimers Dement. 2021;2(17):215–225. doi:10.1002/alz.12181
48. Gilligan P, Brenner S, Venkatesh B. Fugu and human sequence comparison identifies novel human genes and conserved non-coding sequences. Gene. 2002;(294):35–44. doi:10.1016/s0378-1119(02)00793-x
49. Jain M, Zhang L, Boufraqech M, et al. ZNF367 inhibits cancer progression and is targeted by miR-195. PLoS One. 2014;7(9):e101423. doi:10.1371/journal.pone.0101423
50. Li X, Wang H. Long Non-Coding RNA GABPB1-AS1 Augments Malignancy of Glioma Cells by Sequestering MicroRNA-330 and Reinforcing the ZNF367/Cell Cycle Signaling Pathway. Neuropsychiatr Dis Treat. 2021;17:2073–2087. doi:10.2147/NDT.S305182
51. Zeng H, Li T, Zhai D, et al. ZNF367-induced transcriptional activation of KIF15 accelerates the progression of breast cancer. Int J Biol Sci. 2020;12(16):2084–2093. doi:10.7150/ijbs.44204
52. Naef V, Monticelli S, Corsinovi D, et al. The age-regulated zinc finger factor ZNF367 is a new modulator of neuroblast proliferation during embryonic neurogenesis. Sci Rep. 2018;1(8):11836. doi:10.1038/s41598-018-30302-2
53. Hannun YA, Obeid LM. The Ceramide-centric universe of lipid-mediated cell regulation: stress encounters of the lipid kind. J Biol Chem. 2002;29(277):25847–25850. doi:10.1074/jbc.R200008200
54. Hannun YA, Obeid LM. Many ceramides. J Biol Chem. 2011;32(286):27855–27862. doi:10.1074/jbc.R111.254359
55. Piaceri I, Nacmias B, Sorbi S. Genetics of familial and sporadic Alzheimer’s disease. Front Biosci (Elite Ed). 2013;1(5):167–177. doi:10.2741/e605
56. Stoffel W, Jenke B, Block B, et al. Neutral sphingomyelinase 2 (smpd3) in the control of postnatal growth and development. Proc Natl Acad Sci U S A. 2005;12(102):4554–4559. doi:10.1073/pnas.0406380102
57. Ogretmen B, Hannun YA. Biologically active sphingolipids in cancer pathogenesis and treatment. Nat Rev Cancer. 2004;8(4):604–616. doi:10.1038/nrc1411
58. Airola MV, Shanbhogue P, Shamseddine AA, et al. Structure of human nSMase2 reveals an interdomain allosteric activation mechanism for ceramide generation. Proc Natl Acad Sci U S A. 2017;28(114):E5549–E5558. doi:10.1073/pnas.1705134114
59. Gu L, Huang B, Shen W, et al. Early activation of nSMase2/ceramide pathway in astrocytes is involved in ischemia-associated neuronal damage via inflammation in rat hippocampi. J Neuroinflammation. 2013;10:109. doi:10.1186/1742-2094-10-109
60. Zhu Z, McClintock TS, Bieberich E. Transcriptomics analysis reveals potential regulatory role of nSMase2 (Smpd3) in nervous system development and function of middle-aged mouse brains. Genes Brain Behav. 2024;4(23):e12911. doi:10.1111/gbb.12911
61. El-Amouri S, Karakashian A, Bieberich E, et al. Regulated translocation of neutral sphingomyelinase-2 to the plasma membrane drives insulin resistance in steatotic hepatocytes. J Lipid Res. 2023;10(64):100435. doi:10.1016/j.jlr.2023.100435
62. Stoffel W, Jenke B, Schmidt-Soltau I, et al. SMPD3 deficiency perturbs neuronal proteostasis and causes progressive cognitive impairment. Cell Death Dis. 2018;5(9):507. doi:10.1038/s41419-018-0560-7
 © 2024 The Author(s). This work is published and licensed by Dove Medical Press Limited. The
full terms of this license are available at https://www.dovepress.com/terms.php
and incorporate the Creative Commons Attribution
- Non Commercial (unported, 3.0) License.
By accessing the work you hereby accept the Terms. Non-commercial uses of the work are permitted
without any further permission from Dove Medical Press Limited, provided the work is properly
attributed. For permission for commercial use of this work, please see paragraphs 4.2 and 5 of our Terms.
© 2024 The Author(s). This work is published and licensed by Dove Medical Press Limited. The
full terms of this license are available at https://www.dovepress.com/terms.php
and incorporate the Creative Commons Attribution
- Non Commercial (unported, 3.0) License.
By accessing the work you hereby accept the Terms. Non-commercial uses of the work are permitted
without any further permission from Dove Medical Press Limited, provided the work is properly
attributed. For permission for commercial use of this work, please see paragraphs 4.2 and 5 of our Terms.