")
Back to Journals » Clinical Ophthalmology » Volume 18
Fluctuations of Anterior Chamber Depth and Astigmatism in Pseudophakic Eyes
Authors Tutchenko L, Patel S , Skovron M, Voytsekhivskyy OV , Gilevska F
Received 20 August 2024
Accepted for publication 4 December 2024
Published 13 December 2024 Volume 2024:18 Pages 3739—3752
DOI https://doi.org/10.2147/OPTH.S492253
Checked for plagiarism Yes
Review by Single anonymous peer review
Peer reviewer comments 3
Editor who approved publication: Dr Scott Fraser
Larysa Tutchenko,1,* Sudi Patel,2,* Mykhailo Skovron,1,* Oleksiy V Voytsekhivskyy,1,* Fanka Gilevska3,*
1Department of Corneal Pathology, Ophthalmic Oncology and Oculoplasty, Kyiv Clinical Ophthalmology Hospital Eye Microsurgery Center, Kyiv, 03680, Ukraine; 2Department of Cataract and Refractive Surgery, University Eye Clinic Svjetlost, Zagreb, 10000, Croatia; 3Department of Refractive Surgery, Eye Clinic Sistina Oftalmologija, Skopje, 1000 Republic of North Macedonia
*These authors contributed equally to this work
Correspondence: Sudi Patel, Department of Cataract and Refractive Surgery, University Eye Clinic Svjetlost, Heinzelova 39, Zagreb, 10000, Croatia, Email [email protected]
Purpose: To explore the significance of changes in anterior chamber depth (ΔACD) and astigmatism between 4 and 8 weeks following uneventful phacoemulsification.
Patients and Methods: Anterior chamber depth (ACD, mm), autorefractometry and subjective refraction were monitored in pseudophakic eyes implanted with non-toric IOLs (group 1, SA60AT, n=36; group 2, SN60WF, n=34; group 3, ICBOO, n=16) and phakic control group (n=30, group 4a, for ACD and autorefractometry) over four weeks. Changes in subjective refractions were compared with repeatability in normal phakic eyes (n=30, group 4b).
Results: Reporting key results (p< 0.01), mean (±sd 95% CI) ΔACD values (ACD at start minus ACD at four weeks) were +0.02 (± 0.37, − 0.16 to 0.08), +0.22 (± 0.51,0.05 to 0.39), − 0.33 (± 0.51, − 0.58 to − 0.08), − 0.02 (± 0.07, − 0.04 to 0.01) in groups 1– 4a respectively. Differences were significant (1-way ANOVA, F=7.02). Pooling data from the pseudophakic eyes (n=86) induced astigmatism (IA) by autorefractometry was significantly greater in comparison with group 4a [− 0.78D (± 0.67, − 0.92 to − 0.64) and − 0.19D (± 0.16, − 0.25 to - 0.13)]. IA power correlated with the initial power of refractive astigmatism at 4 weeks (A), [IA = 0.36A− 0.30 (r2=0.207) and IA = 0.39A− 0.29 (r2=0.232) by autorefractometry and subjective refraction, respectively]. In groups 1– 3, vector analysis revealed i) the change in refraction in over 55% of eyes was beyond the 95% confidence interval limits observed in groups 4a and 4b, ii) some significant associations between changes in vectors describing astigmatism with ΔACD and IOL labelled power.
Conclusion: Changes in ACD and refraction still occur four weeks after unremarkable phacoemulsification and the inter-relationship depends on IOL design/type. Other factors, such as tilt or dislocation of the IOL along the X-Y axes parallel to Listing’s plane, accompanying changes in ACD are expected to affect the postop astigmatism.
Keywords: anterior chamber depth (ACD), astigmatism, IOL position, refraction, phacoemulsification
Introduction
It has been claimed that refractive errors tend to stabilize by one week after unremarkable phacoemulsification.1–4 A meta-analysis of findings in 6680 papers concluded no statistically significant changes in the average refractive error occur after the first week following uncomplicated routine phacoemulsification. Yet, astigmatism remained unsettled in about 7% of cases.5
Intra-ocular lenses (IOLs) are designed to remain static after implantation. However, there is an overall tendency for the IOL to shift towards the cornea during the first week post-implantation, resulting in a reduction of the anterior chamber depth (ACD), then and a gradual backward shift increasing ACD.6–9 Posterior capsulotomy with an Nd:YAG laser enhances this backward shift with a concurrent increase in hyperopia.10 Shifting the IOL towards the cornea is associated with a slight increase in myopia/fall in hyperopia. A shift towards the retina is associated with a slight fall in myopia/increase in hyperopia. Any increase in ocular power resulting from a forward displacement of the IOL, and subsequent reduction of ACD, can benefit near vision in the pseudophakic eye. This was the modus operandi of the IOLs with a supposed accommodative effect. These IOLs were designed to respond to any ciliary muscle activity by displacing the optics of the implant towards either the cornea during near vision or the retina during distance vision. However, such IOLs have met with limited success.11–14 Furthermore, the change in the spherical component of the residual refractive error is, at least in theory, a function of IOL power and the magnitude of IOL displacement.15 The displacement of a non-toric IOL along the anteroposterior axis is not expected to impact on the astigmatism of the eye. On the other hand, a change in the tilt of the IOL or displacement along the plane perpendicular to the anteroposterior axis of the eye, will induce some astigmatism that might impact on the measured refractive error. Besides changing ACD, Nd:YAG capsulotomy can affect the centration and/or tilt of the IOL, and the knock-on effect of this is a change in the astigmatism.16,17 The induced astigmatism resulting from these displacements ultimately depends on IOL power.18–20 For an IOL power of about 20D, the induced astigmatism is ≤0.50D for a change in tilt of ≈10° or decentration along the perpendicular plane of ≈1mm.
Any modulation of the astigmatism at the ocular surface is bound to impact on refractive astigmatism. However, it has long been recognized that corneal astigmatism is reasonably stable by one month after phacoemulsification.21 So, a change in refractive astigmatism occurring more than one month after unremarkable phacoemulsification could result from a displacement of the IOL.
The average refraction and location of the IOL may have equilibrated by one month after phacoemulsification, but not necessarily in all cases. To what extent does the refraction and location of the IOL change in individual pseudophakic eyes after 1 month postop and how do these changes compare with those encountered in normal phakic eyes? The aim of this study was to:
- Monitor the residual refractive error and location of the IOL along the anteroposterior axis after routine unremarkable phacoemulsification cases implanted with non-toric IOLs.
- Compare the results with those obtained from regular phakic eyes.
- Determine if any change in refraction was linked to labelled IOL power and the IOL’s location along the anteroposterior axis.
Materials and Methods
Study Design
A prospective, consecutive, partially masked observational comparative study. The study was approved by the Ethics Committees of the Kyiv Clinical Ophthalmology Hospital Eye Microsurgery Center, Eye Clinic Sistina Oftalmologija in Skopje and the tenets of the Helsinki agreement were followed throughout. All patients that underwent surgery provided signed consent after the aims and procedures of the investigation were explained. All measurements were obtained from each patient on a consecutive, case-by-case basis.
Exclusion Criteria
Patients with a history of previous ocular surgery, amblyopia, contact lens wear, corneas thinner than 545 µm, unusual corneal topography or tomography, corneal opacities, active or previous conditions linked to either the anterior or posterior segment were excluded.
Pseudophakic Cases
All cases were elected for routine phacoemulsification cataract surgery.
IOL Power Selection and Description of Pseudophakic Groups
All biometry tests and data acquisition were conducted by one examiner using an IOL Master 700 SWEPT source OCT-biometer (software version 1.70, Carl Zeiss, Meditec AG, Jena). The Barrett Universal II, Haigis, Hoffer Q, Holladay 1, Holladay 2, SRK/T, T2, and VRF IOL power formulae were used. All were part of the IOL Master 700 software version 1.70 except for T2 and VRF. The T2 is an SRK/T formula upgrade and was programmed into an Excel sheet according to all author’s recommendations.22 The VRF formula was available as part of the VRF Suite software (V1.5).23 The IOLs implanted were monofocal, non-toric of either spheric (group 1, SA60AT, Alcon Surgical Inc) or aspheric (group 2, SN60WF, Alcon Surgical Inc; group 3, Tecnis Eyehance ICBOO, Johnson & Johnson Inc) design. The type of IOL selected for implantation was decided after discussion with the patient.
Description of the Preoperative Preparation, Surgery and Postoperative Treatment
The same examiner assessed ACD using the IOL Master 700 SWEPT source OCT-biometer (software version 1.70, Carl Zeiss, Meditec AG, Jena). ACD was accepted as the distance measured from corneal epithelium to anterior IOL surface (anterior lens capsule in phakic control group).24
The horizontal axis on the cornea of the eye scheduled for treatment was marked by one examiner (LT) using a slit lamp-marking technique under topical anesthesia prior to pupil dilation. The slit lamp beam width was adjusted to its’ minimum visible setting then rotated to align over the pupil centre horizontally. The slit lamp was moved over to the contralateral eye to ensure both eyes were positioned along a common axis. When the first Purkinje images in both eyes were aligned at the same height, the slit lamp was then moved over to the eye scheduled for treatment eye without changing the height of the beam. The horizontal axis was marked on the cornea at 3 and 9 o’clock with a 30-gauge sterile needle and stained with 2% collargoli solution (colloidal silver solution). One surgeon (LT) performed all surgeries under topical anesthesia through a 2.2 mm self-sealing clear corneal incision. In all cases, a corneal tunnel was made at 12 o’clock using a Mendez ring and a 1.2 mm paracentesis at 3 and 9 o’clock, all with reference to the preoperative marks. After a 5.0 mm circular capsulorhexis, lens hydrodissection was performed followed by phacoemulsification and bimanual cortex removal using the Infinity Vision System (Alcon Surgical, Inc). The IOL was positioned in the capsular bag, and the wound was closed by stromal hydration. The procedure was completed with injections of dexamethasone (subconjunctival) and betamethasone (parabulbar). Postoperative treatment included drops of levofloxacin, dexamethasone and indomethacin with a gradual tapering off, dexpanthenol gel and a combination of trehalose and hyaluronic acid. Cases were scheduled for follow-ups on the first day, then 2,4,6 and 8 weeks postoperatively, and IOP values were within normal limits at all examinations.
Clinical Assessment of Refractive Error
Pseudophakic Cases
Objective refraction was carried out using a single, recently serviced and calibrated autorefractometer (Tomey RT-7000, Tomey Corp, Tokyo, Japan) followed by routine subjective refraction. All reported cases were checked at 4 and 8 weeks postop.
Phakic Cases
The phakic cases consisted of two separate groups. One to serve as benchmark for the typical change, or repeatability, in objective refraction and assessment of ACD (group 4a) and another for the typical change, or repeatability, in subjective refraction (group 4b). All cases consisted of spectacle wearers recorded as presenting with clear corneas, no signs of cataract, or conditions known to affect refraction or assessment of ACD and corrected distance visual acuity (CDVA) of logMAR 0.0 or better.
Autorefractometry and ACD measurements were carried out on 30 phakic cases (group 4a) without cycloplegia and repeated four weeks later. These volunteers were assessed using a single serviced and calibrated auto kerato-refractometer (Topcon KR-800S, Topcon, Tokyo, Japan).
A database of patients’ repeat spectacle prescriptions was accessed for group 4b cases. The database was filtered out to reveal a set of spectacle prescriptions for individuals that were refracted on two occasions within four weeks in separate clinics by different optometrists. Spectacle prescriptions were selected where the optometrists remained unaware of the patient’s previous refractive result.
Treatment of Refractive Data
A refractive error has three numerical components and occupies a single point in three-dimensional graphical space. Refractive errors can be compared by considering each of the three components as a separate item, but compartmentalizing obscures the combined effect of the other components on the actual difference between two refractive errors. The combined effects are better understood by subjecting refractive data to vector analysis, especially when describing differences in astigmatism.25–27 To gain a more composite understanding, the refractive errors were subjected to vector analysis by calculating the equivalent M, J0, J45 & B vectors, and the periodic changes thereof (designated by ΔM, ΔJ0, ΔJ45, ΔB) using procedures described elsewhere.25,26 The values of M, J0, J45 & B for the sphere [S], astigmatic cylinder power [C] and axis [θ] of a refractive are determined as follows:
M = S + C/2, the often-noted best sphere equivalent (SEQ).
J0 = (-C/2).cos (2θ), a description of the vertical/horizontal component of astigmatism.
J45 = (-C/2).sin (2θ), a description of the oblique component of astigmatism.
B= √[M2 + J02 + J452], the total blurring strength of the refractive error.
The ΔM, ΔJ0, ΔJ45, ΔB values for two refractive errors, Rx1 and Rx2, are ΔM = M for Rx1 - M for Rx2, ΔJ0 = J0 for Rx1 - J0 for Rx2, ΔJ45 = J45 for Rx1 - J45 for Rx2 and ΔB = √[ΔM2 + ΔJ02 + ΔJ452].
These procedures transform astigmatism from a polar into a cartesian format but do not show the actual power and axis of the astigmatism induced over a period. The astigmatism induced over a period was calculated using a simple equivalent of Alpins’ method.28
Data and Statistical Analysis
Data were stored on Excel spreadsheets (Microsoft, Redmond, WA), and only the results from the right eyes in bilateral cases were selected for analysis.
Data were then analyzed to determine the significance of any:
- Changes in refractive errors and ACD within and between groups (paired and unpaired t-test, 1-way ANOVA).
- Differences of induced astigmatic powers, axes, ΔM, ΔJ0, ΔJ45 & ΔB values between groups (1-way ANOVA).
- Correlation between the change (Δ) in M, J0, J45, B, ACD, and induced astigmatism with the corresponding values at the start of each period (Pearson correlation).
- Association between the induced astigmatic powers, axes, ΔM, ΔJ0 ΔJ45 & ΔB values, corresponding change in ACD and labelled IOL power in pseudophakic group (multilinear regression, Pearson correlation).
If significant trends were revealed, then data would be subjected to multilinear regression to determine any significant links between changes in refraction, ΔACD and labelled IOL power.
Appropriate non-parametric tests were planned for application if any data set was not normally distributed (Kolmogorov Smirnov test).
Results
Fifty female and 36 male patients underwent unremarkable phacoemulsification without complications. Thirty-six were implanted with the spherical SA60AT (group 1), 34 with the aspheric SN60WF (group 2) and 16 with the aspheric ICBOO (group 3). The key results from the pseudophakic and phakic control groups (groups 4a and 4b) are shown in Tables 1–4. The averaged root mean square changes (RMSΔ) in the components of refractive errors are included in Tables 1–3. The distribution of results in each data set was not significantly different from the normal distribution (Kolmogorov Smirnov test p>0.05). Subsequently, data were subjected to parametric tests.
 |
Table 1 Baseline Data, IOL Powers and ACD Values |
 |
Table 2 Refractive Data by Autorefractometry |
 |
Table 3 Refractive Data by Subjective Refraction |
 |
Table 4 Correlations Between Changes in Each Descriptor of Refractive Error and Its’ Value at the Commencement of the Study |
Differences in mean ACD values were significant at 4 and 8 weeks (1-way ANOVA, at four weeks F=6.09, p=0.004, at eight weeks F=21.56, p<0.001). Post-hoc Tukey’s test revealed significant differences between groups 1 and 3 at four weeks (Q=4.98, p=0.002), at eight weeks (Q=9.34, p<0.001) and between groups 2 and 3 at eight weeks (Q=8.33, p<0.001).
The mean ACD at four weeks was significantly different from the mean ACD at eight weeks in groups 2 and 3 (paired t-test p=0.021 and 0.024 respectively) but not in group 1 (p=0.738). Mean ACD remained fairly stable in group 4a (control) over the four weeks (p>0.05).
For groups 1–4a, the apparent changes in anterior chamber depth (ΔACD) over four weeks were significant (1-way ANOVA, F=7.02, p<0.001). Post-hoc Tukey’s test revealed the differences in ΔACD between groups 1 and 3 (Q=4.54, p=0.009), 2 and 3 (Q=7.07, p<0.001), and 4a and 3 (Q=4.02, p=0.027) were significant. The apparent differences between 1 and 2 (Q=2.54, p=0.280), 1 and 4a (Q=0.51, p=0.980), 2 and 4a (Q=30.5, p=0.140) were not significant.
There was no significant correlation (p>0.05) between ΔACD and IOL power in each single pseudophakic group.
Comparison of Changes in Refraction Between IOL Types
There were no significant differences in either changes of refractive errors or induced astigmatism, determined by either autorefractometry or subjective refraction, between the three pseudophakic groups over the period between 4 and 8 weeks (1-way ANOVA, p>0.05 for spherical and astigmatic powers and astigmatic axes). Thus, the changes in refraction between 4 and 8 weeks can be considered as being drawn from a single common pool. These data were merged into a single group and shown in Tables 2 and 3.
Comparison of Changes in Refraction Between Pseudophakic and Phakic Cases
Table 2 (autorefractometry) shows there were no significant differences between the pseudophakic and phakic groups regarding changes in the root mean square (RMSΔ) spherical component of the refractive errors, astigmatic axes, ΔM and ΔJ45 vectors (p=0.770, 0.660, 0.091 and 0.951 respectively). The differences in the RMSΔ in astigmatic power, induced astigmatic power, ΔJ0 and ΔB were significant (p<0.001, p<0.001, p=0.011 and p<0.001, respectively). Closer examination revealed significant differences in the RMSΔ change in the astigmatic component of the refractive errors in the control group (4a) in comparison with groups 1 and 2 (unpaired t-test, p<0.001 and p=0.005, respectively).
Table 3 (subjective refraction) shows there were no significant differences between the pseudophakic and phakic groups with respect to changes in the RMSΔ spherical components of the refractive errors, ΔM and ΔJ45 vectors (p>0.05). The differences in the ΔJ0 and ΔB vectors were significant (p=0.001 and p<0.001, respectively). Closer examination revealed a significant difference between the RMSΔ change in the astigmatic component of the refractive errors in the control group (4b) compared to group 1 (unpaired t-test, p=0.039).
Associations Between Changes (Δ) in M, J0, J45, B, ACD, and Induced Astigmatism with the Corresponding Values at the Start of Each Period
Linear regression revealed significant correlations between the values of some factors at the start and the actual changes that occurred over the time course. These are shown in Table 4.
The ΔACD and ACD data for the IOL groups were kept separate because the RMSΔ ACD values between the groups were significantly different. For the IOL groups, the significant associations between ΔACD and ACD at four weeks are best described as follows,


Further analysis revealed the difference between the two slope values was significant (Wald test for significance of differences between two slopes, t=2.079, p=0.04).29
In groups 3 [ICBOO] and 4a (control), there were no significant correlations between ΔACD and ACD (group 3, r2=0.155, n=16, p=0.131; group 4a, r2=0.033, n=30, p=0.336). Post hoc analysis revealed the minimum sample size for group 3 should be 35 to achieve a p value of <0.02.
Association Between Changes (Δ) in M, J0, J45, B and Induced Astigmatism with ΔACD and IOL Power
Table 2 shows the mean change in blurring strength (ΔB) in the phakic control group was 0.38 with an upper 95% confidence interval limit of 0.51. In a pseudophakic eye, the root cause of a change in “B” up to 0.51 results from the same source, or a combination of sources, naturally affecting the phakic eye. Therefore, other factors such as ΔACD and IOL power may contribute to changes in “B”>0.51 in the pseudophakic eye.
Excluding the pseudophakic cases where ΔB=<0.51, then subjecting the remaining values (n=57) to various transformations and multilinear regression revealed the following meaningful relationships.

(r2 = 0.184, p = 0.012; r2 for x4 = 0.092, p = 0.017; r2 for x12 = 0.070, p = 0.047; r2 for x13 = 0.085, p = 0.028).

(r2 = 0.272, p = 0.005; r2 for x3 = 0.161, p = 0.002; r2 for x1 = 0.085, p = 0.028; r2 for x12 = 0.082, p = 0.030; r2 for x13 = 0.080, p=0.033; r2 for x15 =0.073, p=0.042).
Where x=ΔACD (mm), x1 = IOL power (Dioptres).
Similarly, Table 3 shows the mean change in ΔB by subjective refraction was 0.38 in the phakic control group with an upper 95% confidence interval limit of 0.47. Excluding the pseudophakic cases where ΔB=<0.47 and subjecting the results from the remaining cases (n=48) to multilinear regression revealed the following meaningful relationships.

(r2 = 0.151, p = 0.025; r2 for x2 = 0.084, p = 0.046; r2 for x1 = 0.108, p = 0.022).

(r2 = 0.161, p = 0.018; r2 for x2 = 0.120, p = 0.016; r2 for x12 = 0.089, p = 0.039).

(r2 = 0.336, p = 0.015; r2 for x = 0.095, p = 0.033; r2 for x2 = 0.147, p = 0.007; r2 for x3 = 0.082, p = 0.048; x4 = 0.127, p = 0.013; r2 for x1 = 0.114, p = 0.019; r2 for x12 = 0.110, p = 0.021; r2 for x13 = 0.106, p = 0.024).
Where x = ΔACD (mm), x1 = IOL power (Dioptres).
Discussion
A change in ACD could result from a change in the position of the IOL along the anteroposterior axis of the eye or the vault of the cornea. The ACD estimated by IOL Master is the distance between the apex of the anterior cornea and the anterior IOL surface. Therefore, the central corneal thickness (CCT) should be subtracted from this measurement to reveal the distance between the posterior cornea and anterior IOL (ie, the aqueous depth). The CCT initially increases after unremarkable cataract surgery then regresses towards pre-op levels and stabilizes by one month.30–34 Thus, CCT was not likely to change significantly during the study, but a change in axial length (AL) could affect the refractive error. AL reduces after phacoemulsification when combined with trabeculotomy35 or preoperative mannitolization,36 but not significantly when combined with pars plana vitrectomy.33 Using the IOL Master, the reported mean (±sd) change in axial length after phacoemulsification was 0.1 (±0.08) mm.37 Table 1 shows the confidence intervals for changes in ACD (ΔACD) ranged from 0.24 mm in group 1 to 0.50 mm in group 3. These values surpass the likely changes in CCT or AL that may occur between 4 and 8 weeks postop.30–40 Furthermore, Table 2 shows, in groups 1–3 combined, the root mean square change (RMSΔ) in the spherical component of the refractive error and ACD was 0.40D and 0.29 mm, respectively, in the combined groups 1–3. If ΔACD resulted solely from a change in the corneal vault, then the expected change in the residual refractive error would be a rise in myopia of approximately −5D. Therefore, it is reasonable to conclude that the main source of ΔACD is a shift in location of the IOL along the anteroposterior axis of the eye.
In group 3, the IOLs tended to shift ≈0.30 mm away from the cornea, and this was in line with previous reports.7–9,38 But the IOLs in the other two groups behaved differently. The mean ACD significantly reduced in group 2 (aspheric group 2, SN60WF, Alcon Surgical) implying that the IOLs shifted ≈0.20 mm towards the cornea, but not in group 1. The differences in the responses may be related to complications of the capsular bag. For example, phimosis or fibrosis may force some IOLs to move forward and others away from the cornea. However, none of the cases included showed signs of such remarkable complications. Figure 1 shows the case-by-case changes in ACD in the subjects. Three (8.3%) group 1, eight (23.5%) group 2 and 6 (37.5%) group 3 cases shifted by more than 0.5 mm between weeks 4 and 8. In groups 1 and 2, ΔACD between 4 and 8 weeks depended on the ACD value at four weeks and there was a sharp contrast in dynamics between groups 2 (SN60WF) and 3 (ICBOO) IOLs. Xiao et al38 reported that IOLs with “C” loops were more prone to decentration and/or tilt in comparison with IOLs featuring plate haptics. The ICBOO has a “C” loop, and the SN60WF IOL has a modified “L” loop.39 The differences in the design and angulation of the IOL haptics may account for the disparity in the dynamic behaviors of these two IOL designs. According to the manufacturer, the SA60AT and SN60WF IOLs feature similar haptic designs, but eqs 1 and 2 reveal that these two IOLs behave differently. At this stage, an explanation accounting for the differences in IOL dynamics would be speculative. Though, factors such as precise details of the design and rigidity of the haptics, the shape and area of the contact between the haptic and optic should be considered. Figure 1 also shows there was a greater propensity for ACD to change in pseudophakic eyes between 4 and 8 weeks postop in comparison with normal phakic eyes. In total, 6 (7%) shifted by more than 1 mm. ACD changes of such magnitude are expected to affect the residual refractive error, displacements along other axes together with tilt may affect some of the intra-ocular higher-order aberrations. The exact outcomes would also depend on factors pertaining to the IOL (such as power, surface shapes and the refractive index) and the eye in question (such as axial length and corneal curvatures).15,40–45
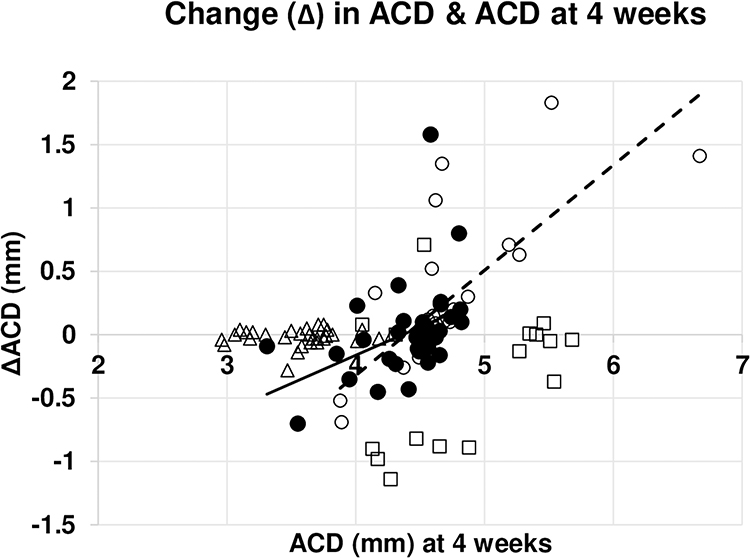 |
Figure 1 Change in anterior chamber depth (ACD) over 4 weeks. Abbreviations: ACD, anterior chamber depth (mm) at either 4 weeks postop in the pseudophakic cases or at the 1st refraction in the phakic cases; ΔACD, ACD at 4 weeks postop (or at the 1st refraction in the phakic cases) minus ACD four weeks later. Notes: Association between ACD and ΔACD in groups 1 (SA60AT cases, filled circles), 2 (SN60WF cases, empty circles), 3 (ICBOO, empty squares) and 4a (phakic cases, triangles) are shown. NB, some data points overlap. The correlation between ACD and ΔACD was significant in groups 1 and 2. The association between ACD and ΔACD is described by ΔACD = 0.46ACD-1.95 (r2=0.164, n=36, p=0.014) in group 1 (solid line) and ΔACD = 0.83ACD-3.64 (r2 = 0.561, n=34, p<0.001) in group 2 (hatched line). |
Tables 2 and 3 show the root mean square (RMS) changes in the refractive errors within the control groups over four weeks. These RMS values are on par with previous reports on the test-retest reliability, or repeatability, of refraction.46–49 The changes in the best sphere equivalent (ΔM) values between four and eight weeks after phacoemulsification were comparable with the repeatability encountered in the normal phakic eyes. So, according to this yardstick, it would be reasonable to conclude that the refractive error stabilizes by four weeks after phacoemulsification and this concurs with the extensive review conducted by Charlesworth et al.5 But the changes in the J0 and B vectors were significantly different in the pseudophakic group in comparison with the phakic groups. The calculation of the J0 and B vectors includes the astigmatic power and axis. Therefore, the interaction between changes in spherical and astigmatic components of the residual refractive in pseudophakic cases were not comparable with the counterparts observed in the phakic groups. The mean induced astigmatism (IA), by subjective refraction, in the pseudophakic group was similar to the IA in the phakic group. But the corresponding ΔB values in 48 (55.8%) of pseudophakic cases were outside the 95% confidence interval limit (CI) observed in the phakic group. The autorefractometry data show IA was significantly greater in the pseudophakic cases. In Figure 2, the IA in 82.6% of pseudophakic cases fell outside the 95% CI found in the phakic eyes. However, Figure 3 shows 39.5% of IA values were outside the 95% CI in the phakic eyes. The IA in the pseudophakic group was more diverse than the IA in the phakic group. If the IA in the phakic cases results from random events, then the IA in the pseudophakic cases must be influenced by factors in addition to these random events.
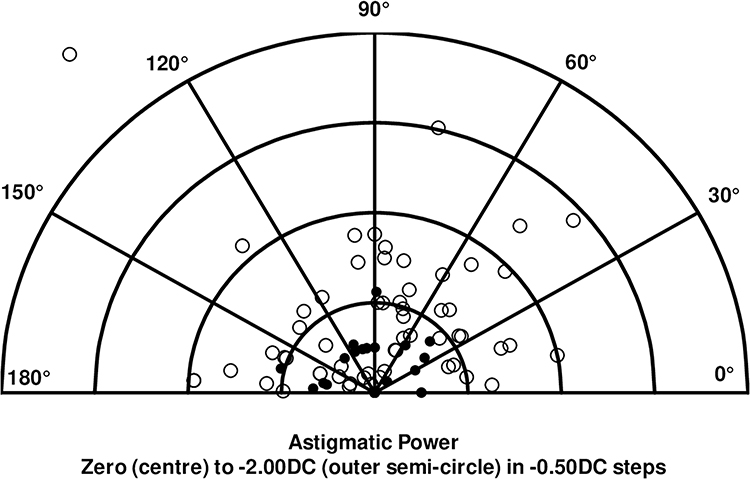 |
Figure 2 Astigmatism induced over 4 weeks as revealed by autorefractometry. Notes: Polar plot of induced astigmatism in the phakic cases (filled circles, group 4a, n=30) and pseudophakic cases (empty circles, n=86). NB, some data points overlap. Each semi-circle represents astigmatic power increasing from −0.50D (innermost) to −2.00D (outermost) in −0.50D steps. The axes are shown in 30° steps anticlockwise from 0° to 90° and onwards to 180°. |
 |
Figure 3 Astigmatism induced over 4 weeks as revealed by subjective refraction. Notes: Polar plot of induced astigmatism in the phakic cases (filled circles, group 4a, n=30) and pseudophakic cases (empty circles, n=86). NB, some data points overlap. Each semi-circle represents astigmatic power increasing from −0.50D (innermost) to −2.00D (outermost) in −0.50D steps. The axes are shown in 30° steps anticlockwise from 0° to 90° and onwards to 180°. |
Table 4 shows the changes in most of the descriptors of the refractive errors were dependent upon the magnitude of the descriptor at the beginning of a period. The power of the IA in the pseudophakic cases significantly correlated with astigmatism at four weeks, and eqs 3–7 reveal the changes in the vectors describing the refractive data were associated with ΔACD and IOL power. These expressions were derived for those cases where the changes in blurring strength (ΔB) values were beyond the 95% CI limits of the ΔB encountered in the phakic groups.
Eq. 7 shows that the change in best sphere equivalent (ΔM) by subjective refraction depended on ΔACD and IOL power. Surprisingly, a similar association was not revealed for the results obtained by autorefractometry. Eq. 7 predicts a ΔM value of −0.52D when a +20.00D IOL moves 0.50 mm towards the retina and +0.24D when the 0.50 mm shift is away from the retina. Paradoxically, the predicted changes are ≈zero when ΔACD = ±1.00 mm. Clearly, factors besides, or in conjunction with, ΔACD coupled with IOL power contribute to changes in refraction.
The IOLs implanted in this study were non-toric. Displacement of such IOLs along the anteroposterior axis of the eye should not impact on astigmatism.15 Hence, a correlation between ΔB or ΔJo with ΔACD and IOL power is not expected. Eqs. 3–6 refute this assertion and raise two points. Firstly, a shift in the position of the IOL along the horizontal and/or vertical axes in a plane parallel to Listing’s plane and/or slight rotation of the IOL about these axes must accompany any displacement of the IOL along the anteroposterior axis. Secondly, the impact on astigmatism is not easy to interpret because, by definition, a single value of Jo represents a combination of astigmatic power and axes. To illustrate this point, if astigmatism at four weeks was −1.50DCx30°, the IOL power was +20D, and there was a shift in the IOL towards the retina by 0.5 mm then, according to eq. 6, astigmatism would change to −1.50DCx42° (assuming the power remained unchanged) or −0.47DCx30° (assuming the axis remained unchanged). Changes occurring at the cornea should affect refraction and contribute to the induced changes shown in Figures 2 and 3. Nevertheless, the values of r2 in eqs. 4 and 6 indicate that up to 27% of the change in astigmatism can be attributed to changes in ACD coupled with IOL power.
The outcomes of this study are limited by the number of cases and measurements that were monitored. A post-hoc power analysis estimates a minimum of 50 group 1 (SA60AT) should be enrolled to improve the chances of detecting a significant shift in mean ACD between 4 and 8 week postop, and a minimum of 40 group 2 (SN60WF) cases should be monitored to improve the chances of detecting a significant difference in mean ΔACD values between groups 1 and 2.50
Future studies in this area should include monitoring the topography of the corneal front and back surfaces, the position and any rotation of the IOL about the vertical and horizontal axes, axial length and higher-order aberrations. This would enable investigators to more precisely identify the sources leading to changes in refraction in the pseudophakic eye.
Conclusion
In over 50% of cases, the change in the residual refractive error between 4 and 8 weeks after routine unremarkable phacoemulsification exceeded the reliability of subjective refraction in the normal phakic eyes. Some patients may notice the changes as the refractive error continues to fluctuate.
The IOL shifted along the antero-posterior axis of the eye in several cases during this period. The change in ACD coupled with the labelled IOL power contributes to changes in the spherical and astigmatic components of the residual refractive error. The impact on astigmatism implies other displacements of the IOL accompany shifts along the anteroposterior axis. A recent paper considers various possibilities, including AI, to control and improve the prediction of IOL location.51 The IOL may settle initially at the predicted location, but the dynamic behaviour of the post-implanted IOL may limit the practical value of such control.
Ethics Approval and Informed Consent
The study was approved by the Ethics Committees of the Kyiv Clinical Ophthalmology Hospital Eye Microsurgery Center, Eye Clinic Sistina Oftalmologija in Skopje and the tenets of the Helsinki agreement were followed throughout. Signed informed consent was obtained from all patients after fully explaining all the procedures, risks, and benefits.
Author Contributions
Each author made a significant contribution to the work reported. Contributions with respect to study conception, design, execution, data collection, analysis, interpretation, drafting, revising or reviewing the article and giving the final approval of the version to be published, agreeing on the journal to which the article will be submitted and agreeing to be accountable for all aspects of the work.
Disclosure
The authors report no conflicts of interest in this work. None of the authors have any financial interest in any of the products or procedures mentioned in this paper. The study was self-financed.
References
1. Sugar A, Sadri E, Dawson DG, et al. Refractive stabilization after temporal phacoemulsification with foldable acrylic intraocular lens implantation. J Cataract Refract Surg. 2001;27:1741–1745. doi:10.1016/S0886-3350(01)00894-X
2. de Juan V, Herreras JM, Pérez I, et al. Refractive stabilization and corneal swelling after cataract surgery. Optom Vis Sci. 2013;90:31–36. Erratum in: Optom Vis Sci. 2013;90:134. doi:10.1097/OPX.0b013e318278fc44
3. Caglar C, Batur M, Eser E, et al. The stabilization time of ocular measurements after cataract surgery. Semin Ophthalmol. 2017;32:412–417. doi:10.3109/08820538.2015.1115089
4. Pattanayak S, Patra SHS, Nanda AK, et al. Stabilization of refraction and timing of spectacle prescription following manual small-incision cataract surgery. Indian J Ophthalmol. 2022;70:3938–3941. doi:10.4103/ijo.IJO_95_22
5. Charlesworth E, Alderson AJ, de Juan V, et al. When is refraction stable following routine cataract surgery? A systematic review and meta-analysis. Ophthalmic Physiol Opt. 2020;40:531–539. doi:10.1111/opo.12719
6. Strenn K, Menapace R, Vass C. Capsular bag shrinkage after implantation of an open-loop silicone lens and a poly (methyl methacrylate) capsule tension ring. J Cataract Refract Surg. 1997;23:1543–1547. doi:10.1016/S0886-3350(97)80027-2
7. Petternel V, Menapace R, Findl O, et al. Effect of optic edge design and angulation on postoperative intraocular lens position change. J Cataract Refract Surg. 2004;30:52–57. doi:10.1016/S0886-3350(03)00556-X
8. Wirtitsch MG, Findl O, Menapace R, et al. Effect of design on change in axial lens position after cataract surgery. J Cataract Refract Surg. 2004;30:45–51. doi:10.1016/S0886-3350(03)00459-0
9. Koeppl C, Findl O, Kriechbaum K, et al. Change in IOL position and capsular bag size with an angulated intraocular lens early after cataract surgery. J Cataract Refract Surg. 2005;31:348–353. doi:10.1016/j.jcrs.2004.04.063
10. Findl O, Drexler W, Menapace R, et al. Changes in intraocular lens position after neodymium: YAG capsulotomy. J Cataract Refract Surg. 1999;25:659–662. doi:10.1016/S0886-3350(99)00010-3
11. Küchle M, Nguyen NX, Langenbucher A, et al. Implantation of a new accommodative posterior chamber intraocular lens. J Refract Surg. 2002;18:208–216. doi:10.3928/1081-597X-20020501-01
12. Findl O, Kiss B, Petternel V, et al. Intraocular lens movement caused by ciliary muscle contraction. J Cataract Refract Surg. 2003;29:669–676.
13. Langenbucher A, Seitz B, Huber S, et al. Theoretical and measured pseudophakic accommodation after implantation of a new accommodative posterior chamber intraocular lens. Arch Ophthalmol. 2003;121:1722–1727.
14. Menapace R, Findl O, Kriechbaum K, et al. Accommodating intraocular lenses: a critical review of present and future concepts. Graefes Arch Clin Exp Ophthalmol. 2007;245:473–489. doi:10.1007/s00417-006-0391-6
15. Alió JL, Patel S. Some factors governing the efficacy of positional pseudoaccommodative intraocular lenses. Ophthalmology. 2005;112:2009–2014. doi:10.1016/j.ophtha.2005.04.033
16. Lu B, Xu H, Wang C, Yan Q, Wang X. Influence of the “Inverted U Method” Nd: YAG laser posterior capsulotomy on anterior segment parameters, decentration and tilt of intraocular lens in patients after phaco-vitrectomy. Semin Ophthalmol. 2021;36:88–93. doi:10.1080/08820538.2021.1884267
17. Moshirfar M, Basharat NF, Seitz TS, et al. Refractive changes after Nd:YAG capsulotomy in pseudophakic eyes. Clin Ophthalmol. 2023;17:135–143. doi:10.2147/OPTH.S395605
18. Erickson P. Effects of intraocular lens position errors on postoperative refractive error. J Cataract Refract Surg. 1990;16:305–311. doi:10.1016/S0886-3350(13)80699-2
19. Weikert MP, Golla A, Wang L. Astigmatism induced by intraocular lens tilt evaluated via ray tracing. J Cataract Refract Surg. 2018;44:745–749. doi:10.1016/j.jcrs.2018.04.035
20. Atchison DA, Cooke DL. Refractive errors occurring with tilt of intraocular lenses. Ophthalmic Physiol Opt. 2024;44:177–181. doi:10.1111/opo.13249
21. Reading VM. Astigmatism following cataract surgery. Br J Ophthalmol. 1984;68:97–104. doi:10.1136/bjo.68.2.97
22. Sheard RM, Smith GT, Cooke DL. Improving the prediction accuracy of the SRK/T formula: the T2 formula. J Cataract Refract Surg. 2010;36:1829–1834. doi:10.1016/j.jcrs.2010.05.031
23. Voytsekhivskyy OV. Accuracy of the VRF and VRF-G intraocular lens power calculation formulas using swept-source optical coherence tomography biometry. Clin Ophthalmol. 2023;17:3663–3672. doi:10.2147/OPTH.S439287
24. Tañá-Rivero P, Tello-Elordi C, Orts-Vila P, Tañá-Sanz P, Tañá-Sanz S. Agreement of corneal diameter and anterior chamber depth measurements with the IOLMaster 500 and the IOLMaster 700 optical biometers in myopic eyes. Clin Ophthalmol. 2023;17:1245–1253. doi:10.2147/OPTH.S409132
25. Thibos LN, Wheeler W, Horner D. Power vectors: an application of Fourier analysis to the description and statistical analysis of refractive error. Optom Vis Sci. 1997;74:367–375. doi:10.1097/00006324-199706000-00019
26. Thibos LN, Horner D. Power vector analysis of the optical outcome of refractive surgery. J Cataract Refract Surg. 2001;27:80–85. doi:10.1016/S0886-3350(00)00797-5
27. Alpins N. Astigmatism analysis by the Alpins method. J Cataract Refract Surg. 2001;27:31–49. doi:10.1016/S0886-3350(00)00798-7
28. Patel S, Tutchenko L, Voytsekhivskyy O. An evaluation of unexpected refractive outcomes following toric IOL implantation for astigmatism: a sector subtraction graphical method for calculating the effective astigmatic correction. Arch Ukraine J Ophthalmol. 2016;2:55–62. doi:10.22141/2309-8147.4.2.2016.172810
29. Cohen J, Cohen P, West SG, et al. Applied Multiple Regression/Correlation Analysis for the Behavioral Sciences.
30. Praeger DL, Schneider HA. Corneal thickness measurements following intraocular lens implantation. Ophthalmic Surg. 1977;8:97–101.
31. Waltman SR, Cozean CH. The effect of phacoemulsification on the corneal endothelium. Ophthalmic Surg. 1979;10:31–33.
32. Jacob JS. Corneal thickness changes following cataract surgery: effect of lens implantation and sodium hyaluronate. Br J Ophthalmol. 1985;69:567–571. doi:10.1136/bjo.69.8.567
33. Toklu E, Altinisik M, Elbay A, Koytak A. Comparison of postoperative anterior segment changes associated with pars plana vitrectomy with and without vitreous base shaving. Int J Ophthalmol. 2020;13:1745–1752. doi:10.18240/ijo.2020.11.10
34. Ciorba AL, Teusdea A, Roiu G, Cavalu DS. Particularities of cataract surgery in elderly patients: corneal structure and endothelial morphological changes after phacoemulsification. Geriatrics. 2024;9:77.
35. Tekcan H, Imamoğlu S, Mangan MS. Anterior segment changes and refractive outcomes after cataract surgery combined with gonioscopy-assisted transluminal trabeculotomy in open-angle glaucoma. Turk J Ophthalmol. 2023;53:369–376.
36. Hwang HS, Ahn YS, Cho YK. Preoperative mannitolization can decrease corneal endothelial cell damage after cataract surgery. Curr Eye Res. 2016;41:1161–1165. doi:10.3109/02713683.2015.1101138
37. De Bernardo M, Salerno G, Cornetta P, Rosa N. Axial length shortening after cataract surgery: new approach to solve the question. Transl Vis Sci Technol. 2018;7:34. PMID: 30619654; PMCID: PMC6314107.#. doi:10.1167/tvst.7.6.34
38. Xiao Z, Wang G, Zhen M, Zhao Z. Stability of intraocular lens with different design: a swept-source optical coherence tomography study. Front Med. 2021;8:705873. PMID: 34568368; PMCID: PMC8455909. doi:10.3389/fmed.2021.705873
39. Schartmüller D, Schwarzenbacher L, Meyer EL, Schriefl S, Leydolt C, Menapace R. Comparison of long-term rotational stability of three commonly implanted intraocular lenses. Am J Ophthalmol. 2020;220:72–81. doi:10.1016/j.ajo.2020.07.019
40. Klijn S, Sicam VA, Reus NJ. Long-term changes in intraocular lens position and corneal curvature after cataract surgery and their effect on refraction. J Cataract Refract Surg. 2016;42:35–43. doi:10.1016/j.jcrs.2015.08.015
41. Muzyka-Woźniak M, Ogar A. Anterior chamber depth and iris and lens position before and after phacoemulsification in eyes with a short or long axial length. J Cataract Refract Surg. 2016;42:563–568. doi:10.1016/j.jcrs.2015.12.050
42. Ning X, Yang Y, Yan H, Zhang J. Anterior chamber depth - a predictor of refractive outcomes after age-related cataract surgery. BMC Ophthalmol. 2019;19:134. doi:10.1186/s12886-019-1144-8
43. Macías-Murelaga B, Garay-Aramburu G, Bergado-Mijangos R, et al. Prediction error stabilization and long-term standard results with a monofocal intraocular lens. Vision. 2022;6:5. doi:10.3390/vision6010005
44. Goggin M, LaHood BR, Roggia MF, Chen TS, Beheregaray S, Esterman A. Leftover astigmatism: the missing link between measured and calculated posterior corneal astigmatism. J Refract Surg. 2022;38:559–564. doi:10.3928/1081597X-20220623-02
45. Jennings JAM, Charman WN. A comparison of errors in some methods of subjective refraction. Ophthalmic Optician. 1973;13(8):11–18.
46. Rosenfield M, Chiu NN. Repeatability of subjective and objective refraction. Optom Vis Sci. 1995;8:577–579.
47. Bullimore MA, Fusaro RE, Adams CW. The repeatability of automated and clinician refraction. Optom Vis Sci. 1998;75:617–622. doi:10.1097/00006324-199808000-00028
48. Raasch TW, Schechtman KB, Davis LJ, Zadnik K; CLEK Study Group. Repeatability of subjective refraction in myopic and keratoconic subjects: results of vector analysis. Ophthalmic Physiol Opt. 2001;21:376–383. doi:10.1046/j.1475-1313.2001.00596.x
49. Leinonen J, Laakkonen E, Laatikainen L. Repeatability (test-retest variability) of refractive error measurement in a clinical settings’. Acta Ophthalmol. 2006;84:532–536. doi:10.1111/j.1600-0420.2006.00695.x
50. Pocock SJ. Clinical Trials: A Practical Approach.
51. Hu J, Zhang WP, Cao DM, Lei Q. Research progress on prediction of postoperative intraocular lens position. Indian J Ophthalmol. 2024;72:S176–S182. doi:10.4103/IJO.IJO_1839_23
 © 2024 The Author(s). This work is published and licensed by Dove Medical Press Limited. The
full terms of this license are available at https://www.dovepress.com/terms.php
and incorporate the Creative Commons Attribution
- Non Commercial (unported, 3.0) License.
By accessing the work you hereby accept the Terms. Non-commercial uses of the work are permitted
without any further permission from Dove Medical Press Limited, provided the work is properly
attributed. For permission for commercial use of this work, please see paragraphs 4.2 and 5 of our Terms.
© 2024 The Author(s). This work is published and licensed by Dove Medical Press Limited. The
full terms of this license are available at https://www.dovepress.com/terms.php
and incorporate the Creative Commons Attribution
- Non Commercial (unported, 3.0) License.
By accessing the work you hereby accept the Terms. Non-commercial uses of the work are permitted
without any further permission from Dove Medical Press Limited, provided the work is properly
attributed. For permission for commercial use of this work, please see paragraphs 4.2 and 5 of our Terms.