")
Back to Journals » Nature and Science of Sleep » Volume 17
Gait Characteristics and Neuroanatomical Alterations in Obstructive Sleep Apnea–Hypopnea Syndrome
Authors Jiang J , Mo Y, Abuduwaili Z, Mao C, Fang S, Ke Z, Hu Z, Huang L, Xu S, Yang D, Xiong R, Xie P, Zhu X , Xu Y
Received 22 October 2024
Accepted for publication 1 April 2025
Published 22 April 2025 Volume 2025:17 Pages 631—647
DOI https://doi.org/10.2147/NSS.S502204
Checked for plagiarism Yes
Review by Single anonymous peer review
Peer reviewer comments 2
Editor who approved publication: Prof. Dr. Ahmed BaHammam
Jialiu Jiang,1,* Yuting Mo,1– 3,* Zulalai Abuduwaili,1 Chenglu Mao,1 Shuang Fang,4 Zhihong Ke,4 Zheqi Hu,1 Lili Huang,1 Shuai Xu,1 Dan Yang,4 Ruozhu Xiong,4 Pei Xie,4 Xiaolei Zhu,1– 5 Yun Xu1– 5
1Department of Neurology, Nanjing Drum Tower Hospital, Affiliated Hospital of Medical School, Nanjing University, Nanjing, 210008, People’s Republic of China; 2Jiangsu Key Laboratory for Molecular Medicine, Medical School of Nanjing University, Nanjing, 210008, People’s Republic of China; 3Nanjing Neurology Clinical Medical Centre, and Centre for Central Nervous Disease and Neurocience, Nanjing, 210008, People’s Republic of China; 4Department of Neurology, Nanjing Drum Tower Hospital, Clinical College of Nanjing Medical University, Nanjing, 210008, People’s Republic of China; 5State Key Laboratory of Pharmaceutical Biotechnology and Institute of Translational Medicine for Brain Critical Diseases, Nanjing University, Nanjing, 210008, People’s Republic of China
*These authors contributed equally to this work
Correspondence: Xiaolei Zhu, Department of Neurology, Nanjing Drum Tower Hospital, Affiliated Hospital of Medical School, Nanjing University, Nanjing, 210008, People’s Republic of China, Email [email protected] Yun Xu, Department of Neurology, Nanjing Drum Tower Hospital, Affiliated Hospital of Medical School, Nanjing University, Nanjing, 210008, People’s Republic of China, Email [email protected]
Background: Obstructive sleep apnea–hypopnea syndrome (OSAHS) affects over 936 million adults globally. Recently, it has been found to contribute to gait disorders, but there is limited information regarding how various indicators of OSAHS affect gait patterns.
Methods: A total of 136 subjects recruited from Nanjing Drum Tower Hospital were categorized based on apnea hypopnea index (AHI) and oxygen saturation (SpO2), respectively. All subjects underwent data collection regarding demographics, gait testing, sleep monitoring, multimodal magnetic resonance imaging (MRI), and a battery of clinical evaluations.
Results: Subjects with elevated AHI exhibited increased step width and decreased stride length in comparison to those with lower AHI. The nm (no or mild)-hypoxemia group demonstrated faster stride frequency than the ms (moderate to severe)-hypoxemia group. High-frequency obstructive sleep apnea–hypopnea resulted in cortical atrophy of the orbital part of right inferior frontal gyrus and upregulation of functional connectivity between the basal ganglia and left inferior temporal gyrus, basal ganglia and left insula, while the severity of hypoxemia led to functional alternations between right angular gyrus and left gyrus rectus, which manifested as respective alternations in gait. The area under the curve (AUC) for gait tests evaluating moderate-to-severe OSAHS was 0.842, using logistic regression models.
Conclusion: The frequency of respiratory events and the severity of hypoxemia caused different gait dysfunction and corresponding underlying mechanisms in patients with OSAHS. Gait testing might be a potential tool for rapidly screening OSAHS in the population.
Keywords: obstructive sleep apnea–hypopnea syndrome, gait, hypoxemia, magnetic resonance imaging
Introduction
Obstructive sleep apnea–hypopnea syndrome (OSAHS) is a prevalent sleep disorder characterized by complete or partial collapse of the upper airways, represented by apneas (complete cessation of airflow) and hypopneas (partial reduction in airflow).1 OSAHS, which can lead to the exacerbation of cardiovascular, metabolic, neurocognitive and other health issues, affects over 936 million adults aged 30–69 years worldwide.2,3 Numerous studies suggest that sleep disturbance and intermittent hypoxia in OSAHS have a detrimental impact on the central nervous system,4,5 such as the atrophy of fronto-parietal cortices and hippocampus.6 The severity of OSAHS is generally assessed based on apnea hypopnea index (AHI), which is evaluated by polysomnography (PSG) or out-of-center sleep testing (OCST).1 Some have argued that relying solely on AHI is insufficient for a comprehensive assessment of its pathophysiological consequences.7 AHI reflects only the frequency of sleep apnea–hypopnea, which may hardly capture the severity of hypoxemia. The frequency of respiratory events and the severity of hypoxemia may exert distinct effects on the brain,8,9 which has been underestimated thus far. Hypoxic burden, a novel metric based on the area, provides a more comprehensive characterization of the depth and duration of individual oxygen desaturation events.10 Nevertheless, technical challenges exist in calculating this metric. According to Chinese guidelines,11 both AHI and the nadir of oxygen saturation during sleep (SpO2 nadir) should be utilized to assess the condition of OSAHS. Consequently, this study employed AHI and SpO2 nadir as index to evaluate the severity of OSAHS and hypoxemia.
Falls have been the second leading cause of death among the elderly worldwide.12 Gait dysfunction may result in instability, falls, and a decline in functional independence. Gait was traditionally viewed as an automated motor task dependent on muscle control, visual acuity and the vestibular system.13,14 Recently, accumulating evidence demonstrates that gait is a cognitively-demanding activity15–17 and emphasizes the importance of brain functional and structural integrity in gait control.18 It was found gait speed could predict cognitive decline over the next decade,19 suggesting that gait might be sensitive to alterations in the brain. Prior research proposed that individuals with OSAHS exhibited gait dysfunction,14,20 but there has been limited focus on how various indicators of OSAHS affect gait and the underlying neuroimaging mechanisms.
Additionally, due to the high prevalence and significant negative effects of OSAHS, it is necessary to screen for OSAHS in the population. However, the diagnosis of OSAHS relies on sleep monitoring. Sleep monitoring requires professional equipment, long inspection time, and complex medical technology, which limits its promotion among the population. Several studies have investigated alternative approaches for the fast screening of OSAHS, including standardized questionnaires, measurement of SpO2, and ECG analysis. Gait indicators are low-cost, noninvasive, and easily accessible digital biomarkers with significant individual characteristics, can be assessed through one-minute gait tests. Conducting gait analysis is easier compared to gathering metrics for OSAHS through overnight sleep monitoring. It is demonstrated that gait indicators can recognize Alzheimer’s disease and Parkinson’s disease.21,22 Gait tests may serve as a promising avenue for screening OSAHS in the population.
Therefore, we focused on the gait performance in OSAHS, aiming to (1) determine whether OSAHS and hypoxemia exert distinct effects on gait and identify specific gait indicators associated with these conditions; (2) explore the underlying neuroimaging mechanism of OSAHS affecting gait; and (3) identify the diagnostic ability of gait tests for OSAHS.
Methods
Subjects
This study was a cross-sectional study, involving 136 subjects (25 healthy people and 111 patients with OSAHS) who were recruited from Nanjing Drum Tower Hospital between 2021 and 2024. The study was approved by the Ethics Committee of Nanjing Drum Tower Hospital (Ethics Approval No: 2023–327-02) and conducted according to the Declaration of Helsinki principles. Written informed consent was obtained from all subjects. All subjects underwent demographic data collection, gait testing, OCST, multimodal magnetic resonance imaging (MRI), and clinical assessments.
The inclusion criteria for OSAHS subjects were as follows: (1) age ≥40 years and ≤85 years; (2) right-handedness; (3) ability to cooperate with all inspection tasks, and (4) mild to severe OSAHS (AHI ≥ 5 events/h). People without OSAHS matched for age served as healthy subjects. The exclusion criteria for subjects were as follows: (1) other sleep-related disorders, such as narcolepsy or central sleep apnea; (2) any medical condition considered to interfere with gait, such as limb weakness, orthopedic, rheumatologic, or other diseases; (3) other neurological and psychiatric diseases, such as Parkinson’s disease, epilepsy, or schizophrenia; (4) any conditions using pharmacotherapies that impact the central nervous system or mental status within the last 3 months; (5) serious physical illnesses, such as cancer; and (6) limited capacity to comply with the study protocol, such as being blind, deaf, or physically disabled.
The sample size was calculated using the statistical software G*Power version 3.1.9.7.23 An anticipated effect size of 0.95 was taken, with a significance level of 0.05 and a study power set at 80%. Based on these parameters, it is calculated that the minimum number of subjects required for each group is 19, resulting in a total sample size of at least 38 subjects. Our sample size satisfied these requirements.
OCST
The diagnosis of OSAHS was based on an overnight sleep study by OCST. The subjects underwent OCST using a portable PSG device (BMC PolyWatch YH-600B; BMC Medical Co. Ltd., Beijing, China) under the guidance of a trained sleep technician. This portable PSG device has been validated to be highly consistent with PSG.24 It consisted of an abdominal band, used to detect thoracic and abdominal excursion; a finger pulse oximetry, used to measure oxygen saturation; thermistors for nasal airflow, and body position and heart rate recordings. Before and after bedtime, the technician would conduct a video call to ensure proper usage of the device. According to international guidelines,1 the scoring was conducted using an automated algorithm that performs an initial analysis, followed by a review of the results by a trained sleep specialist who rectifies any possible mis-scorings produced by the computer program. The assessments conducted by the two specialists had a high consistency, with a kappa coefficient of 0.82.
According to the AASM guidelines,1 an apnea was defined as the complete cessation or a reduction of at least 90% of airflow for at least 10s. On the basis of the abdominal band signal and the shape of the respiratory pressure curve, apnea was defined as obstructive or other types. Hypopnea was defined as a reduction of at least 30% in the nasal pressure signal, accompanied by an oxygen desaturation of at least 3%. AHI was calculated as the sum of the mean number of apneas and hypopneas per hour. The lowest oxygen saturation level during sleep, referred to as the SpO2 nadir, was recorded. The oxygen desaturation index (ODI) was determined as the number of desaturations >3% divided by total sleep time. TS90 represented the percent of the total sleep time below 90% oxygen saturation. Patients with OSAHS were identified based on criteria including an AHI ≥ 5 events per hour and the presence of obstructive apneas. Hypoxemia was defined as having an SpO2 nadir at night of less than 90%.11
In addition, considering that sleep fragmentation in severe OSAHS patients and too short sleep duration make the results unreliable, we excluded subjects with total sleep time of fewer than 4 hours. The device is integrated with automated analysis software capable of evaluating the collected signals. When the signal is missing or poor quality, it will be marked as an artifact, which needs to be further confirmed by manual analysis to ensure the accuracy of the diagnostic results. Following a data quality assessment, periods of invalid recording such as equipment malfunction, poor signal quality, and disconnects were removed. The technically effective recording time for each subject is at least 4 hours. The classification criteria for OSAHS were as follows: mild OSAHS: AHI ≥5 times per hour and <15 times per hour; moderate OSAHS: AHI ≥15 times per hour and <30 times per hour; and severe OSAHS: AHI ≥30 times per hour. AHI of less than 5 times per hour was defined as not having OSAHS. The classification criteria11 for hypoxemia were as follows: mild hypoxemia: SpO2 nadir <90% and ≥85%; moderate hypoxemia: SpO2 nadir <85% and ≥80%; and severe hypoxemia: SpO2 nadir <80%. SpO2 nadir of more than 90% was defined as not having hypoxemia. Based on the Chinese national guideline classification standard11 and their clinical significance, we categorized the subjects into two groups based on their AHI and SpO2 nadir, utilizing thresholds of 15 and 85, respectively. According to AHI, the subjects were categorized into two groups: the nm-OSAHS group (no or mild OSAHS, AHI < 15 events per hour) and the ms-OSAHS group (moderate or severe OSAHS, AHI ≥ 15 events per hour). On the basis of their SpO2 nadir, the subjects were categorized into two groups: the nm-hypoxemia group (no or mild hypoxemia, SpO2 nadir ≥ 85%) and the ms-hypoxemia group (moderate or severe hypoxemia, SpO2 nadir < 85%).
Gait Tests
A three-dimensional motion balance testing system (ReadyGo, Beijing CAS‐Ruiyi Information Technology Co., Ltd).25–29 was utilized to conduct gait testing. The system uses a unified camera setup, comprising an RGB camera and a depth camera. Notably, the system’s compact design, occupying less than 1 m², obviates the need for a dedicated testing room, as it operates efficiently within a 1 × 5 m² area directly in front of the camera, free from obstructions. This device is capable of both observing and estimating 3D joints and landmarks through advanced visual perception, uniquely tracking multiple skeletons without requiring subjects to wear any sensors. In our study, subjects were instructed to walk at their customary pace on a level surface defined by two rectangles measuring 3 meters in length and 0.5 meters in width, while making turns within the rectangle. They wore comfortable footwear and did not use any assistive walking devices. Individuals with any medical conditions considered to affect gait, such as limb weakness, orthopedic disorders, rheumatologic conditions, or other relevant diseases, were excluded.
Artificial intelligence in the ReadyGo three-dimensional motion balance testing system and manual correction were utilized to annotate actions such as lifting, landing, swinging, standing and turning during walking. The ReadyGo system also automatically calculates gait indicators temporally, spatially, and spatiotemporally. The gait indicators included gait velocity, stride length, step height, step width, stride frequency, stance phase, swing phase, and double-support time, with their maximum, minimum and median presented. This system has received approval from China’s National Medical Device Registration Certificate (ID: 20242109713) and was extensively utilized in scientific studies, indicating excellent internal and external consistency.25–29
Demographic Data Collection
Through face-to-face interviews, subjects reported their information including gender, age, level of education, body mass index (BMI) and vascular risk factors. The vascular risk factors included hypertension, diabetes, hyperlipidemia, smoking and drinking.
Neuropsychological Evaluation
Each subject underwent a neuropsychological evaluation conducted by a trained neurologist. The mental state of subjects was assessed according to the Hamilton Depression Scale (HAMD), and the Hamilton Anxiety Scale (HAMA). Overall cognitive function was evaluated using the Mini-Mental State Examination (MMSE) and the Montreal Cognitive Assessment (MoCA).
Multimodal MRI Data Acquisition
The subjects underwent multimodal MRI scanning, including high-resolution T1-weighted turbo gradient echo sequence, blood oxygen level-dependent resting-state functional magnetic resonance imaging sequence (BOLD), T2-weighted fluid attenuated inversion recovery (FLAIR) sequence, T2-weighted imaging (SWI), magnetic resonance angiography (MRA) and diffusion-weighted imaging (DWI) at Nanjing Drum Tower Hospital using a Philips 3.0-T scanner (Philips Medical Systems, Andover, MA, USA). Subjects were instructed to remain awake, stay still in a relaxed manner, and avoid moving their head. The image processing involved the high-resolution T1-weighted turbo gradient echo sequence, BOLD, and T2-weighted FLAIR sequences.
Scanning parameters for the high-resolution T1-weighted turbo gradient echo sequence were as follows: repetition time (TR) of 8.2 ms, echo time (TE) of 3.8 ms, flip angle (FA) of 8°, slice number of 192, acquisition matrix size of 256 × 256, and layer thickness of 1.0 mm. For T2-weighted FLAIR sequence scanning, the parameters comprised a TR value of 4500 ms, TE value of 333 ms, inversion time (TI) of 1600 ms, slice number set at 200 with voxel size measuring 0.95 mm × 0.95 mm × 0.95 mm and an acquisition matrix size equal to 270 × 260.
MRI Data Processing
Structural Analysis
Lacunes and cerebral microbleeds were assessed based on multimodal MRI by two trained investigators.30 The lesion segmentation tool (LST), a toolbox based on the statistical parametric mapping software package (SPM; www.fil.ion.ucl.ac.uk/spm) 12, was utilized to quantify white matter lesions. This involved analyzing T2-weighted FLAIR sequences and high-resolution T1-weighted turbo gradient echo sequences with specific parameters: an initial threshold of 0.15, a Markov random field parameter of 1, and a maximum number of iterations of 50. The output from the LST provided measurements of white matter hyperintensity (WMH) volume. To assess white matter, we employed the voxel-based morphometry toolbox for SPM8 (VBM8), another toolbox based on SPM8. Total intracranial volume (TIV) was calculated by summing up the volumes of gray matter, white matter, and cerebrospinal fluid.
The Voxel-based Morphometry Toolbox for SPM8 (VBM8), which operates on the SPM8 platform, was utilized to analyze cerebral gray matter volume using high-resolution T1-weighted turbo gradient echo sequences. The processing steps included 1) cropping; 2) reorientation; 3) segmentation and normalization; and 4) applying an 8-mm FWHM Gaussian spatial kernel for image smoothing. The region exhibiting significant differences in a two-sample t-test (multiple comparison corrections: Gaussian random field (GRF)-corrected threshold of p < 0.001 at the voxel level and p < 0.05 at the cluster level) was extracted using Data Processing & Analysis for Brain Imaging (DPABI).31
Functional Analysis
The fMRI analysis was based on the BOLD sequence. DPARSF, a toolbox based on the Resting-State Functional MR Imaging Toolkit (http://www.restfmri.net) and SPM12 was used for fMRI data analysis. The preprocessing steps included removing the first ten volumes of data, slice timing correction, realignment (note that those with head motion greater than 3.0 mm in any direction or rotation exceeding 3.0 degrees in any angular dimension were excluded), reorientation, co-registration of T1 images to functional images; image segmentation for the high-resolution T1-weighted turbo gradient echo sequence and the BOLD sequence by DARTEL, nuisance covariates regression (including linear detrending, Friston 24 head motion parameters, white matter signal, cerebrospinal fluid signal, and global signal), normalization using a 12-parameter nonlinear transformation to the standard Montreal Neurological Institute (MNI) space (3 × 3 × 3 mm3), smoothing functional images with a 6-mm FWHM Gaussian spatial kernel, and band-pass filtering (0.01–0.08Hz).
According to previous studies, bilateral angular gyrus (Anatomical Automatic Labeling (AAL) 65, AAL66), bilateral caudate nucleus (AAL71, AAL72), bilateral lenticular nucleus, putamen (AAL73, AAL74), bilateral lenticular nucleus, pallidum (AAL75, AAL76), bilateral thalamus (AAL77, AAL78) were set as regions of interest (ROIs) in functional connectivity (FC) analysis. The mean time series of the ROI was extracted, and the strengths of FC were calculated as Pearson’s correlations between the averaged time series of the ROI and voxels in the remaining brain regions. Then, Pearson’s correlation coefficients were normalized to a z-score matrix by using a Fisher r-to-z transformation, and the FC map was created between the ROI and the remaining brain regions. The region exhibiting significant differences in a two-sample t-test (multiple comparison corrections: GRF-corrected threshold of p < 0.001 at the voxel level and p < 0.05 at the cluster level) was extracted using Data Processing & Analysis for Brain Imaging (DPABI).31
Quality Control Procedures
To ensure the integrity and reliability of our data, we implemented a series of quality control procedures. During the data collection phase, all data were gathered by trained investigators who had completed rigorous training programs. Regular calibration of measurement instruments was conducted by engineers to maintain accuracy. During the data entry phase, data were entered into a secure database by a data entry investigator and subsequently checked by another independent researcher. In the data analysis phase, we conducted multiple checks for outliers and missing values. Subjects with missing data for key OSAHS metrics, such as AHI and SpO2 nadir, or demographic information were excluded from the analysis. For gait indicators exhibiting extreme values, defined as those exceeding three standard deviations from the mean, we substituted the median value to mitigate the influence of outliers.
Statistical Analysis
Statistical analyses were performed via SPSS 27.0 (IBM SPSS Statistics for Windows, Armonk, NY, USA) and R version 4.4.2 (RStudio, Boston, MA). For continuous variables, the normality of the distribution was confirmed using the P–P plot before comparison. Continuous variables that were normally distributed were compared using an independent sample t-test. Continuous variables not conforming to a normal distribution were compared using the Mann–Whitney U-test. The chi-square test was used to compare categorical variables. Spearman correlation was employed to conduct correlation analysis. Crude and adjusted ordinal regression models were applied to assess the relationship between OSAHS metrics and gait indicators. The median values of gait indicators from both the left and right sides were combined to facilitate correlation analysis and ordinal logistic regression analysis. A logistic regression model including gait indicators and other factors was developed to predict the severity of OSAHS. Eighty percent of the subjects were randomly selected for the training set and 20% for the validation set. A value of p < 0.05 was considered statistically significant.
Results
Clinical Assessments
A total of 136 subjects were recruited for this study. The mean age of the subjects was 67.3 years, comprising 81 female and 55 male subjects. The average duration of education was 12 years. Based on AHI, there were 68 subjects in the nm-OSAHS group (AHI < 15) and 68 subjects in the ms-OSAHS group (AHI ≥ 15). There was a significant difference in BMI and hypertension prevalence between the two groups, but no significant differences were found in age, education or other vascular risk factors (p > 0.05). There were no marked differences between the two groups in neuropsychological tests. Significant differences were found in multiple OSAHS metrics. In the ms-OSAHS group, AHI (p < 0.001), TS90 (p < 0.001) and ODI (p < 0.001) were all significantly higher than those in the nm-OSAHS group. SpO2 nadir (p < 0.001) and mean nocturnal SpO2 (p = 0.003) in the ms-OSAHS group were significantly lower than those in the nm-OSAHS group.
To further explore the effect of the severity of nocturnal hypoxia on gait, we divided the subjects based on the SpO2 nadir. There were 67 subjects in the nm-hypoxemia category (SpO2 nadir ≥ 85%) and 69 subjects in the ms-hypoxemia category (SpO2 nadir < 85%). The two groups differed significantly in BMI and hypertension incidence. No significant differences were observed in other demographic data or neuropsychological tests. In terms of OSAHS metrics, the ms-hypoxemia group exhibited high scores in AHI (p < 0.001), TS90 (p < 0.001) and ODI (p < 0.001) and lower scores in SpO2 nadir (p < 0.001) and mean nocturnal SpO2 (p < 0.001), compared with the nm-hypoxemia group (detailed information is provided in Table 1).
 |
Table 1 Results of Clinical Assessments |
Gait Indicators
Gait indicators conforming to normal distribution were compared by independent sample t test. Mann–Whitney U-test was applied to analyze gait indicators that showed a skewed distribution. Step width of ms-OSAHS group was significantly wider than that of nm-OSAHS group (p < 0.01). Stride length-median-right presented shorter in the ms-OSAHS group compared with the nm-OSAHS group, though this difference did not reach statistical significance (p = 0.064). No statistically significant differences were found in other gait indicators. Next, gait indicators in the nm-hypoxemia group and the ms-hypoxemia group were compared, and patients with moderate-to-severe hypoxemia showed faster stride frequency (p < 0.05). No significant differences were found in other gait indicators (Table 2, detailed comparison of other gait indicators is provided in Supplementary Table 1).
 |
Table 2 Gait Indicators Between OSAHS and Hypoxemia Groups |
Correlation Analysis and Ordinal Regression Analysis
Spearman correlation was used to analyze the correlation between OSAHS metrics and gait indicators. However, no correlation coefficients were greater than 0.3 (Supplementary Table 2). To further investigate the relationship between OSAHS, hypoxemia and gait dysfunction, both crude and adjusted ordinal linear regression analysis were applied (Figure 1). Independent variables were AHI, SpO2 nadir, TS90, ODI and mean SpO2. Dependent variables included gait velocity, stride length-median, stride frequency-median, stance phase-median, swing phase-median, double-support time-median, step height and step width, all categorized into tertiles. Model 1 was adjusted for no covariates, and model 2 was adjusted for age, body mass index, sex, smoking, drinking, hypertension and diabetes, which were chosen based on potential bias referred to previous studies.32,33
 |
Figure 1 Ordinal logistic regression analysis for gait indicators divided into tertiles. Abbreviations: OSAHS, obstructive sleep apnea–hypopnea syndrome; OR, Odd ratio; CI, confidence interval; AHI, apnea–hypopnea index; SpO2, pulsed dioxygen saturation; TS90, the percent of the total sleep time below 90% oxygen saturation; ODI, oxygen desaturation index, defined as a drop in SpO2 > 3% for at least 10s; BMI, body mass index. Notes: Model 1 was adjusted for no variables. Model 2 was adjusted for age, body mass index, sex, smoking, drinking, hypertension and diabetes.(A) OR (95% CI) for higher gait velocity; (B) OR (95% CI) for higher stride length-median; (C) OR (95% CI) for higher stride frequency-median; (D) OR (95% CI) for higher stance phase-median; (E) OR (95% CI) for higher swing phase-median; (F) OR (95% CI) for higher double-support time-median; (G) OR (95% CI) for higher step height-median; (H) OR (95% CI) for higher step width-median. |
Our findings indicated that higher AHI negatively impacted gait velocity (OR 0.97, 95% CI 0.94–0.99) and stride length (OR 0.98, 95% CI 0.96–1.00), while it positively influenced step width (OR 1.03, 95% CI 1.01–1.05) (Figure 1A–H). The impact on gait velocity remained (OR 0.97, 95% CI 0.94–0.99) significant after accounting for covariates. Higher ODI significantly reduced gait velocity (OR 0.97, 95% CI 0.95–0.99), regardless of whether covariates were adjusted for (Figure 1A). In the ms-hypoxemia group, stride frequency is 1.06 times more likely to decrease with each 1% drop in SpO2 nadir (95% CI 1.00–1.13), after considering covariables (Figure 1C). In subjects with TS90 less than 1.2, a 1% rise in TS90 resulted in a 3.54 times higher likelihood of stride frequency improvement (95% CI 1.00–12.60), increasing to 6.90 times after covariate adjustment (95% CI 1.60–29.71) (Figure 1C). In subjects with BMI ≥ 25 kg/m2, the crude ORs of AHI for gait velocity, stride length, swing phase and stance phase were 0.97 (95% CI 0.94–1.00), 0.97 (95% CI 0.94–1.00), 1.03 (95% CI 1.00–1.06) and 0.97 (95% CI 0.95–1.00), respectively (Figure 1A–E). It was suggested that obesity was important factors affecting gait dysfunction, and it was necessary to restrict BMI in follow-up studies.
Prediction Model for the Severity of OSAHS
We performed a logistic regression analysis to examine the potential of gait indicators in predicting moderate-to-severe OSAHS. Independent variables were selected based on observed differences between the nm-OSAHS and ms-OSAHS groups, including stride length-median-right, step width-median, step width-maximum, step width-minimum, BMI and hypertension. The dependent variable was the OSAHS group, with a value of 0 assigned to cases with no or mild symptoms and a value of 1 to those with moderate or severe symptoms. The dataset was randomly divided, with 80% (n = 108) allocated to the training set and 20% (n = 28) to the validation set. A receiver operating characteristic (ROC) curve was subsequently generated to calculate the area under the curve (AUC). The training set yielded an AUC of 0.805 (95% CI: 0.723–0.887) (Figure 2), with a sensitivity of 0.685 and specificity of 0.833 (Table 3). The validation set demonstrated an AUC of 0.842 (95% CI: 0.680–1.000) (Figure 2), with both sensitivity and specificity at 0.857 (Table 3). These findings indicated that the logistic regression model possesses excellent ability in predicting moderate-to-severe OSAHS.
 |
Table 3 Stride Length, Step Width, BMI and Hypertension for Predicting Moderate to Severe OSAHS |
 |
Figure 2 ROC curve for the prediction of moderate to severe OSAHS The combination of stride length-median-right, step width-median, step width-maximum and step width-minimum, BMI and hypertension was used to determine moderate to severe OSAHS. The training set had an AUC of 0.805 (95% CI: 0.723–0.887), and the validation set had an AUC of 0.842 (95% CI: 0.680–1.000). Abbreviations: OSAHS, obstructive sleep apnea–hypopnea syndrome; BMI, body mass index; ROC, receiver operating characteristic. |
Neuroimaging Features of Lacunes, Cerebral Microbleeds, WMH Volume, White Matter Volume and Total Intracranial Volume
We assessed neuroimaging markers, including lacunes, cerebral microbleeds, WMH volume, total white matter volume, and total intracranial volume, in all subjects. No statistically significant differences were observed between the nm-OSAHS group and the ms-OSAHS group. Moreover, no differences in these parameters were detected between the nm-hypoxemia group and the ms-hypoxemia group (Table 4).
 |
Table 4 Neuroimaging Features of Lacunes, Cerebral Microbleeds, WMH Volume, White Matter Volume and Total Intracranial Volume |
Structural Analysis
In the whole-brain VBM analysis, significant gray matter loss of ORBinf.R (the right inferior frontal gyrus and orbital part) was observed in the ms-OSAHS group compared with the nm-OSAHS group (Figure 3A and B). Figure 3B displays the mean and standard error of the gray matter volume in ORBinf.R. A negative correlation was identified among the AHI (r = −0.383, p < 0.001), ODI (r = −0.412, p < 0.001), and the gray matter volume in the ORBinf.R (Supplementary Table 3). Spearman correlation analysis revealed no significant relationship between the gray matter volume of ORBinf.R and the gait indicators of stride length and step width in the ms-OSAHS group. Furthermore, no differences in cerebral gray matter volume were detected between the nm-hypoxemia group and the ms-hypoxemia group.
 |
Figure 3 Difference in structural analysis between nm-OSAHS and ms-OSAHS groups (A) The blue-shaded area was the brain region with significant difference in the structural analysis between the nm-OSAHS and ms-OSAHS groups: ORBinf.R (Montreal Neurological Institute coordinates of peak voxel: x = 40.5, y = 39, z = −9, cluster size: 4090 voxels; Gaussian-Random-Field-Correction for multiple comparisons: P<0.001 at voxel level, P<0.05 at cluster level).(B) The gray matter volume of ORBinf.R in the nm-OSAHS (0.409 ± 0.036) and ms-OSAHS (0.378 ± 0.030) groups was significantly differed. Abbreviations: ORBinf.R, the right inferior frontal gyrus, orbital part; nm-OSAHS, subjects with no or mild obstructive sleep apnea–hypopnea syndrome, apnea hypopnea index < 15 events per hour; ms-OSAHS, subjects with moderate-to-severe obstructive sleep apnea–hypopnea syndrome, apnea hypopnea index ≥ 15 events per hour. Note: ***p < 0.001. |
FC Analysis
The ms-OSAHS group presented increased FC between the left basal ganglia and left inferior temporal gyrus, the left pallidum and left insula, with this difference being statistically significant (GRF correction, voxel level P < 0.001, cluster level P < 0.05) (Figure 4A–D). AHI and ODI were positively associated with FC values between the left basal ganglia and left inferior temporal gyrus, the left pallidum and left insula (r > 0.3)(see Supplementary Table 3). Additionally, we observed increased FC between the right angular gyrus and left gyrus rectus in the ms-hypoxemia group compared with the nm-hypoxemia group (Figure 4A and E). FC between right angular gyrus and left gyrus rectus was positively correlated with the stride frequency-minimum-left (r = −0.303, p = 0.011) (Figure 5). A negative correlation between FC values of the right angular gyrus and the left gyrus rectus with SpO2 nadir was also identified (r = −0.321, p < 0.001) (Supplementary Table 3). There were no significant differences in FC existed between the other seed regions.
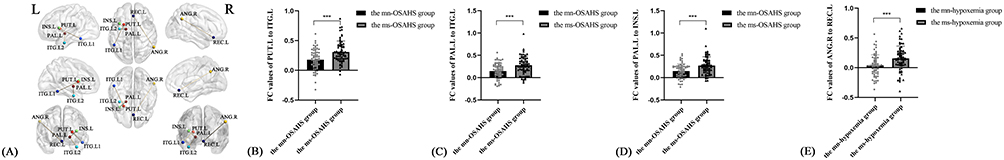 |
Figure 4 Functional connectivity and differences in FC values of PUT. L, PAL. L and ANG. (A)Compared to the nm-OSAHS group, the ms-OSAHS group demonstrated strengthened FC between PUT. L and ITG. L1 (Montreal Neurological Institute coordinates of peak voxel: x = −51, y = −48, z = −18, cluster size: 71 voxels; Gaussian-Random-Field-Correction for multiple comparisons: P<0.001 at voxel level, P<0.05 at cluster level), PAL. L and ITG. L2 (Montreal Neurological Institute coordinates of peak voxel: x = −36, y = −3, z = −30, cluster size: 86 voxels; Gaussian-Random-Field-Correction for multiple comparisons: P<0.001 at voxel level, P<0.05 at cluster level), PAL. L and INS. L(Montreal Neurological Institute coordinates of peak voxel: x = −36, y = 12, z = 12, cluster size: 102 voxels; Gaussian-Random-Field-Correction for multiple comparisons: P<0.001 at voxel level, P<0.05 at cluster level). Compared to the nm-hypoxemia group, the ms-hypoxemia group demonstrated strengthened FC between ANG. R and REC. L (Montreal Neurological Institute coordinates of peak voxel: x = 3, y = 33, z = −15, cluster size: 65 voxels; Gaussian-Random-Field-Correction for multiple comparisons: P<0.001 at voxel level, P<0.05 at cluster level).(B)The FC of PUT. L to ITG. L was significantly differed between the nm-OSAHS (0.178 ± 0.171) and the ms-OSAHS (0.309 ± 0.184) groups.(C)The FC of PAL. L to ITG. L was significantly differed between the the nm-OSAHS (0.149 ± 0.170) and the ms-OSAHS (0.278 ± 0.201) groups.(D)The FC of PAL. L to INS. L was significantly differed between the the nm-OSAHS (0.150 ± 0.161) and the ms-OSAHS (0.272 ± 0.197) groups.(E)The FC of ANG. R to REC. L was significantly differed between the the nm-hypoxemia group (0.038 ± 0.179) and the ms-hypoxemia (0.157 ± 0.206) groups. Abbreviations: FC, functional connectivity; PUT. L, the left lenticular nucleus, putamen; ITG. L, the left inferior temporal gyrus; PAL. L, the left lenticular nucleus, pallidum; INS. L, the left insula; ANG. R, the right angular gyrus; REC. L, the left gyrus rectus; nm-OSAHS, subjects with no or mild obstructive sleep apnea–hypopnea syndrome, apnea hypopnea index < 15 events per hour; ms-OSAHS, subjects with moderate-to-severe obstructive sleep apnea-hypnea syndrome, apnea hypopnea index ≥ 15 events per hour; nm-hypoxemia, subjects with no or mild hypoxemia, lowest oxygen saturation at night ≥ 85%; ms-hypoxemia, subjects with moderate-to-severe hypoxemia, lowest oxygen saturation at night < 85%. Note:***p < 0.001. |
 |
Figure 5 Correlation between stride frequency and FC of ANG. R to REC. L Spearman correlation analysis showed that FC of ANG. R to REC. L was negatively associated with stride frequency-minimum -left in the ms-hypoxemia group (r = −0.303, p = 0.011). Abbreviations: FC, functional connectivity; ANG. R, the right angular gyrus; REC. L, the left gyrus rectus; ms-hypoxemia, subjects with moderate-to-severe hypoxemia, lowest oxygen saturation at night < 85%. |
Discussion
In this study, we focused on gait characteristics and their underlying neuroimaging mechanisms in patients with OSAHS. This is the first study to demonstrate that AHI and SpO2 nadir correspond to different gait abnormalities in patients with OSAHS at the same cognitive level. High-frequency sleep apnea–hypopnea resulted in cortical atrophy of ORBinf.R and upregulation of FC between the basal ganglia and the left inferior temporal gyrus (ITG. L), basal ganglia and left insula (INS. L), whereas the severity of hypoxemia led to functional alternations between the right angular gyrus (ANG. R) and left gyrus rectus (REC. L), which manifested as respective alternations in gait. Furthermore, gait tests were able to evaluate the severity of AHI in OSAHS by logistic regression models. Our current findings contributed to a more comprehensive understanding of the impact of OSAHS on gait patterns and might provide an efficient method for OSAHS screening in the population.
Falls represent a primary cause of unintentional injuries, diminished quality of life, and reduced functional capacity among the elderly population.12 Recent evidence suggested that prevalent sleep disorders, especially OSAHS, may constitute a significant modifiable risk factor for falls.14 Considering the rising longevity of older adults and the prevalence of falls within this population, more needs to be done to reduce the risk of falls. Emerging research indicated that Continuous Positive Airway Pressure (CPAP) therapy for OSAHS might reduce the risk of falls in older adults.34,35 Two studies from the Outcomes of Sleep Disorders in Older Men cohort study identified hypoxemia, rather than AHI, was associated with an elevated risk of falls.36,37 It is crucial to further delineate the mechanisms by which OSAHS influences gait and balance, thereby providing more comprehensive guidance for fall prevention strategies. In our study, we observed that higher AHI was correlated with increased step width and reduced stride length. Patients with moderate-to-severe hypoxemia had faster stride frequency. This finding was further verified in ordinal logistic regression. Although the 95% confidence intervals did not reach statistical significance following the adjustment for covariates, such as BMI, this might be attributable to the significant role of BMI as a variable influencing both OSAHS and gait. Furthermore, ODI, TS90 and mean SpO2 nadir demonstrated associations with gait indicators. These metrics, however, capture only a singular dimension of hypoxemia, underscoring the necessity for employing more comprehensive measures, such as the hypoxemia burden, in future researches. The hypoxemia burden has been previously demonstrated to correlate with mortality outcomes.38
Baillieul et al proposed that patients with severe obstructive sleep apnea showed poor performance in step width.39 In static postural stability tests, OSAHS patients also showed increased mediolateral distance.40,41 However, previous studies did not consider cognitive differences between patients and controls. Cognition is an important factor affecting gait and was of great concern in our study. Ordinal logistic regression showed that AHI affected gait velocity, but no differences were found between nm-OSAHS and ms-OSAHS groups. This discrepancy might be attributed to the latter analysis accounting for cognitive function, which has been confirmed to be closely linked to gait velocity.42 Decreased stride length, increased step width and faster stride frequency might be compensatory stepping strategies to recover from a forward loss of balance.43–46
Gait is a reflection of brain function.15,47,48 Previous research proposed that different indicators of OSAHS might result in impairments of different cognitive dimensions49 and brain structures.9 Different alterations in gait may indicate different neuroimaging patterns in the brain. However, seldom does previous studies involve in underlying mechanisms of gait dysfunction caused by OSAHS. We took the lead in pinpointing gait-related neuroimaging features in patients with OSAHS. Respiratory events and hypoxemia exhibited different neuroimaging features. Structurally, high-frequency hypopnea and sleep apnea were more likely to cause cortical atrophy than hypoxemia was. Previous studies also reported cortical atrophy of the frontal lobe in patients with OSAHS.50,51 Reduced grey matter volume in the prefrontal regions led to changes in gait patterns.52 Functionally, high-frequency hypopnea and sleep apnea might cause behavioral modulation through the cortical–basal ganglia circuit, whereas hypoxemia may occur through altered functional interactions of the bilateral prefrontal cortex. The basal ganglia are important in motor control. Alexander reported that asymmetrical gait was evident in patients with injury to the putamen.53 The discharge patterns of neurons in the pallidum are well related to visually guided gait modifications.54 Gait is a product of senior cognitive processing, including cognitive control, attention and so on.55 We identified the ITG. L was closely associated with AHI-related gait dysfunction. The ITG. L is responsible for visual perception.56 It has been reported that spatiotemporal parameters (eg stride length) benefit from visual cues during walking.57,58 In a study of gait adaptation, perturbations of the visual field could reduce stride length and expand step width.59 Our previous study reported functional alteration in the left inferior temporal gyrus in subjects with Tinetti test scores <24.60 Thus, visual processing might play an important role in the impact of OSAHS on stride length and step width.
With regard to hypoxemia, we found that decreased consistency of neuronal activity between the bilateral prefrontal cortices might be responsible for the increased stride frequency. Prefrontal cortices were great important in senior cognitive processing. It was demonstrated that the angular gyrus was the key neuroimaging node of attention61,62 and spatial perception,63 which were essential for maintaining balance during walking. The ANG. R was also reported to be functionally engaged in gait and balance dysfunction.60 REC. L is a part of the prefrontal cortex. In a study of autism spectrum disorder, meta-analytic decoding of the left gyrus rectus annotated functional items related to social cognition.64 In our previous study, the thickness of the REC. L was directly proportional to gait performance, while no significant correlation was found.65 In subjects with ms-hypoxemia, the functional connectivity between the ANG. R and REC. L reduced and was significantly related to the stride frequency. We provided new evidence for the close association between ANG. R, REC. L and stride frequency. To summarize, we should fully consider the distinct gait and neuroimaging patterns of AHI and hypoxia in the diagnosis and treatment of OSAHS. Considering that CPAP therapy is only partially effective for OSAHS and its efficacy in improving gait dysfunction remains controversial,34,66 ORBinf.R, ITG. L, ANG. R and REC. L might serve as potential targets for neural modulation in the treatment of OSAHS.
Limitations
There remain certain limitations to this research. First, this study has a cross-sectional and single-center design, which limits the ability to infer causality. It remains unclear whether OSAHS precedes and contributes to neuroanatomical alterations and subsequent gait changes, or whether preexisting neuroanatomical vulnerabilities predispose individuals to OSAHS or exacerbate its progression. Similar to a previous study,67 we also observed a mismatch between neuroimaging findings and gait indicators, which is worth further exploration. In the future, we plan to expand the research to multi-center settings and conduct longitudinal follow-up, with periodic evaluations of neuroimaging and gait indicators over multiple years to track temporal changes. Additionally, randomized controlled trials evaluating CPAP therapy on neuroanatomical and gait outcomes could help clarify the causal relationship involved.
Second, the clinical implementation of Readygo, a novel gait assessment system, remains in its nascent phase, requiring further specific validation data and test–retest reliability. In future research, we will prioritize obtaining these data in similar populations. Gait assessments could involve two consecutive measurements, with repeat measurements conducted on the second day during similar time periods to enhance the robustness and generalizability of findings.
Third, we employed SpO2 nadir as a metric to evaluate hypoxemia severity, which represents a single point measurement that is susceptible to artifacts and neglects the frequency and duration of oxygen desaturation episodes. Future research should consider incorporating more comprehensive metrics of hypoxemia, such as hypoxic burden. Hypoxic burden better characterizes the overall pattern of oxygen desaturation and has been demonstrated to have significant implications for both cardiovascular38 and cognitive health.68
Finally, due to the limitation of sample size, we chose the GRF correction method in the neuroimaging analyses. Our current discovered brain regions are relatively large, and more stringent multiple comparison correction methods may contribute to focusing on the key neural nodes in OSAHS.
In conclusion, patients with obstructive sleep apnea–hypopnea and hypoxemia had different gait dysfunction and corresponding underlying mechanisms in OSAHS. Higher frequency respiratory events affected stride width and stride length, while reduced oxygen saturation levels influenced stride frequency. Our findings provided a rationale for further mechanistic researches and found that the gait test might serve as a screening tool for OSAHS, thereby contributing to the overall enhancement of public health.
Data Sharing Statement
The data that support the findings of this study are available from the corresponding author upon reasonable request.
Ethics Approval Statement
This study was conducted according to the Declaration of Helsinki principles. Ethical approval for this study was obtained from the Ethics Committee of Nanjing Drum Tower Hospital (Ethics Approval No: 2023-327-02).
Acknowledgments
This research was supported by the National Natural Science Foundation of China (82130036), the STI2030-Major Projects (2022ZD0211800), and Jiangsu Province Key Medical Discipline (ZDXK202216). We thank all the medical workers and all subjects participated in this study for their contributions.
An unauthorized version of the Chinese MMSE was used by the study team without permission, however this has now been rectified with PAR. The MMSE is a copyrighted instrument and may not be used or reproduced in whole or in part, in any form or language, or by any means without written permission of PAR (www.parinc.com).
Author Contributions
Jialiu Jiang: conceptualization, data curation, investigation, methodology, formal analysis, writing – review and editing, writing – original draft; Yuting Mo: conceptualization, software, investigation, data curation, formal analysis, methodology, writing – review and editing, supervision; Zulalai Abuduwaili: writing – original draft, investigation; Chenglu Mao: data curation, writing – review and editing, investigation; Shuang Fang: data curation, investigation, writing – original draft; Zhihong Ke, investigation, writing – original draft; Zheqi Hu: investigation, writing – original draft; Lili Huang: investigation, writing – original draft; Shuai Xu: investigation, writing – original draft; Dan Yang: investigation, writing – original draft; Ruozhu Xiong: investigation, writing – original draft; Pei Xie: investigation, writing – original draft; Xiaolei Zhu: writing – review and editing, supervision; Yun Xu: resources, writing – review and editing, funding acquisition, supervision.
All authors made a significant contribution to the work reported, whether that is in the conception, study design, execution, acquisition of data, analysis and interpretation, or in all these areas; took part in drafting, revising or critically reviewing the article; gave final approval of the version to be published; have agreed on the journal to which the article has been submitted; and agree to be accountable for all aspects of the work.
Funding
This research was supported by the National Natural Science Foundation of China (82130036), the STI2030-Major Projects (2022ZD0211800), and Jiangsu Province Key Medical Discipline (ZDXK202216).
Disclosure
On behalf of all authors, the corresponding author states that there is no conflict of interest.
References
1. American Academy of Sleep Medicine. AASM Manual for the Scoring of Sleep and Associated Events: Rules, Terminology and Technical Specifications, Version 3. Chicago, IL: American Academy of Sleep Medicine; 2023.
2. Benjafield AV, Ayas NT, Eastwood PR, et al. Estimation of the global prevalence and burden of obstructive sleep apnoea: a literature-based analysis. The Lancet Respiratory Medicine. 2019;7(8):687–698. doi:10.1016/S2213-2600(19)30198-5
3. Meher A, Fatima SA, Rastogi S, Churi KP, Suresh V. The hidden impact of sleep disorders in the post-pandemic world. AN. 2024;4(1):11. doi:10.36922/an.4006
4. Mullins AE, Kam K, Parekh A, Bubu OM, Osorio RS, Varga AW. Obstructive sleep apnea and its treatment in aging: effects on alzheimer’s disease biomarkers, cognition, brain structure and neurophysiology. Neurobiol Dis. 2020;145:105054. doi:10.1016/j.nbd.2020.105054
5. Sanders CB, Knisely K, Edrissi C, et al. Obstructive sleep apnea and stroke severity: impact of clinical risk factors. Brain Circulation. 2021;7(2):92–103. doi:10.4103/bc.bc_57_20
6. Canessa N, Castronovo V, Cappa SF, et al. Obstructive sleep apnea: brain structural changes and neurocognitive function before and after treatment. Am J Respir Crit Care Med. 2011;183(10):1419–1426. doi:10.1164/rccm.201005-0693OC
7. Asghari A, Mohammadi F. Is apnea-hypopnea index a proper measure for obstructive sleep apnea severity? Med J Islam Repub Iran. 2013;27(3):161–162.
8. Malhotra A, Ayappa I, Ayas N, et al. Metrics of sleep apnea severity: beyond the apnea-hypopnea index. Sleep. 2021;44(7):zsab030. doi:10.1093/sleep/zsab030
9. Wang J, Li Y, Ji L, et al. The complex interplay of hypoxia and sleep disturbance in gray matter structure alterations in obstructive sleep apnea patients. Front Aging Neurosci. 2023;15:1090547. doi:10.3389/fnagi.2023.1090547
10. Parekh A. Hypoxic burden - definitions, pathophysiological concepts, methods of evaluation, and clinical relevance. Curr Opin Pulm Med. 2024;30(6):600–606. doi:10.1097/MCP.0000000000001122
11. Chinese medical doctor association sleep medicine professional committee. multidisciplinary treatment guidelines for adults with obstructive sleep apnea. National Medical Journal of China. 2018;98(24):1902–1914. doi:10.3760/cma.j.issn.0376-2491.2018.24.003
12. Zhu H, Hu K, Liu S, Kim HC, Wang Y, Xue Q. Systematic causality mapping of factors leading to accidental falls of older adults. Public Health Pract. 2020;1:100045. doi:10.1016/j.puhip.2020.100045
13. Lewis K, Sun M, Joyner B, Munkasy B, Li L. Impact of foot sole insensitivity and reduced nerve conduction velocity on postural control and functional gait. AN. 2024;3(2):2900. doi:10.36922/an.2900
14. Stevens D, Jackson B, Carberry J, et al. The impact of obstructive sleep apnea on balance, gait, and falls risk: a narrative review of the literature. The Journals of Gerontology: Series A. 2020;75(12):2450–2460. doi:10.1093/gerona/glaa014
15. Takakusaki K. Functional neuroanatomy for posture and gait control. J Mov Disord. 2017;10(1):1–17. doi:10.14802/jmd.16062
16. Yogev-Seligmann G, Hausdorff JM, Giladi N. The role of executive function and attention in gait. Mov Disord. 2008;23(3):329–342. doi:10.1002/mds.21720
17. Amboni M, Barone P, Hausdorff JM. Cognitive contributions to gait and falls: evidence and implications. Mov Disord. 2013;28(11):1520–1533. doi:10.1002/mds.25674
18. Lo OY, Halko MA, Zhou J, Harrison R, Lipsitz LA, Manor B. Gait speed and gait variability are associated with different functional brain networks. Front Aging Neurosci. 2017;9:390. doi:10.3389/fnagi.2017.00390
19. Chou MY, Nishita Y, Nakagawa T, et al. Role of gait speed and grip strength in predicting 10-year cognitive decline among community-dwelling older people. BMC Geriatr. 2019;19(1):186. doi:10.1186/s12877-019-1199-7
20. Allali G, Perrig S, Cleusix M, et al. Gait abnormalities in obstructive sleep apnea and impact of continuous positive airway pressure. Respiratory Physiology & Neurobiology. 2014;201:31–33. doi:10.1016/j.resp.2014.06.012
21. Mc Ardle R, Morris R, Hickey A, et al. Gait in mild alzheimer’s disease: feasibility of multi-center measurement in the clinic and home with body-worn sensors: a pilot study. J Alzheimers Dis. 2018;63(1):331–341. doi:10.3233/JAD-171116
22. Di Biase L, Di Santo A, Caminiti ML, et al. Gait Analysis in Parkinson’s Disease: an Overview of the Most Accurate Markers for Diagnosis and Symptoms Monitoring. Sensors. 2020;20(12):3529. doi:10.3390/s20123529
23. Kang H. Sample size determination and power analysis using the G*Power software. J Educ Eval Health Prof. 2021;18:17. doi:10.3352/jeehp.2021.18.17
24. Liang S, Chen Z, Huang J, Zhao X, Huang Y, Zhang R. Diagnostic value of portable monitor device in patients with potential obstructive sleep apnea hypopnea syndrome. Zhonghua Er Bi Yan Hou Tou Jing Wai Ke Za Zhi. 2016;51(3):209–211. doi:10.3760/cma.j.issn.1673-0860.2016.03.010
25. Su N, Zhai FF, Zhou LX, et al. Cerebral small vessel disease burden is associated with motor performance of lower and upper extremities in community-dwelling populations. Front Aging Neurosci. 2017;9:313. doi:10.3389/fnagi.2017.00313
26. Zhai F, Liu J, Su N, et al. Disrupted white matter integrity and network connectivity are related to poor motor performance. Sci Rep. 2020;10(1):18369. doi:10.1038/s41598-020-75617-1
27. Cai H, Huang K, Yang F, et al. The contribution of cerebral small vessel disease in idiopathic normal pressure hydrocephalus: insights from a prospective cohort study. Alzheimers Dement. 2025;21. doi:10.1002/alz.14395
28. Lin J, Xu T, Yang X, et al. A detection model of cognitive impairment via the integrated gait and eye movement analysis from a large Chinese community cohort. Alzheimers Dement. 2024;20(2):1089–1101. doi:10.1002/alz.13517
29. Mao HJ, Zhang JX, Zhu WC, et al. Basal ganglia and brainstem located cerebral microbleeds contributed to gait impairment in patients with cerebral small vessel disease. J Alzheimers Dis. 2023;94(3):1005–1012. doi:10.3233/JAD-230005
30. Duering M, Biessels GJ, Brodtmann A, et al. Neuroimaging standards for research into small vessel disease-advances since 2013. Lancet Neurol. 2023;22(7):602–618. doi:10.1016/S1474-4422(23)00131-X
31. Yan CG, Wang XD, Zuo XN, Zang YF. DPABI: data processing & analysis for (Resting-State) Brain Imaging. Neuroinformatics. 2016;14(3):339–351. doi:10.1007/s12021-016-9299-4
32. Tete B, Albdewi MA, Nkodila A, et al. Prevalence of risk and factors associated with obstructive sleep apnea-hypopnea syndrome in an adult population in Kinshasa, Democratic Republic of Congo. J Sleep Res. 2023;32(1):e13637. doi:10.1111/jsr.13637
33. Figgins E, Pieruccini-Faria F, Speechley M, Montero-Odasso M. Potentially modifiable risk factors for slow gait in community-dwelling older adults: a systematic review. Ageing Res Rev. 2021;66:101253. doi:10.1016/j.arr.2020.101253
34. Baillieul S, Wuyam B, Pérennou D, et al. A randomized sham-controlled trial on the effect of continuous positive airway pressure treatment on gait control in severe obstructive sleep apnea patients. Sci Rep. 2021;11(1):9329. doi:10.1038/s41598-021-88642-5
35. Stevens D, Barr C, Bassett K, et al. Reduction in fall risk markers following CPAP treatment of obstructive sleep apnoea in people over 65 years. Sleep Medicine. 2022;100:448–453. doi:10.1016/j.sleep.2022.09.019
36. Cauley JA, Blackwell TL, Redline S, et al. Hypoxia during sleep and the risk of falls and fractures in older men: the osteoporotic fractures in men sleep study. J Am Geriatr Soc. 2014;62(10):1853–1859. doi:10.1111/jgs.13069
37. Stone KL, Blackwell TL, Ancoli-Israel S, et al. Sleep disturbances and risk of falls in older community-dwelling men: the outcomes of sleep disorders in older men (MrOS Sleep) Study. J Am Geriatr Soc. 2014;62(2):299–305. doi:10.1111/jgs.12649
38. Azarbarzin A, Sands SA, Stone KL, et al. The hypoxic burden of sleep apnoea predicts cardiovascular disease-related mortality: the Osteoporotic fractures in men study and the sleep heart health study. Eur Heart J. 2019;40(14):1149–1157. doi:10.1093/eurheartj/ehy624
39. Baillieul S, Perennou D, Marillier M, Pépin JL, Vergès S, Wuyam B. Impaired control of gait in patients with severe obstructive sleep apnea is reversed by continuous positive airway pressure treatment. Annals of Physical and Rehabilitation Medicine. 2016;59:e118–e119. doi:10.1016/j.rehab.2016.07.268
40. Degache F, Goy Y, Vat S, Haba Rubio J, Contal O, Heinzer R. Sleep-disordered breathing and daytime postural stability. Thorax. 2016;71(6):543–548. doi:10.1136/thoraxjnl-2015-207490
41. Kanezaki M, Ogawa T. Sleep apnea and lateral balance instability in older adults. Geriatr Gerontol Int. 2017;17(3):511–513. doi:10.1111/ggi.12885
42. Peel NM, Alapatt LJ, Jones LV, Hubbard RE. The association between gait speed and cognitive status in community-dwelling older people: a systematic review and meta-analysis. J Gerontol a Biol Sci Med Sci. 2019;74(6):943–948. doi:10.1093/gerona/gly140
43. Kilby MC, Slobounov SM, Newell KM. Aging and the recovery of postural stability from taking a step. Gait & Posture. 2014;40(4):701–706. doi:10.1016/j.gaitpost.2014.08.002
44. Afschrift M, Van Deursen R, De Groote F, Jonkers I. Increased use of stepping strategy in response to medio-lateral perturbations in the elderly relates to altered reactive tibialis anterior activity. Gait & Posture. 2019;68:575–582. doi:10.1016/j.gaitpost.2019.01.010
45. Young PM M, Dingwell JB. Voluntary changes in step width and step length during human walking affect dynamic margins of stability. Gait Posture. 2012;36(2):219–224. doi:10.1016/j.gaitpost.2012.02.020
46. Espy DD, Yang F, Bhatt T, Pai YC. Independent influence of gait speed and step length on stability and fall risk. Gait Posture. 2010;32(3):378–382. doi:10.1016/j.gaitpost.2010.06.013
47. MacDonald SWS, Hundza S, Love JA, et al. Concurrent indicators of gait velocity and variability are associated with 25-year cognitive change: a retrospective longitudinal investigation. Front Aging Neurosci. 2017;9:17. doi:10.3389/fnagi.2017.00017
48. Rosano C, Aizenstein H, Brach J, Longenberger A, Studenski S, Newman AB. Special article: gait measures indicate underlying focal gray matter atrophy in the brain of older adults. The Journals of Gerontology Series A: Biological Sciences and Medical Sciences. 2008;63(12):1380–1388. doi:10.1093/gerona/63.12.1380
49. Quan SF, Chan CS, Dement WC, et al. The association between obstructive sleep apnea and neurocognitive performance--the Apnea Positive Pressure Long-term Efficacy Study (APPLES). Sleep. 2011;34(3):303–314B. doi:10.1093/sleep/34.3.303
50. Macey PM, Kumar R, Woo MA, Valladares EM, Yan-Go FL, Harper RM. Brain structural changes in obstructive sleep apnea. Sleep. 2008;31(7):967–977.
51. Celle S, Delon-Martin C, Roche F, Barthélémy JC, Pépin JL, Dojat M. Desperately seeking grey matter volume changes in sleep apnea: a methodological review of magnetic resonance brain voxel-based morphometry studies. Sleep Med Rev. 2016;25:112–120. doi:10.1016/j.smrv.2015.03.001
52. Wagshul ME, Lucas M, Ye K, Izzetoglu M, Holtzer R. Multi-modal neuroimaging of dual-task walking: structural MRI and fNIRS analysis reveals prefrontal grey matter volume moderation of brain activation in older adults. Neuroimage. 2019;189:745–754. doi:10.1016/j.neuroimage.2019.01.045
53. Alexander LD, Black SE, Patterson KK, Gao F, Danells CJ, McIlroy WE. Association between gait asymmetry and brain lesion location in stroke patients. Stroke. 2009;40(2):537–544. doi:10.1161/STROKEAHA.108.527374
54. Mullié Y, Arto I, Yahiaoui N, Drew T. Contribution of the entopeduncular nucleus and the globus pallidus to the control of locomotion and visually guided gait modifications in the cat. Cereb Cortex. 2020;30(9):5121–5146. doi:10.1093/cercor/bhaa106
55. Martin KL, Blizzard L, Wood AG, et al. Cognitive function, gait, and gait variability in older people: a population-based study. The Journals of Gerontology: Series A. 2013;68(6):726–732. doi:10.1093/gerona/gls224
56. Lin YH, Young IM, Conner AK, et al. Anatomy and White Matter Connections of the Inferior Temporal Gyrus. World Neurosurg. 2020;143:e656–e666. doi:10.1016/j.wneu.2020.08.058
57. Cosentino C, Putzolu M, Mezzarobba S, et al. One cue does not fit all: a systematic review with meta-analysis of the effectiveness of cueing on freezing of gait in Parkinson’s disease. Neurosci Biobehav Rev. 2023;150:105189. doi:10.1016/j.neubiorev.2023.105189
58. Franz JR, Francis CA, Allen MS, O’Connor SM, Thelen DG. Advanced age brings a greater reliance on visual feedback to maintain balance during walking. Hum Mov Sci. 2015;40:381–392. doi:10.1016/j.humov.2015.01.012
59. Martelli D, Xia B, Prado A, Agrawal SK. Gait adaptations during overground walking and multidirectional oscillations of the visual field in a virtual reality headset. Gait Posture. 2019;67:251–256. doi:10.1016/j.gaitpost.2018.10.029
60. Mo Y, Mao C, Yang D, et al. Altered neuroimaging patterns of cerebellum and cognition underlying the gait and balance dysfunction in cerebral small vessel disease. Front Aging Neurosci. 2023;15:1117973. doi:10.3389/fnagi.2023.1117973
61. Shulman GL, Fiez JA, Corbetta M, et al. Common blood flow changes across visual tasks: ii. decreases in cerebral cortex. J Cogn Neurosci. 1997;9(5):648–663. doi:10.1162/jocn.1997.9.5.648
62. Singh-Curry V, Husain M. The functional role of the inferior parietal lobe in the dorsal and ventral stream dichotomy. Neuropsychologia. 2009;47(6):1434–1448. doi:10.1016/j.neuropsychologia.2008.11.033
63. Sack AT. Parietal cortex and spatial cognition. Behav Brain Res. 2009;202(2):153–161. doi:10.1016/j.bbr.2009.03.012
64. Li W, Lou W, Zhang W, Tong RKY, Jin R, Peng W. Gyrus rectus asymmetry predicts trait alexithymia, cognitive empathy, and social function in neurotypical adults. Cereb Cortex. 2023;33(5):1941–1954. doi:10.1093/cercor/bhac184
65. Mo Y, Ji B, Ke Z, et al. Stride length and cerebellar regulation: key features of early gait disorder in cerebral small vessel disease. CNS Neurosci Ther. 2024;30(2):e14545. doi:10.1111/cns.14545
66. Baillieul S, Wuyam B, Pépin JL, et al. Continuous positive airway pressure improves gait control in severe obstructive sleep apnoea: a prospective study. PLoS One. 2018;13(2):e0192442. doi:10.1371/journal.pone.0192442
67. Oveisgharan S, Wang T, Barnes LL, Schneider JA, Bennett DA, Buchman AS. The time course of motor and cognitive decline in older adults and their associations with brain pathologies: a multicohort study. Lancet Healthy Longev. 2024;5(5):e336–e345. doi:10.1016/S2666-7568(24)00033-3
68. Huang X, Zhang Z, Lan X, et al. The association between hypoxic burden and the risk of cognitive impairment in patients with obstructive sleep apnea. Sleep. 2025;48(3):zsae269. doi:10.1093/sleep/zsae269
 © 2025 The Author(s). This work is published and licensed by Dove Medical Press Limited. The
full terms of this license are available at https://www.dovepress.com/terms.php
and incorporate the Creative Commons Attribution
- Non Commercial (unported, 4.0) License.
By accessing the work you hereby accept the Terms. Non-commercial uses of the work are permitted
without any further permission from Dove Medical Press Limited, provided the work is properly
attributed. For permission for commercial use of this work, please see paragraphs 4.2 and 5 of our Terms.
© 2025 The Author(s). This work is published and licensed by Dove Medical Press Limited. The
full terms of this license are available at https://www.dovepress.com/terms.php
and incorporate the Creative Commons Attribution
- Non Commercial (unported, 4.0) License.
By accessing the work you hereby accept the Terms. Non-commercial uses of the work are permitted
without any further permission from Dove Medical Press Limited, provided the work is properly
attributed. For permission for commercial use of this work, please see paragraphs 4.2 and 5 of our Terms.