")
Back to Journals » Clinical Ophthalmology » Volume 18
Glaucoma Clinic Monitoring Over 6 Months Using Online Circular Contrast Perimetry in Comparison with Standard Automatic Perimetry: The Developing-World Setting
Authors Hoang TT , Mai TQ , Pham DT, Nguyen XT, Nguyen DA , Vu DT , Hoang HT , Nkurunziza M , Bigirimana D, Skalicky SE
Received 22 September 2024
Accepted for publication 9 December 2024
Published 14 December 2024 Volume 2024:18 Pages 3767—3780
DOI https://doi.org/10.2147/OPTH.S496728
Checked for plagiarism Yes
Review by Single anonymous peer review
Peer reviewer comments 3
Editor who approved publication: Dr Scott Fraser
Tung Thanh Hoang,1,2 Tung Quoc Mai,1 Dung Thi Pham,1 Xuan Thi Nguyen,1 Duc-Anh Nguyen,1 Diu Thi Vu,1 Hien Thi Hoang,1 Menus Nkurunziza,3 Deus Bigirimana,4– 6 Simon Edward Skalicky4,5
1Ophthalmology Department, Hanoi Medical University, Hanoi, Vietnam; 2Ophthalmology Unit, Hanoi Medical University Hospital, Hanoi, Vietnam; 3Centre for Mathematics and Physics, University of Burundi, Bujumbura, Burundi; 4University of Melbourne, Department of Surgery, Melbourne, Victoria, Australia; 5Glaucoma Investigation and Research Unit, The Royal Victorian Eye and Ear Hospital, Melbourne, Victoria, Australia; 6Centre for Eye Research Australia, The Royal Victorian Eye and Ear Hospital, Melbourne, Victoria, Australia
Correspondence: Tung Thanh Hoang, Hanoi Medical University, No. 1 Ton That Tung Str, Dong Da Distr, Hanoi, 11518, Vietnam, Email [email protected]
Purpose: Online circular contrast perimetry provides visual field testing on any computer or tablet without additional hardware. This study compared outcomes of online circular contrast perimetry (OCCP) and standard automated perimetry (SAP) in a developing world setting.
Methods: The longitudinal and observation study was conducted on patients sampled during 2023 at Hanoi Medical University Hospital. Participants were either healthy volunteers as controls or stable glaucoma patients with either primary angle closure or primary open-angle glaucoma. They underwent a comprehensive ocular examination, retinal nerve fiber layer optical coherence tomography scan, and visual field tests performed at baseline and after 3 months and 6 months, using OCCP and SAP in clinic.
Results: The current study was carried out in 168 eyes of 87 patients at baseline, 133 eyes of 69 patients at 3 months, and 121 eyes of 63 patients at 6 months. At baseline, OCCP mean deviation (MD) (R2 = 0.804, p < 0.001) and visual index (VI) (R2 = 0.892, p < 0.001) were strongly correlated with SAP MD and visual field index (VFI) respectively. There was strong agreement and correlation between MD and VI/VFI for SAP and OCCP on repeated testing after 6 months. At 6 months AUC of SAP VFI (0.79) was superior to AUC of OCCP VI (0.67, p = 0.036); otherwise there was no difference in AUC of MD or VI/VFI at baseline, 3 and 6 months, when comparing OCCP and SAP.
Conclusion: OCCP parameters are significantly correlated with those of SAP. OCCP has the potential to provide a complementary role to SAP in glaucoma screening and monitoring.
Keywords: glaucoma, online circular contrast perimetry
Introduction
Glaucoma is a leading cause of irreversible blindness all over the world. Sixty percent of global glaucoma cases are found in Asia, where the disease is the major cause of legal blindness. The global increase of glaucoma over the next 15 years will be largely in Asia, where by 2040 there will be 18.8 million people with primary open-angle glaucoma (POAG) and 9 million with primary angle closure glaucoma (PACG).1 Early diagnosis, timely intervention and lifelong management will ease the rising burden of glaucoma not only in Asia but throughout the world.
Visual field assessment is key to detect and monitor glaucoma. Conventional perimetry techniques require expensive equipment with well-trained staff in specialized settings.2,3 Desktop computers and laptops are common devices. Any online application only requires a basic computer, keyboard, mouse and internet connection. Therefore, digitalizing visual field testing paves the way for teleglaucoma care and enhances accessibility to glaucoma screening and management services, especially in remote Asian territories with lower levels of economic development.4–7 Several alternative visual field techniques have been introduced such as tablet-based perimetries8,9 and virual reality perimetries)10–14 to complement traditional standard automated perimetry (SAP) by providing portable perimetry. These technologies have been demonstrated to have varying degrees of agreement with SAP and test–retest stability.
Several studies on online perimetry have been conducted in Caucasian populations.4–7 However, data from an Asian population regarding the correlation and agreement between the new approach and standard automated perimetry (SAP) are lacking. A web-based solution like online circular contrast perimetry (OCCP) that targets a wide range of populations globally will be strengthened by a comprehensive database covering different ethnic groups with a variety of genetic, cultural and linguistic backgrounds, allowing appropriate fine tuning of test parameters to different population groups. Furthermore, the Australian-made software should be piloted in different internet infrastructures to ensure it is robust and compatible with any network globally. Hence, we performed the current study to compare OCCP and SAP in a Vietnamese clinical setting.
Methods
Our research strictly followed the tenets of the declaration of Helsinki and has been ethically approved by Hanoi Medical University (IRB-VN01001). All participants signed the consent form and were informed about the study purpose.
Participants
The current study was conducted at Hanoi Medical University in 2023 on stable glaucoma patients and healthy volunteers with eligible participants consecutively enrolled. Inclusion criteria included best corrected visual acuity (BCVA) ≥20/60; controlled stable PACG or POAG; no other ocular disease except for glaucoma (including maculopathy, other optic neuropathies, cataract grade II or above15), reliable visual field indices on SAP (with false positive (FP) rate < 15%, false negative (FN) rate < 33% and fixation loss (FL) rate < 20%), and previous experience in using computers and internet-based web browsers. Exclusion criteria included secondary or developmental glaucoma, spherical refraction error ≥±5 diopter, non-glaucomatous optic disc anomalies, central nervous system disease, medications that might alter the visual field (chloroquine, vigabatrin, and pilocarpine), and previous vitreoretinal surgery.
If visual acuity met inclusion criteria, both eyes from each patient were included in the study. Glaucoma diagnosis and classification was based on pre-established criteria outlined by the American Academy of Ophthalmology and Hodapp-Parrish-Anderson system.16–18 The control group included healthy volunteers with normal intraocular pressure (IOP 10–21 mmHg, Goldmann Applanation Tonometry), optic nerve head, retinal nerve fiber layer (RNFL) and no other ocular pathology.
Clinical Examination
Participants underwent a comprehensive assessment with structural testing at baseline and visual field testing at baseline, after 3 months and 6 months (Figure 1). In clinic, patients underwent visual field testing using SAP (Carl Zeiss Meditec Inc, Dublin, California, USA) 24–2 test SITA Standard (Swedish Interactive Threshold Algorithm Standard) and 24 degree OCCP (Eyeonic Pty Ltd, Australia). Visual field reports were considered reliable when FP < 15%, FN < 33% and FL < 20%. Glaucoma visual field damage was defined as per the Hoddapp–Parrish–Anderson criteria.16,19 Optical Coherence Tomography (Cirrus, Zeiss) scans of macula and peripapillary RNFL were obtained within 2 months of the baseline visit. Reports with signal strength <7/10 were excluded.
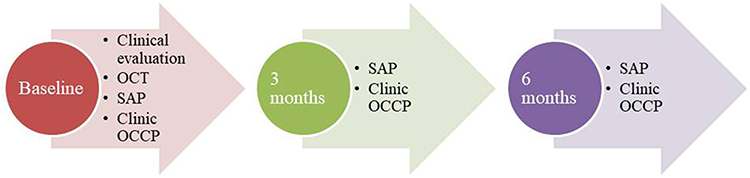 |
Figure 1 Study protocol. |
Online Circular Contrast Perimetry
OCCP technology has been described in several recent papers.4–7,20 Essentially, OCCP works on any computer or tablet by providing perimetry through a web browser. Participants are shown flickering circular targets with alternating rings of light and dark; these are spaced six degrees apart and have a diameter of 3.5 degrees of viewing angle (Figure 2A). These targets share similarities with Pulsar Perimetry (Haag-Streit International); however, they maintain consistent contrast across their spatial extent, with a slight contrast reduction at the peripheral edges to minimize light scatter and unintended stimulation of ganglion cells. In addition, OCCP targets enable a more detailed spatial distribution of visual field loss compared to those used in Pulsar perimetry, being comparatively smaller in size (3.5 vs 5 degrees).21,22 52 loci over 24 degrees of peripheral vision are evaluated by OCCP (Figure 2B). For a total of 360 milliseconds, each target flickers every 60 milliseconds during three on/off cycles. Targets contain temporal counter phase flickering at 9 hz and sinusoidal contrast with spatial frequency of 0.55 cycles/degree, similar to frequency doubling perimetry (FDP, Welch Allyn, Skaneateles, N.Y., and Carl Zeiss Meditec, Dublin, Calif).23,24 In order to avoid temporal transients and saccades, the contrast is linearly ramped up and down over 30 milliseconds at the beginning and end of target presentations (Figure 2C).25,26 Unlike typical FDP, where target bands are adjusted around a mean of background luminance, OCCP’s light rings are adjusted to match the color of the background screen (light grey), and the dark rings’ intensity is adjusted to achieve the desired contrast. This is comparable to utilizing a luminance pedestal flicker for stimulus decrements, and this approach is used to reduce the number of greyscale colors in the target and backdrop design for maintaining consistency of display settings with gamma correction.27
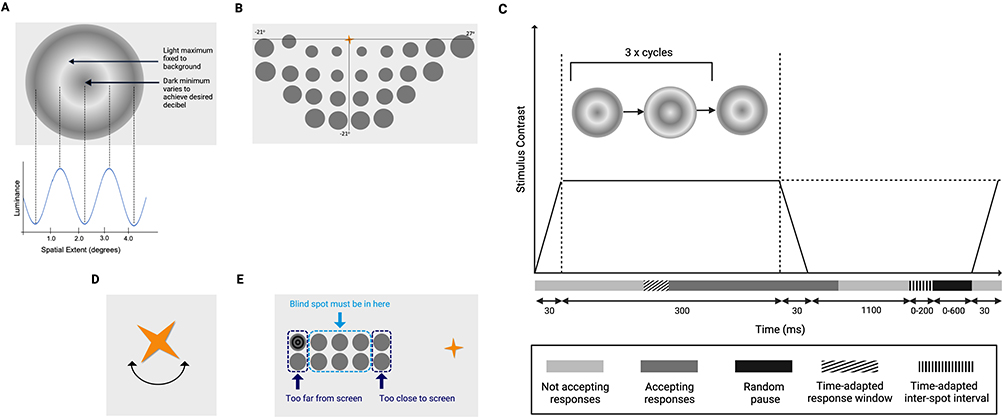 |
Figure 2 Online circular contrast perimetry features – figure adapted from Meyerov et al5,39 (A) Flickering test target. (B) Map of 24–2 perimetry loci testing for the inferior hemifield. The fixation object then shifts to the bottom of the screen to assess the superior hemifield. In order to compensate for the eccentric view from a flat screen as opposed to a Ganzfeld bowl, the size of test targets displayed on the screen has a magnification factor that grows with eccentricity. (C) Target presentation sequence: contrast is graded at the beginning and end of target presentation, and targets appear for three 360-millisecond counterphase flicker cycles. Figure adapted from Alawa et al43 (D) Fixation target: spinning golden star. (E) Blind spot localization optimizes the distance at which the user can see. (B and E) The diagrammatic representation of potential test target locations is provided by the dark and grey homogeneous circles. |
The output of luminance varies from 100% relative brightness percentage for pure white (255, 255, 255) to 0% for black (0, 0, 0). Using the Web Content Accessibility Guidelines as a guide, relative brightness was computed for every 256-greyscale level.28 By measuring the target rings’ relative luminance in the light and dark bands, the Michaelson formula is used to determine contrast.29
Contrast = (RL1 – RL2)/(RL1 + RL2)
Where RL2 is the dark band minimum and RL1 is the light band maximum relative brightness. Screen brightness was increased to 90%, corresponding to 224 candela per square meter (cd/m2). After that, contrast was transformed to relative decibels using a similar approach to what is used for FDP.23
Relative decibel (rdB) = - 20log(contrast)
Target intensity has a dynamic range of 0 to 36 dB, which is comparable to the range used in HFA and other perimetry devices to support human threshold estimates.8 The OCCP testing process is based on an a priori probability density functions with a 4/2 decibel (dB) staircase, similar to SITA.
Participants are asked to focus on a golden star that is continuously spinning (4 degrees of visual angle), and to click the mouse whenever a target appeared in their peripheral vision (Figure 2D). As demonstrated by our earlier research, using a dynamic fixation target may aid in enhancing focus and lowering fixation losses.4 Clicks outside of the permitted response window are noted as FP responses. Similar to SAP, FN responses are noted when subjects do not react to stimuli at greater contrast than recorded in regions of previously determined threshold sensitivity.30 Responses are time-adapted based on the user’s prior reaction time to account for inter-user variability; random delays are also incorporated to avoid rhythmic responses.31
Three mechanisms keep the viewing distance correct. First, in order to guarantee viewing angle uniformity, the app instructs users on the proper viewing distance to utilize for the test. This distance is determined trigonometrically based on the size of the computer monitor. Second, small patches on a 4 × 10-degree grid covering the suggested blind spot—which was assessed to be 15 degrees temporal and 0.5 degrees inferior to fixation—are tested to map the user’s blind spot (Figure 2E). Third, a webcam is used to track the user’s head movement. This feeds data to the app’s machine learning-powered facial detection (as opposed to recognition) software, which has a one-second refresh rate. There was no usage of specific head or neck supports.
When the test found deviations in face position monitoring of more than 15% in four planes, it was stopped, and the user was given instructions to correct their position. The spoken instructions in Vietnamese from OCCP were recorded in advance, but other language options are integrated into the application (Figure 3).
 |
Figure 3 (A) Example of Vietnamese pre-test instructions, translated to: 1. Please sit 50cm from the screen. 2. Close your right eye. 3. Press space bar or click the mouse button when the target appears. 4. Press space or click the mouse button to begin. To pause press “return”, to abort press “delete”. (B) Testing condition of OCCP in Vietnam. |
Dark, large flickering targets on a light grey background provides increased resistance to changes in background lighting compared to other forms of perimetry.32 The properties of the test including spatial frequency, target size, flicker rate and background colour have all been carefully chosen to maximize consistency despite potential differences in testing environments and computer screen output displays.33 Such OCCP design features have been carefully included to account for variations in screen output and background brightness. In addition, the application contains internal calibration mechanisms based on early responses. However, to maximise consistency for this study, all computers had brightness increased to at least 90%. The OCCP application detects different screen sizes and automatically resizes. All these features aim to ensure calibration consistency.
Testing Conditions
The ambient lighting, temperature, and background noise levels were all standardized during the testing, which took place in a controlled clinical setting. SAP was carried out in a specialized, silent, and dimly lit space. Regular fully-functioning laptops in quiet, undisturbed clinical rooms were used for OCCP testing at one location. The backdrop lighting was turned down so that the computer monitor served as the primary source of illumination. Every computer featured its own webcam, volume control, mouse, and internet connectivity.
To guarantee the uniformity of research protocols, all optometrists had received additional training for delivering OCCP and possessed a great deal of experience in operating perimetry. Before the test started, participants were situated at the appropriate viewing distance of 50 cm for this size screen. One eye was patched. One of the trained optometrists supervised the test and made adjustments to head position and height. The participant was given clear and easy-to-understand instruction before starting a trial evaluation. If the participant was unable to complete the first test, they rested and were encouraged to repeat the visual field assessment.
Research Outcomes
Primary outcome measures included global perimetric indices such as mean deviation (MD), pattern standard deviation (PSD) and Visual Field Index (VFI)/Visual Index (VI). Calculation of outcome measures was dependent on data obtained from an established normative dataset.7
Secondary outcome measures included age, gender, diagnosis, disease severity, visual acuity, IOP, refraction, RNFL, central cornea thickness (CCT), and perimetric test duration.
Statistical Analysis
Descriptive statistics included frequency and percentage for qualitative measures, and mean and standard deviation for quantitative measures. Statistical comparative tests included t test, intraclass correlation coefficient (ICC), Pearson correlation, linear regression, Bland–Altman plot and receiver operating curve (ROC) analysis. The level of statistical significance applied was p <0.05. SPSS 23 and R were employed for data analysis. ICCs were defined as excellent (≥0.90); good (0.75 to 0.9); moderate (0.5 to 0.75); or poor (<0.5).34 Pearson’s values were defined as strong (>0.75); moderate (0.45 to 0.75); weak (0.25 to 0.45) or very weak (<0.25).35 As the data involved two eyes from most cases leading to potential clustering effects, generalized estimating equations were used to adjust for intra-subject correlation, and the Hanley and McNeil test was applied to compare ROC curves. Sample size was calculated based on expected AUC results using perimetry in a mixed glaucoma/normal cohort. The AUC ranges from 0.7 to 0.89;4,5 to be conservative, we used the lower end of the range to ensure appropriate sample size, taking into account the potential intraclass correlation of two eyes from each individual. Using MedCalc software36 with an alpha of 0.05 and type 2 error 0.2, a sample size of 64 was obtained. To account for subject dropout, we aimed to recruit slightly greater numbers, which made up 87 patients.
Results
One hundred sixty-eight eyes of 87 patients were recruited, of whom 58 were in the glaucoma cohort and 29 were controls. Their characteristics are outlined in Table 1. Eighty-one patients with 2 eyes and 6 patients with 1 eye were included. Sixty-nine patients (79.3%) attended the 3-month follow-up visit, and 63 patients (72.4%) attended the 6-month visit.
 |
Table 1 Research Population Characteristics |
Generally, OCCP generated similar visual field findings to SAP across different stages of glaucoma (Figure 4).
 |
Figure 4 Visual field pattern and total deviation plots for individuals with mild, moderate and severe glaucoma; comparing OCCP and SAP. |
There was no significant difference between test duration, FL, PSD, VFI/VI of SAP and OCCP (Table 2). FP was higher in the OCCP group (p < 0.001) and FN was higher in the SAP group (p < 0.001). MD was lower in the SAP group. (p < 0.001).
 |
Table 2 Test Duration, Reliability Indexes and Global Visual Field Indexes of SAP and OCCP |
At baseline, OCCP and SAP MD and VI/VFI were strongly correlated, while OCCP and SAP PSD were moderately correlated (Table 3). OCCP parameters were positively strongly correlated with superior and inferior RNFL thickness on OCT. PSD negatively moderately correlated with superior and inferior RNFL thickness on OCT.
 |
Table 3 Pearson Correlation Between SAP, OCT and OCCP at Baseline |
Linear regression analysis demonstrated a significant correlation between OCCP and SAP MD (R2 = 0.804, p < 0.001); and VFI (R2 = 0.892, p < 0.001) (Figure 5).
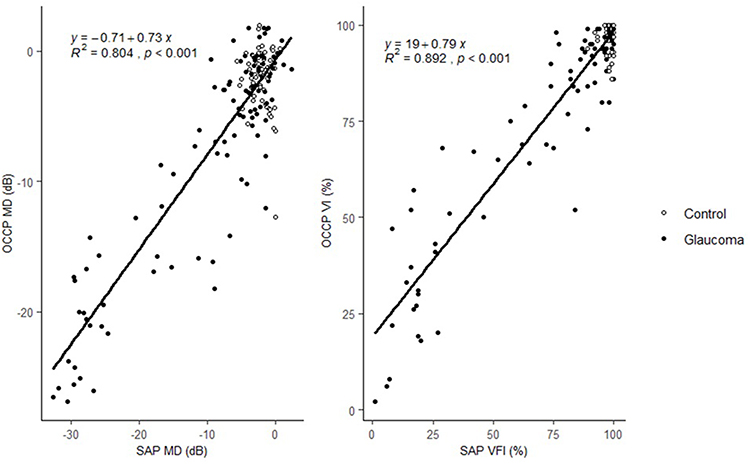 |
Figure 5 Linear regression between OCCP and SAP MD, VFI. |
At baseline, Bland–Altman plots showed significant agreement between OCCP and SAP MD (Bias 1.11; Lower LoA −6.73; Upper LoA 8.95), and VI/VFI (Bias 1.57; Lower LoA −16.63; Upper LoA 19.76, Figure 6A and B). Across 6 months, Bland–Altman plots demonstrated significant agreement between baseline and 6-month MD (Bias 0.38; Lower LoA −6.18; Upper LoA 6.94), VFI (Bias −0.90; Lower LoA −17.43; Upper LoA 15.63) of OCCP and VFI (Figure 6C–F).
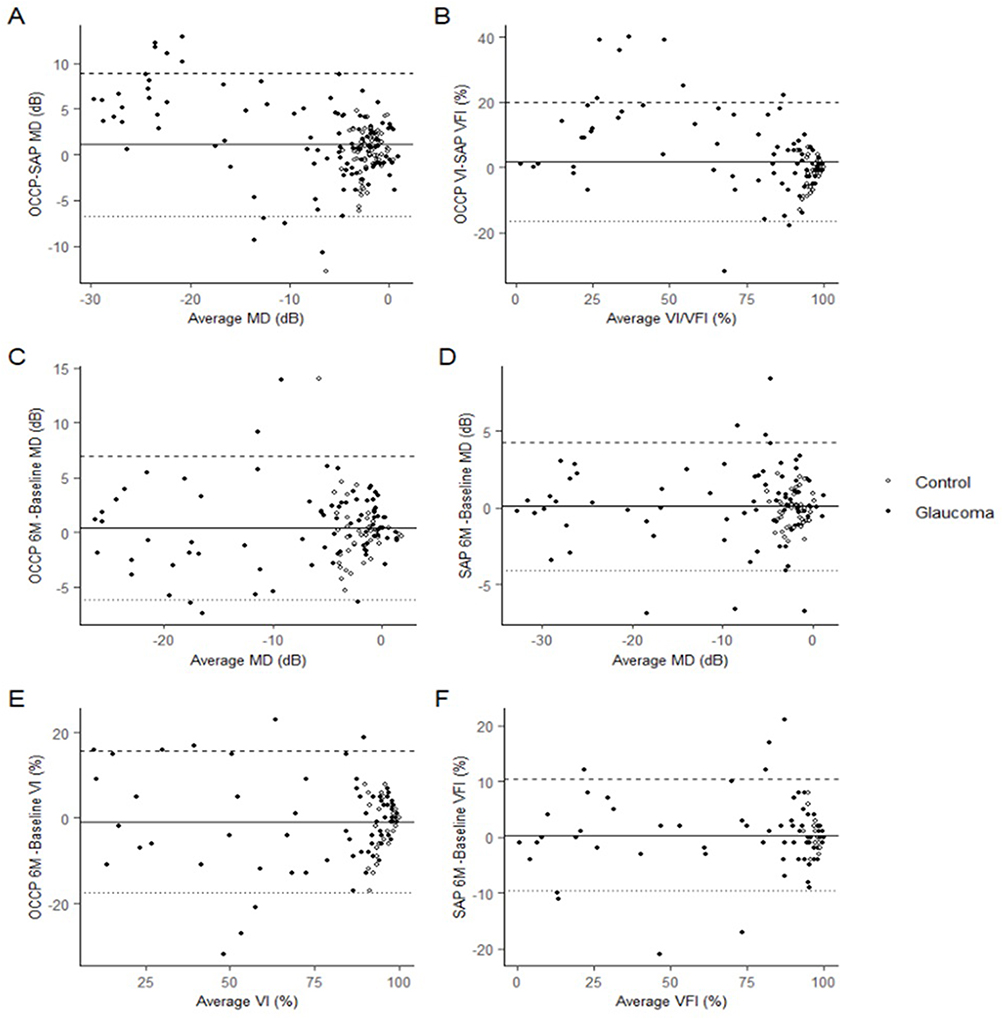 |
Figure 6 Bland–Altman plots of OCCP and SAP MD, VI/VFI. (A) OCCP v SAP MD at baseline visit. (B) OCCP v SAP VI/VFI at baseline visit. (C) OCCP MD at 6 months v baseline. (D) SAP MD at 6 months v baseline. (E) OCCP VI at 6 months v baseline. (F) SAP VFI at 6 months v baseline. The continuous horizontal line represents the mean difference (bias) between tests, dashed and dotted horizontal lines represent the 95% limits of agreement (Bias ± 1.96SD). Black-coloured circles represent controls and white-coloured circles represent glaucomatous eyes. |
OCCP and SAP area under the curve (AUC) are presented in Table 4. Hanley–McNeil analysis showed no significant difference between AUC of OCCP and SAP MD, VI/VFI at most points of time except for VI/VFI at 6 months, at which time SAP VFI was significantly higher than OCCP VI (p = 0.036).
 |
Table 4 Comparison Between AUC of OCCP and SAP MD, VI/VFI at Baseline, 3 Months and 6 Months |
Consistency over time was assessed with ICC and Pearson correlation over the 6-month period (Table 5). ICCs over time were good or excellent, and Pearson’s values strong, for MD and VI/VFI for both forms of perimetry, and stronger for SAP than OCCP.
 |
Table 5 Intraclass Correlation Coefficient and Pearson Correlation Between OCCP and SAP Over 6 Months |
Discussion
The current study explores the feasibility, usability and diagnostic accuracy of OCCP compared to SAP, with moderate to strong agreement to SAP global indices at baseline and over time. While test–retest stability over time was very strong for both tests, it was stronger for SAP. This data is the first such data for OCCP in an emerging Asian economy and is consistent with previous studies performed in Australia.4–7,20
In the current study, it was found out that OCCP and SAP MD and VI/VFI had strong correlation while PSD had moderate correlation. This was consistent with a study of Meyerov et al (MD 0.90, p < 0.0001; PSD 0.87, p < 0.0001).5 Comparing SAP with Melbourne Rapid Fields (MRF, Glance Vision, Australia), a tablet-based perimetry, Kong et al pointed out that MD and PSD were significantly correlated (MD 0.9, PSD 0.7, Pearson Correlation) between MRF and SAP.8 In our study, OCCP parameters were significantly correlated with superior and inferior OCT RNFL thickness, indicating a structure-function correlation. These findings support previous OCCP papers. Using the Hanley–McNeil method to compare AUC for OCCP MD and OCT RNFL inferior thickness, no significant difference was found between the two diagnostic modalities in terms of ability to discriminate between glaucomatous and normal eyes.4,5
Linear regression analysis demonstrated a significant correlation between OCCP and SAP MD (R2 = 0.804, p < 0.001); and VFI (R2 = 0.892, p < 0.001). Comparing OCCP and SAP, Meyerov et al showed that OCCP and SAP MD was significantly correlated with R2 = 0.8, p < 0.0001.5 Kong et al found a similar result for MRF and SAP (R2 = 0.8).8 At baseline, Bland–Altman plots showed significant agreement between OCCP and SAP MD (Bias 1.11; Lower LoA −6.73; Upper LoA 8.95), VFI (Bias 1.57; Lower LoA −16.63; Upper LoA 19.76). This finding was lower than the earlier OCCP papers of Meyerov et al4 (MD 4.3 dB) and Skalicky et al7 (MD 4.02 dB), but close to the more recent OCCP papers of Meyerov et al5 (MD 0.51 dB) and Meyerov et al20 (MD 0.38 dB). The result reflected the evolution of OCCP technology, refining the agreement between the online and conventional perimetry. Hanley–McNeil analysis showed no significant difference between AUC comparing MD and VFI/VI for OCCP and SAP at baseline. The finding was consistent with studies of Meyerov.4,5
OCCP targets share some common attributes with Pulsar Perimetry (Haag-Streit International), which has been shown to be useful for detecting early glaucoma.22 In another study, Zeppieri found that Pulsar T30W was a rapid and easy perimetric technology, which demonstrated higher sensitivity than SAP in early diagnosis of glaucomatous visual field damage.21 The finding was later on confirmed in a study of Hirasawa, which revealed that Pulsar perimetry was able to diagnose early glaucoma (pre-perimetric on SAP) with similar capacity to Spectral Domain OCT.37
OCCP demonstrated strong repeatability over 6 months. Bland–Altman plots demonstrated significant agreement between baseline and 6-month MD (Bias 0.38; Lower LoA −6.18; Upper LoA 6.94), and VI (Bias −0.90; Lower LoA −17.43; Upper LoA 15.63). The bias was comparable to that after 18 weeks in a study of Meyerov20 (MD bias 0.87 dB). Hanley–McNeil analysis showed no significant difference between AUC of OCCP and HVF MD, VFI at most points of time except for VI at 6 months.
Pearson and ICC analysis for each perimetry method demonstrated a very strong correlation between baseline and 6-months for MD and VI/VFI, ranging from 0.85 to 0.98. This was comparable to a study of Meyerov that showed OCCP MD ICC at 18 weeks was 0.87 (95% CI: 0.49–0.99).20 According to another study of Prea on MRF, MD ICC at 6 months was 0.87 (95% CI: 0.77–0.92).38
In some ways, the repeatability of OCCP was not as strong as SAP, with lower correlation metrics between baseline and 6 months for OCCP than SAP. Despite the instruction provided for OCCP, participants were likely more familiar with SAP than OCCP, which might lead to potential bias and explain the difference between two modalities. However, the strength of correlation for OCCP at baseline versus 6 months was still high. This is in keeping with previous studies.20 This needs to be considered in light of the other advantages of OCCP over SAP, namely reduced cost per test, ease of use and access, and the potential for frequent home monitoring. With further software refinement and the use of database optimisation, it is hopeful that the accuracy of OCCP will improve over time.
We found no difference between OCCP and SAP for test duration, FL, PSD and VFI/VI. This is similar to previous OCCP papers; for Meyerov et al, the test durations of two methods were OCCP 5.29 ± 1.24 (sec) and SAP 6.00 ± 1.05 (sec).20 It was also similar to a study of Kong et al which showed the test duration of MRF and SAP were 5.7 ± 0.1 (sec) and 6.3 ± 0.1 (sec), respectively.8 However, MD was lower in SAP group, FP was higher in OCCP group, and FN was higher in SAP group. FP is influenced by different perimetric paramaters such as target presentation time and inter-trial interval, while FN is influenced by the brightness difference between the test target and estimated threshold, and proximity to a scotoma. It is challenging to interpret the differences in FP, FN rate and MD between these two perimetric methods, given the fundamental differences in testing parameters. Overall, test design, participant familiarity or device sensitivity might contribute to these differences.
Both OCCP and SAP had a mean of around −2 dB in the control groups. This is different from previous OCCP studies, which found a mean of 0 dB in control groups.4,5,39 This may reflect some overall unfamiliarity with perimetry among healthy Asians, and also some normative data issues when applying normative datasets generated in primarily Caucasian populations to Asian ones – hence the importance of validation of a normative Asian cohort.40
This study focused on 24–2 perimetry; however, OCCP also offers 10–2, 30–2 perimetry as well as licensing assessment. These extra modalities are important for comprehensive glaucoma services. A study of Chen establishing the normative database for central 10-degree of OCCP demonstrated that 10-degree OCCP had similar perimetric results compared to SAP in a normal cohort.6
Visual field assessment is critical for glaucoma detection and monitoring, especially in Asia, the continent with such a large and growing proportion of glaucoma cases globally.1 Developing economies with limited resources in this region encounter critical issues such as funding restraints, lack of well-trained human resources and infrastructure. Even in developed countries like USA, less than 75% of glaucoma patients have their visual field assessed annually.41 It is recommended that within the first 2 years, newly-diagnosed glaucoma patients should complete at least one test every 4 months, and then at least 1–2 tests should be performed regularly depending on the disease progression and severity.42 Inevitably, a new gamechanger, which could be cheaper, more popular and easier to be accessed will tackle the mission of providing regular visual field tests in developing Asian economies.
A study of 95 glaucoma patients and controls surveyed users’ experience of OCCP compared to SAP. Participants demonstrated a strong preference for the web-based test than the conventional one (p < 0.0001).4 OCCP will improve the user experience of perimetry, enhance the accessibility to visual field service, allow earlier detection and prompt treatment of glaucoma progression and pave the way for teleglaucoma. As an online application, using pre-recorded voice prompts and written text clips as demonstrated in Figure 3, it can be easily translated to multiple languages, improving the cultural use experience of perimetry and accordingly the co-operation of individual patients and accuracy of results.
The current study has some limitations. Drop-out is an issue of any longitudinal study. However, analysis of non-dropout versus dropout participants at three- and six-month follow-up demonstrated no difference, indicating that the influence of missing data was unremarkable. (Supplement) Selection of participants from a single practice is a potential weakness, but this is compensated for several studies of OCCP from across the globe. A significant difference in age between glaucoma and control group was noted – this is due to the fact that glaucoma damage accumulates with age, however, it can cause some confounding of comparative group results. The control group was not matched with glaucoma group in terms of age, sex and relevant factors, which might impact the reliability of abnormality detection results. Using data from both eyes from each patient can result in inadvertent correlation and confounding. A comparison of baseline features of right eye and left eye was conducted (Supplement), and found no difference was found between both eyes. Therefore, the intra-subject correlation is less likely to impact our findings. Due to the large volume of data, we were unable to analyse individual test points, which would be intersting in future studies. Despite the challenges of providing comprehensive glaucoma care and additionally recruiting for studies in a developing-world setting, we were able to recruit a sufficient study population within an acceptable timeframe to generate the very first database for Asian people to use online perimetry.
In conclusion, the performance of OCCP seemed to be similar to the performance of SAP. Over 6 months, OCCP demonstrated excellent repeatability. OCCP holds the potential to provide a complimentary role to SAP in glaucoma screening and monitoring in clinic as well as at home.
Ethics Approval and Informed Consent
The study was ethically approved by Hanoi Medical University (IRB-VN01001). Consent form was obtained from participants.
Disclosure
The following disclosure is the only financial disclosure: A/Prof Simon Skalicky is a director of Eyeonic Pty Ltd, which owns patent WO2021051162A1 regarding online circular contrast perimetry. Tung Thanh Hoang and Tung Quoc Mai share the co-first authorship.
References
1. Tham YC, Li X, Wong TY, Quigley HA, Aung T, Cheng CY. Global prevalence of glaucoma and projections of glaucoma burden through 2040: a systematic review and meta-analysis. Ophthalmology. 2014;121(11):2081–2090. doi:10.1016/j.ophtha.2014.05.013
2. Prager AJ, Kang JM, Tanna AP. Advances in perimetry for glaucoma. Curr Opin Ophthalmol. 2021;32(2):92–97. doi:10.1097/ICU.0000000000000735
3. Wu Z, Medeiros FA. A simplified combined index of structure and function for detecting and staging glaucomatous damage. Sci Rep. 2021;11(1):3172. doi:10.1038/s41598-021-82756-6
4. Meyerov J, Deng Y, Busija L, Skalicky SE. Circular Contrast Perimetry via Web Application: a Patient Appraisal and Comparison to Standard Automated Perimetry. Ophthalmol Sci. 2022;2(3):100172. doi:10.1016/j.xops.2022.100172
5. Meyerov J, Deng Y, Busija L, Bigirimana D, Skalicky SE. Online Circular Contrast Perimetry: a Comparison to Standard Automated Perimetry. Asia Pac J Ophthalmol. 2023;12(1):4–15. doi:10.1097/APO.0000000000000589
6. Chen YX, Meyerov J, Skalicky SE. Online Circular Contrast Perimetry via a Web-Application: establishing a Normative Database for Central 10-Degree Perimetry. Clin Ophthalmol. 2024;18:201–213. doi:10.2147/OPTH.S440964
7. Skalicky SE, Bigirimana D, Busija L. Online circular contrast perimetry via a web-application: optimising parameters and establishing a normative database. Eye. 2022;37(6):1184–1190. doi:10.1038/s41433-022-02085-4
8. Kong YX, He M, Crowston JG, Vingrys AJ. A Comparison of Perimetric Results from a Tablet Perimeter and Humphrey Field Analyzer in Glaucoma Patients. Transl Vis Sci Technol. 2016;5(6):2. doi:10.1167/tvst.5.6.2
9. Jones PR, Campbell P, Callaghan T, et al. Glaucoma Home Monitoring Using a Tablet-Based Visual Field Test (Eyecatcher): an Assessment of Accuracy and Adherence Over 6 Months. Am J Ophthalmol. 2021;223:42–52. doi:10.1016/j.ajo.2020.08.039
10. Arai K, Nishijima E, Ogawa S, et al. A Novel Visual Field Screening Program for Glaucoma With a Head-Mounted Perimeter. J Glaucoma. 2023;32(6):520–525. doi:10.1097/IJG.0000000000002199
11. Wang B, Alvarez-Falcón S, El-Dairi M, Freedman SF. Performance of virtual reality game-based automated perimetry in patients with childhood glaucoma. J Aapos. 2023;27(6):325.e321–325.e326. doi:10.1016/j.jaapos.2023.08.014
12. Chia ZK, Kong AW, Turner ML, et al. Assessment of Remote Training, At-Home Testing, and Test-Retest Variability of a Novel Test for Clustered Virtual Reality Perimetry. Ophthalmol Glaucoma. 2023;7(2):139–147. doi:10.1016/j.ogla.2023.08.006
13. Phu J, Kalloniatis M. Comparison of 10-2 and 24-2C Test Grids for Identifying Central Visual Field Defects in Glaucoma and Suspect Patients. Ophthalmology. 2021;128(10):1405–1416. doi:10.1016/j.ophtha.2021.03.014
14. Hu GY, Prasad J, Chen DK, Alcantara-Castillo JC, Patel VN, Al-Aswad LA. Home Monitoring of Glaucoma Using a Home Tonometer and a Novel Virtual Reality Visual Field Device: acceptability and Feasibility. Ophthalmol Glaucoma. 2023;6(2):121–128. doi:10.1016/j.ogla.2022.05.001
15. Chylack Jr LT, Wolfe JK, Singer DM, et al. The Lens Opacities Classification System III. The Longitudinal Study of Cataract Study Group. Arch Ophthalmol. 1993;111(6):831–836. doi:10.1001/archopht.1993.01090060119035
16. Anderson DR. Automated Static Perimetry. St Louis, MO: Mosby; 1992.
17. Gedde SJ, Vinod K, Wright MM, et al. Primary Open-Angle Glaucoma Preferred Practice Pattern®. Ophthalmology. 2021;128(1):P71–p150. doi:10.1016/j.ophtha.2020.10.022
18. Chakravarti T. Assessing Precision of Hodapp-Parrish-Anderson Criteria for Staging Early Glaucomatous Damage in an Ocular Hypertension Cohort: a Retrospective Study. Asia Pac J Ophthalmol. 2017;6(1):21–27. doi:10.1097/APO.0000000000000201
19. Hoddapp AD. Clinical Decision in Glaucoma. St Louis, Missouri:: C.V. Mosby; 1993.
20. Meyerov JCYX, Green C, Busija L, Skalicky SE, Skalicky SE. Online Circular Contrast Perimetry: repeatability in comparison to Standard Automated Perimetry. J Glaucoma. 2024;33(7):505–515. doi:10.1097/IJG.0000000000002384
21. Zeppieri M, Brusini P, Parisi L, Johnson CA, Sampaolesi R, Salvetat ML. Pulsar perimetry in the diagnosis of early glaucoma. Am J Ophthalmol. 2010;149(1):102–112. doi:10.1016/j.ajo.2009.07.020
22. Gonzalez-Hernandez M, Garcia-Feijo J, Sanchez Mendez M, Gonzalez de la Rosa M. Combined spatial, contrast, and temporal functions perimetry in mild glaucoma and ocular hypertension. Eur J Ophthalmol. 2004;14(6):514–522. doi:10.1177/112067210401400611
23. Swanson WH, Horner DG, Dul MW, Malinovsky VE. Choice of Stimulus Range and Size Can Reduce Test-Retest Variability in Glaucomatous Visual Field Defects. Transl Vis Sci Technol. 2014;3(5):6. doi:10.1167/tvst.3.5.6
24. Liu H, Li L, Wormstone IM, et al. Development and Validation of a Deep Learning System to Detect Glaucomatous Optic Neuropathy Using Fundus Photographs. JAMA Ophthalmol. 2019;137(12):1353–1360. doi:10.1001/jamaophthalmol.2019.3501
25. Johnson CA, Cioffi GA, Van Buskirk EM. Frequency doubling technology perimetry using a 24--2 stimulus presentation pattern. Optom Vis Sci. 1999;76(8):571–581. doi:10.1097/00006324-199908000-00026
26. Warren DE, Thurtell MJ, Carroll JN, Wall M. Perimetric evaluation of saccadic latency, saccadic accuracy, and visual threshold for peripheral visual stimuli in young compared with older adults. Invest Ophthalmol Vis Sci. 2013;54(8):5778–5787. doi:10.1167/iovs.13-12032
27. Anderson AJ, Vingrys AJ. Interactions between flicker thresholds and luminance pedestals. Vision Res. 2000;40(19):2579–2588. doi:10.1016/S0042-6989(00)00121-8
28. W3. WCA Guidelines. Available from: https://www.w3.org/WAI/GL/wiki/Relative_luminance.
29. Campbell FW, Green DG. Optical and retinal factors affecting visual resolution. J Physiol. 1965;181(3):576–593. doi:10.1113/jphysiol.1965.sp007784
30. Bengtsson B, Heijl A. False-negative responses in glaucoma perimetry: indicators of patient performance or test reliability? Invest Ophthalmol Vis Sci. 2000;41(8):2201–2204.
31. Mulholland PJ, Redmond T, Garway-Heath DF, Zlatkova MB, Anderson RS. Spatiotemporal Summation of Perimetric Stimuli in Early Glaucoma. Invest Ophthalmol Vis Sci. 2015;56(11):6473–6482. doi:10.1167/iovs.15-16921
32. Anderson RS, Redmond T, McDowell DR, Breslin KM, Zlatkova MB. The robustness of various forms of perimetry to different levels of induced intraocular stray light. Invest Ophthalmol Vis Sci. 2009;50(8):4022–4028. doi:10.1167/iovs.08-2934
33. Swanson WH, Dul MW, Horner DG, Liu T, Tran I. Assessing spatial and temporal properties of perimetric stimuli for resistance to clinical variations in retinal illumination. Invest Ophthalmol Vis Sci. 2014;55(1):353–359. doi:10.1167/iovs.13-11640
34. Koo TK, Li MY. A Guideline of Selecting and Reporting Intraclass Correlation Coefficients for Reliability Research. J Chiropr Med. 2016;15(2):155–163. doi:10.1016/j.jcm.2016.02.012
35. Akoglu H. User’s guide to correlation coefficients. Turk J Emerg Med. 2018;18(3):91–93. doi:10.1016/j.tjem.2018.08.001
36. Negida A, Fahim NK, Negida Y. Sample Size Calculation Guide - Part 4: how to Calculate the Sample Size for a Diagnostic Test Accuracy Study based on Sensitivity, Specificity, and the Area Under the ROC Curve. Adv J Emerg Med. 2019;3(3):e33. doi:10.22114/ajem.v0i0.158
37. Hirasawa K, Takahashi N, Matsumura K, Kasahara M, Shoji N. Diagnostic capability of Pulsar perimetry in pre-perimetric and early glaucoma. Sci Rep. 2017;7(1):3293. doi:10.1038/s41598-017-03550-x
38. Prea SM, Kong YXG, Mehta A, et al. Six-month Longitudinal Comparison of a Portable Tablet Perimeter With the Humphrey Field Analyzer. Am J Ophthalmol. 2018;190:9–16. doi:10.1016/j.ajo.2018.03.009
39. Meyerov J, Chen Y, Busija L, Green C, Skalicky SE. Repeatability of Online Circular Contrast Perimetry Compared to Standard Automated Perimetry. J Glaucoma. 2024;33(7):505–515.
40. Tung HT, Tung MQ, Dung PT, et al. Online circular contrast perimetry: the normative database of an Asian population. T?p chí Nghiên c?u Y h?c. 2024;184(11E15):151–160. doi:10.52852/tcncyh.v184i11E15.2925
41. Stagg BC, Stein JD, Medeiros FA, et al. The Frequency of Visual Field Testing in a US Nationwide Cohort of Individuals with Open-Angle Glaucoma. Ophthalmol Glaucoma. 2022;5(6):587–593. doi:10.1016/j.ogla.2022.05.002
42. Sabouri S, Haem E, Masoumpour M, et al. Frequency of Visual Fields Needed to Detect Glaucoma Progression: a Computer Simulation Using Linear Mixed Effects Model. J Glaucoma. 2023;32(5):355–360. doi:10.1097/IJG.0000000000002155
43. Alawa KA, Nolan RP, Han E, et al. Low-cost, smartphone-based frequency doubling technology visual field testing using a head-mounted display. Br J Ophthalmol. 2021;105(3):440–444. doi:10.1136/bjophthalmol-2019-314031
 © 2024 The Author(s). This work is published and licensed by Dove Medical Press Limited. The
full terms of this license are available at https://www.dovepress.com/terms.php
and incorporate the Creative Commons Attribution
- Non Commercial (unported, 3.0) License.
By accessing the work you hereby accept the Terms. Non-commercial uses of the work are permitted
without any further permission from Dove Medical Press Limited, provided the work is properly
attributed. For permission for commercial use of this work, please see paragraphs 4.2 and 5 of our Terms.
© 2024 The Author(s). This work is published and licensed by Dove Medical Press Limited. The
full terms of this license are available at https://www.dovepress.com/terms.php
and incorporate the Creative Commons Attribution
- Non Commercial (unported, 3.0) License.
By accessing the work you hereby accept the Terms. Non-commercial uses of the work are permitted
without any further permission from Dove Medical Press Limited, provided the work is properly
attributed. For permission for commercial use of this work, please see paragraphs 4.2 and 5 of our Terms.