")
Back to Journals » Clinical Ophthalmology » Volume 19
Glaucoma Home Monitoring Using Online Circular Contrast Perimetry Over 6 Months: Performance and Patient Attitudes in the Developing World Setting
Authors Hoang TT , Mai TQ , Pham DT, Nguyen XT, Nguyen DA , Vu DT , Hoang HT , Skalicky SE
Received 13 February 2025
Accepted for publication 3 April 2025
Published 12 April 2025 Volume 2025:19 Pages 1263—1276
DOI https://doi.org/10.2147/OPTH.S519093
Checked for plagiarism Yes
Review by Single anonymous peer review
Peer reviewer comments 2
Editor who approved publication: Dr Scott Fraser
Tung Thanh Hoang,1– 3,* Tung Quoc Mai,1,* Dung Thi Pham,1 Xuan Thi Nguyen,1 Duc-Anh Nguyen,1 Diu Thi Vu,1 Hien Thi Hoang,1 Simon Edward Skalicky4,5
1Ophthalmology Department, Hanoi Medical University, Hanoi, Vietnam; 2Ophthalmology Unit, Hanoi Medical University Hospital, Hanoi, Vietnam; 3Save Sight Institute, The University of Sydney, Sydney, NSW, Australia; 4Department of Surgery, The University of Melbourne, Melbourne, VIC, Australia; 5Glaucoma Investigation and Research Unit, the Royal Victorian Eye and Ear Hospital, Melbourne, VIC, Australia
*These authors contributed equally to this work
Correspondence: Tung Thanh Hoang, Ophthalmology Department, Hanoi Medical University, No. 1 Ton That Tung str, Dong Da distr, Hanoi, 11518, Vietnam, Email [email protected]
Purpose: Online circular contrast perimetry (OCCP) provides perimetry on any computer or tablet without additional hardware. This study assessed the longitudinal performance and user feedback of home OCCP in an Asian population.
Methods: Twenty glaucoma and fifteen healthy participants underwent a comprehensive ocular examination and visual field tests in clinic, using OCCP and standard automated perimetry. Within a week, participants were asked to repeat OCCP at home. OCCP was then repeated after 3 months and 6 months at home, followed by a user-experience survey.
Results: No significant difference between clinic and home OCCP for test duration, false negative (FN) and fixation loss (FL) rates was found. False positive (FP) rate of home OCCP was slightly higher than that of clinic OCCP (p = 0.04). Bland-Altman plots indicated a small difference between Mean Deviation (MD) (1.26 dB, p = 0.0087) and good agreements between Pattern Standard Deviation (PSD) and Visual Index (VI) of clinic OCCP and home OCCP with insignificant difference of PSD and VI (p > 0.05). Intraclass correlation coefficient (ICC) analysis demonstrated good correlation of MD & VI and poor correlation of PSD between clinic OCCP and home OCCP. Over 6 months, home OCCP indicated moderate to excellent correlation of indices. Participants reported a positive attitude toward home OCCP; however, a high dropout rate was noted for the 3- and 6-month at-home testing.
Conclusion: Comparable results were observed between clinic and home OCCP at baseline. Acceptable consistency of home OCCP findings over 6 months was recognized. Patients may require additional support to achieve desired adherence to at-home monitoring protocols.
Keywords: online circular contrast perimetry, glaucoma home-monitoring
Introduction
Teleglaucoma is a new trend of glaucoma care in the era of artificial intelligence, cloud computing and telemedicine, allowing closer surveillance and halting disease progression as a consequence.1 Home-monitoring using visual field testing on personal devices plays a key role in the potential success of teleglaucoma and has been reported to be effective in detecting early changes of glaucoma visual field damage with acceptable compliance and promising results compared to those from in-clinic settings.2 Previously published home-monitoring visual field studies were conducted in developed countries (US,3 UK,4 Australia,5 Greece6). However, no data of at-home visual field testing in a developing setting has been published.
Some alternative visual field techniques have been introduced, including tablet-based perimetry4,7 and virtual reality perimetry,3,8–11 which complement traditional perimetry by providing portable visual field testing. Online circular contrast perimetry (OCCP) is a validated method of perimetry that allows visual field testing on any computer or tablet.12 It has been found to have strong agreement and diagnostic similarity to conventional perimetric machines. Furthermore, it has demonstrated good repeatability and reliability with similar results to standard automated perimetry (SAP) over 18 weeks.13 By the nature of its design, OCCP is easy to perform in the at-home, unsupervised setting.12 While other home perimetry devices have been evaluated, the advantage of OCCP is that it allows patients to use their own computer or tablet for perimetry, without additional hardware or downloaded software – all that is needed is a stable internet connection. We hypothesize that OCCP will reveal comparable results to clinic OCCP and will be acceptable for patients performing the test at home. Hence, we performed the current study in an Asian population to examine the acceptability and performance of home OCCP and responses from participants.
Methods
Ethical approval was granted by Hanoi Medical University, and research adhered to the tenets of the Declaration of Helsinki (IRB-VN01001). In 2023, a longitudinal, observational study was performed with the enrollment of eligible participants. Written informed consent was obtained from all participants.
Subjects
Eligible subjects included healthy volunteers and patients with stable primary glaucoma at Hanoi Medical University Hospital. Best corrected visual acuity (BCVA) of at least 20/60, stable primary angle closure glaucoma or open angle glaucoma, no other ocular diseases (such as maculopathy, other optic neuropathies, cataracts grade II or above),14 reliable visual field indices on SAP, and experience with computers and internet-based web browsers were among the inclusion criteria. The following conditions were excluded: neurological disorders that affect visual field results or ability to perform visual field testing, non-glaucomatous disc damage, medicines that might alter visual field results (such as chloroquine, vigabatrin, and pilocarpine) and unreliable standard automated perimetry.
Both eyes were enrolled for each patient if the eye met the visual acuity criteria. Glaucoma was diagnosed and classified based on pre-established criteria introduced by the American Academy of Ophthalmology and the Hodapp-Parrish-Anderson method.15 Healthy individuals in the control group had normal IOP, optic nerve head, RNFL, and no other ocular diseases.
Study Protocol
Baseline in-Clinic Testing
The study protocol is outlined in Figure 1.
The participants underwent a comprehensive clinical examination process that included visual field testing and a baseline structural optical coherence tomography (OCT, Cirrus, Zeiss) test. Using OCCP (Eyeonic Pty Ltd, Australia) and SAP (Carl Zeiss Meditec Inc., Dublin, California, USA) 24-2 test SITA Standard (Swedish Interactive Threshold Algorithm Standard) in randomized order once for each eye, patients performed visual field testing in the clinic. The standard metrics of false negatives (FN) > 33%, false positives (FP) > 15%, and fixation losses (FL) > 20% (derived from the Heij-Krakau approach) were used to determine the unreliability of the tests.16 OCT images were obtained. OCT reports were not accepted if the signal strength was less than seven out of ten.
The testing was conducted in a controlled clinical setting with uniform ambient lighting, temperature, and background noise levels. SAP was conducted in a dedicated, quiet, and low-light environment. For OCCP testing standardized, fully functional laptops were used in one calm, unoccupied clinical room. The main source of lighting was the computer monitor, which was adjusted to have less background lighting. Each computer had its own mouse, webcam, volume control, and internet access.
All optometrists were highly experienced in perimetry operations and had undergone further training in administering OCCP in order to ensure the consistency of research protocols. Participants were positioned at the proper 50 cm viewing distance for this size screen prior to the test beginning. There was a patch on one eye. A skilled optometrist oversaw the examination and corrected the subject’s height and head posture. The in-clinic OCCP testing was used to train patients for their at-home testing.
At Home Testing
At 1 week following the baseline visit, and then at 3 and 6 months, participants were asked to perform at-home perimetry. Patients took the OCCP exam at home using their own laptop or personal computer. The research team offered video calls for distance surveillance and phone training, which the participant might request. Subsequent to performing the final OCCP examination, a use-experience survey was completed online (Table 1).
 |
Figure 1 Study protocol. |
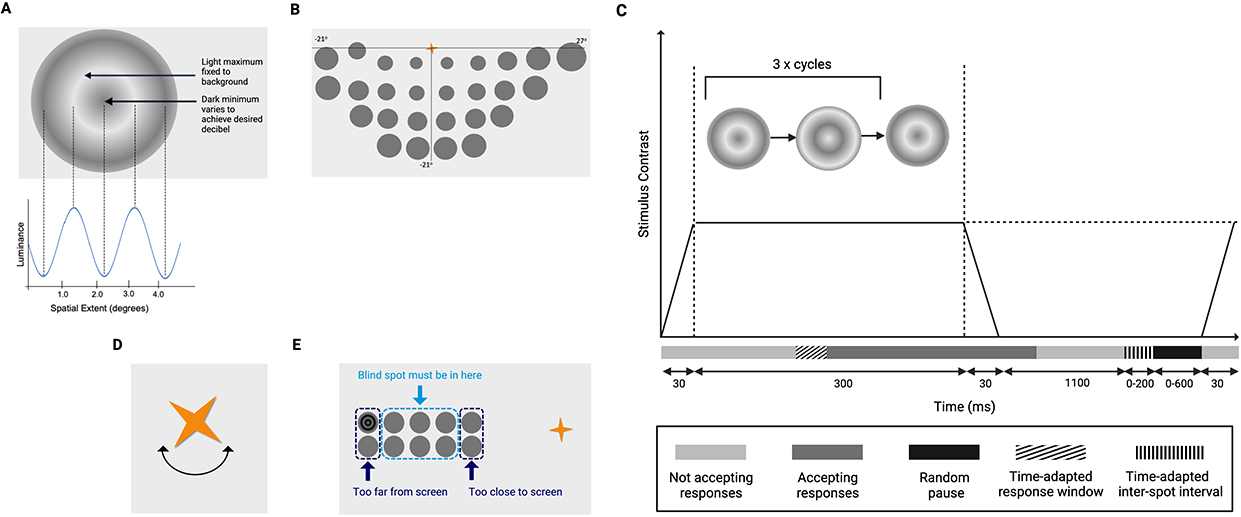 |
Figure 2 Online circular contrast perimetry features. (A) Flickering test target (B) Map of inferior hemifield 24-2 perimetry loci testing. To test the superior hemifield, the fixation target later moves to the bottom of the screen. (C) Sequence of target presentation: targets appear for 3 counterphase flicker cycles lasting 360 ms, contrast is graded at the start/end of target presentation. ms: millisecond. Adapted by permission from BMJ Publishing Group Limited. Alawa KA, Nolan RP, Han E, et al. Low-cost, smartphone-based frequency doubling technology visual field testing using a head-mounted display. Br J Ophthalmol. 2021;105(3):440–444.17 (D) Fixation target: spinning golden star. (E) Blind spot localisation optimizes the user’s viewing distance. (B) and (E). The dark grey homogenous circles are a diagrammatic representation of where test targets may appear and are not present during the live test. |
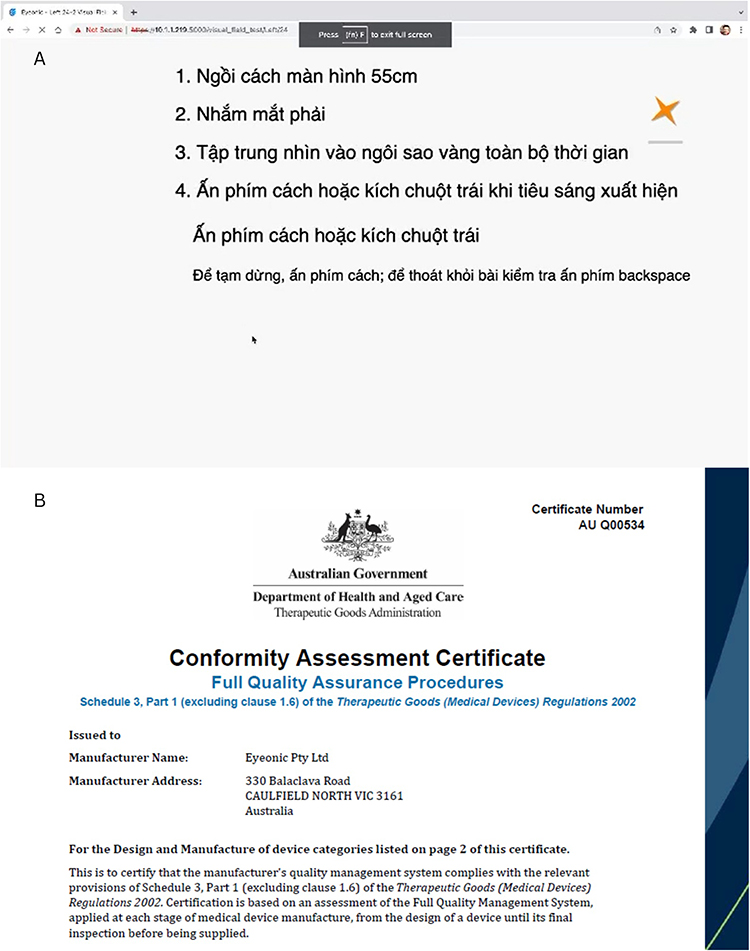 |
Figure 3 (A) Example of Vietnamese pre-test instructions, translated to: 1. Please sit 55 cm from the screen. 2. Close your right eye. 3. Press space bar or click the mouse button when the target appears. 4. Press space or click the mouse button to begin. To pause press “return”, to abort press “delete”. (B) Conformity assessment by Australian Government Department of Health and Aged Care. |
 |
Figure 4 Bland-Altman Plot for MD (A), PSD (B), VI (C) between OCCP in clinic and at home at baseline. |
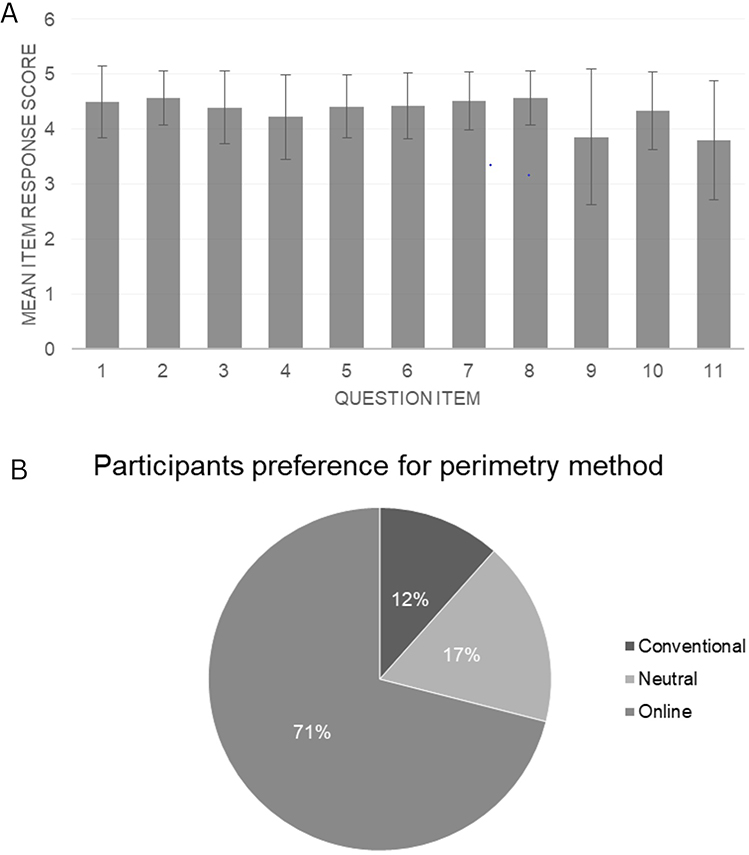 |
Figure 5 Patient attitude towards home-monitoring visual field; (A) Question item 1–11; (B) Question item Q1. |
 |
Table 1 Participant Survey Questions for the Home-Monitoring Online Circular Contrast Perimetry |
Online Circular Contrast Perimetry
A recent paper has described the OCCP technology.18 Using a web browser, OCCP provides perimetry on any tablet or computer. Like Pulsar Perimetry (Haag-Streit International), targets are alternating rings of dark and light spaced at six degree intervals (Figure 2A), however the targets are smaller (3.5 vs 5 degrees) and contrast is constant throughout their spatial extent, despite a peripheral contrast decrease to minimize light scatter and unwanted ganglion cell stimulation.19 The OCCP evaluates 52 loci over 24 degrees of peripheral vision (Figure 2B). Each target flickers for 60 milliseconds during three on/off cycles for a total of 360 milliseconds. The sinusoidal contrast of targets has 0.55 cycles/degree spatial frequency, like frequency doubling perimetry (FDP, Welch Allyn, Skaneateles, N.Y., and Carl Zeiss Meditec, Dublin, Calif.); however, there is a slower temporal counter phase (9 Hz).20 Contrast is linearly ramped up and down over 50 milliseconds at the start and finish of target presentations to avoid temporal transients and saccades (Figure 2C).21 While FDP target bands’ luminance to have a combined mean equal to background luminance, in OCCP the bright rings match the color of the background screen, which is light grey, and the dark rings’ intensity is modified to achieve the necessary contrast. This is like a luminance pedestal flicker for stimulus decrements, and is used by OCCP to restrict the number of greyscale colors used in the stimulus and background, to maintain consistency of display settings with gamma correction.22
The user is asked by the app to increase the screen brightness to at least 75%, representing at least 186 candela per square meter (cd/m2). The output luminance ranged from 0% for black (0, 0, 0) to 100% relative brightness percentage for pure white (255, 255, 255). The Web Content Accessibility Guidelines was used to determine the relative brightness at each 256-greyscale level.23 The Michaelson formula was used to quantify the contrast of the relative luminance of the target rings in the light and dark bands:24

Where RL2 is the minimum of the dark band and RL1 is the greatest relative brightness of the light band. A method similar to that employed for FDP was applied to convert contrast to decibels.20

OCCP’s dynamic range was 0 to 38 dB, comparable to the range used by other perimetry devices, such as HFA, to facilitate human threshold calculations.7 The OCCP testing algorithm uses a 4/2 dB staircase in combination with probability density functions that modify based on test responses, similar to SITA.
Users are asked to click the mouse whenever a target appeared in their peripheral vision while maintaining fixation on a constantly spinning golden star (4 degrees of visual angle) (Figure 2D). A dynamic fixation target can potentially facilitate improved focus and test usability.
Clicks made outside the allowed response timeframe were used to identify FP. Similar to SAP, FN responses were observed in loci of pre-determined threshold sensitivity when participants failed to respond to stimuli at higher contrast.25 Responses were time-adapted based on the user’s previous reaction time to provide for inter-user variability; to prevent rhythmic responses random delays were also added.26 Like for SAP, FL were measured using the Heijl-Krakau method.
Correct viewing distance is maintained by three mechanisms working together. Firstly, the app instructs users on the proper viewing distance to use the test, to guarantee uniformity of viewing angles. This distance is calculated trigonometrically based on the size of the computer monitor. Secondly, a 4 × 10-degree grid covering the predicted blind region – predicted at 15 degrees temporal and 0.5 degrees inferior to fixation – is used to map out the user’s blind spot (Figure 2E). Blind spot mapping ensures an acceptable working distance; if the user is too far from the screen and the blind spot detected too far temporally, the user is prompted to come closer to the screen, and vice versa if they are too close. Thirdly, the user’s head position is tracked by a webcam to ensure that the proper viewing distance is maintained. This relies on the app’s machine learning-powered facial detection (as opposed to identification) algorithm, with a one-second refresh rate. When the machine-learning discovers deviations in face position of more than 15% in four planes, the test pauses and the participant is told to correct their position; once corrected, the test proceeds. In this way, no specific head or neck support is used.
The app has been designed to provide consistency despite variations in screen brightness. It achieves this in the choice of fundamental physiological parameters for the perimetric testing. Flickering dark targets on a light grey background provide increased resistance to changes in background lighting.20 As the screen is bright, background lighting influences the test less than for a dark screen. The targets are large, flickering and contrast-based; changes in overall screen brightness would affect the dark and light bands equally and be less influential than for standard white-on-white targets, for which the background is used for target contrast calculation. Test properties such as spatial frequency, target size, flicker rate and background luminance have all been carefully chosen to maximize testing consistency despite differences in testing environments, computer screen output displays and gamma function.27 These parameters have been chosen based on a critical literature review, early pilot OCCP work and subsequent use-based refinement as documented in our previous publications.28–31 The app measures the screen size and positions the targets according to the size; it also advises the correct viewing distance based on this. Furthermore, to deal with persistent inter-screen variations, the app undergoes an internal calibration process based on early responses, and, if available, prior test information, either on that screen or on another screen by that patient.
Although the application has several language options, the spoken Vietnamese instructions (1. Sit 55 cm from the monitor; 2. Close your right eye; 3. Watch the gold star at all times; 4. Press “space” or click mouse when target appears; Press “space” or click mouse to begin …; To pause press “return”; to exit press “delete”) from OCCP were recorded previously (Figure 3A). OCCP has recently been assessed for quality assurance by Australian Government Department of Health and Aged Care (Figure 3B).
Study Outcomes
The following outcome measures for OCCP were derived using information from a pre-existing normative dataset and SAP-specific methods: Mean Deviation (MD), Pattern Standard Deviation (PSD), and Visual Index (VI), which is based on a weighed mean system similar to the visual field index (VFI).32 The secondary outcome measures also included the length of the perimetric test, and reliability criteria (FP, FN, and FL rates), as well as responses from the use-experience feedback survey.
Feedback Survey
The survey was designed by the chief investigator to capture the experience of home perimetry, based on evaluations of other home perimetry devices and similar studies evaluating OCCP in an Australian cohort.12 Eleven questions were asked regarding home perimetry experience, with one additional question related to the participant’s preference for either form of perimetry (Table 1). There was also an optional textbox for common reasons for not completing all tests. A Likert scale was used for responses: “strongly disagree”, “disagree”, “neutral”, “agree”, or “strongly agree”, corresponding from 1 to 5. Participants anonymously completed the survey. A password-protected database was used to securely store all data.
Data Analysis
Descriptive and inferential statistical analyses were performed. The data was analyzed using SPSS 23 and Stata. Descriptive statistics included frequency, percentage (qualitative measurements) and mean and standard deviation (quantitative measures). For statistical comparison testing, Bland-Altman plots, paired sign-rank tests, and intraclass correlation coefficient (ICC) were employed. A cutoff point for statistical significance of p < 0.05 was applied. For descriptive statistics, T-tests were used for continuous variables and Chi-squared tests used for categorical variables. ICCs were defined as excellent (≥0.90); good (0.75 to 0.9); moderate (0.5 to 0.75); or poor (<0.5).33 Sample size was calculated based on the ICC of test–retest agreement of OCCP MD in an East Asian cohort of 0.86 (95% CI 0.78–0.91).34 With an alpha of 0.05, a type 2 error rate of 0.05 and an expected 50% dropout, this gave a sample size of 36.
Rasch Analysis
The psychometric properties of the survey were evaluated with Rasch analysis, using the Andrich rating model via Winsteps software (Chicago, Illinois, USA).35–37 Differential item functioning (DIF) assessed differences in responses based on clinical group (controls vs glaucoma), gender and age stratification: younger (age < 45 years) and older (age ≥ 45 years).
Results
Thirty five patients were enrolled in the study. Demographic and clinical characteristics of the study population were demonstrated in Table 2. The average age of the participants was 40.1 years old, and the glaucoma group was older than the non-glaucoma group (p < 0.001). There was no significant difference between visual acuity and intraocular pressure of glaucoma and non-glaucoma groups. However, the non-glaucoma group had a more myopic refraction than the glaucoma group (p = 0.005).
 |
Table 2 Demographic Characteristics of Study Population |
The number of patients and eyes that completed the baseline, 3-month and 6-month at-home assessments are shown in Table 3.
 |
Table 3 Number of Patients and Eyes Over 6 months |
There was no significant difference between testing duration, FN and FL rates of OCCP in clinic and OCCP at home. FP rates of OCCP at home were higher than that of OCCP in clinic (p = 0.04) (Table 4).
 |
Table 4 Comparison of Time and Reliable Indices Between OCCP at Clinic and at Home at Baseline |
Bland-Altman plots indicated a small difference between MD (A) of OCCP in clinic versus OCCP at home (mean difference 1.26 dB, lower LoA −9.17 dB, upper LoA 11.7 dB, p = 0.0087, Figure 4). There was no significant difference between PSD (B) and VI (C) of OCCP in clinic and OCCP at home were significant (PSD mean difference 0.68, lower LoA - 9.71 dB, upper LoA 11.07 dB, p = 0.6118; VI mean difference 2.04 dB, lower LoA - 17.74 dB, upper LoA 21.83, p = 0.0723).
Intraclass correlation coefficient (ICC) analysis demonstrated good correlation of MD and VI as well as poor correlation of PSD between OCCP in clinic and OCCP at home (Table 5). Over 6 months, ICC analysis indicated excellent correlation of MD, good correlation of PSD and moderate correlation of VI generated from OCCP home monitoring.
 |
Table 5 ICC of OCCP in Clinic and OCCP at Home at Baseline (Inter-Rater Reliability), Using Two-Way Mixed-Effects Model |
Rasch Analysis
The survey results displayed a good fit to the Rasch model, with no evidence of multidimensionality or disordered thresholds. However, precision and targeting were suboptimal (person separation index 1.87 and person reliability 0.78), and item misfitting was observed for item 11. “I am not bothered by the webcam monitoring my face during the online test. (I understand the video is not saved and no facial recognition occurs).” Upon removal of question 11 and persons with extreme responses (ie those who responded 5 on the likert scale for all items, n = 13), person separation and person reliability indices improved to acceptable levels (1.99, 0.8); however, targeting was suboptimal (3.14, ideally −1 to 1), indicating the cohort was overall untroubled by the challenges assessed in the questionnaire. No DIF was detected for clinical group, or age, indicating that the survey responses were consistent for these groups; however, DIF was observed for item 1. “I was able to access the application at home via www.eyeonic.com” indicating that males had greater challenge with this than females. The common reasons for not completing all the tests were synthesized and outlined in Supplemental Table 1. Participants overall found it easy to perform the application at home and valued the opportunity for home perimetry (Figure 5A). They demonstrated a clear preference for online perimetry (Figure 5B).
Discussion
The current study introduced very first longitudinal data showing OCCP performance at home and attitude of an Asian population, to the best of our knowledge.
We found no significant difference between test duration, FN, FL, PSD, VI of OCCP in clinic and OCCP at home. At baseline, ICC analysis demonstrated good correlation of MD and VI between OCCP in clinic and OCCP at home. Over 6 months, ICC analysis indicated excellent correlation of MD, good correlation of PSD and moderate correlation of VI generated from home OCCP testing. However, Bland-Altman plots revealed a small difference between MD OCCP at home vs OCCP in clinic. Lack of supervision, home environmental distractions, and technical challenges might contribute to this finding. ICC analysis also showed a poor correlation between PSD OCCP at home vs OCCP in clinic. A poorer ICC was observed for in clinic vs at home PSD, compared to in clinic vs at home MD and VI/VFI, as well as all three global metrics at home over time. PSD is a less important metric than MD and VI/VFI; while MD and VI/VFI are better reflections of disease severity (they deteriorated as disease advances); PSD is a reflection deviation of localized scotomata from the normal pattern deviation map. With increasing disease severity, PSD will grow and subsequently shrink as the visual field loss becomes more complete. Small user errors in performing the OCCP can occasionally lead to spurious scotomata. If it is a true defect it tends to persist, but often it is a user-related error, present on the first OCCP performed but dissipates on subsequent OCCP VF tests as the patient becomes more accomplished at performing the test. These “learning artifacts” often result in small scotomata that tend to have a greater influence on PSD than MD or VI. That may be the reason why there is a poorer correlation of PSD for in clinic vs home (the first test is in clinic) which improves on subsequent testing (initial home vs subsequent home tests). Unfortunately, due to the high dropout rates, individual aberrant cases could significantly influence these results.
FPs were higher at home than in clinic (4.16 vs 3.19, p = 0.0403), while there was no significant difference in test timing, FN or FL. FPs occur when the patient clicks space bar or the mouse outside of the expected time window following presentation of the target – this window is user responsive and will expand or contract depending on the measured click response rate. This could be due to a lack of supervision or other environmental distractions at home vs in clinic. Further studies will evaluate how to best instruct patients for home perimetry on their own devices, to minimize user errors and maximize accuracy, and also evaluate if such errors diminish over time with increasing familiarity with home perimetry by patients. With increased familiarity with the test, as well as future improvements, the accuracy at home will approach that in clinic. Recently, the importance of the traditional reliability criteria used has been questioned;38 however, consistent with our previous studies, our view is that it is important to use orthodox metrics when evaluating new devices.18
Further refinement of outcomes will achieve more consistency in testing over time, which will lead to ongoing improvements in glaucoma diagnostic sensitivity. These improvements can be attributed to various factors, including improved patient cues and pre-test education, ongoing learnings from using OCCP in the clinic versus at home, and ongoing application of artificial intelligence to the testing and data analysis to reduce discrepancies between tests performed in clinic and at home to reduce discrepancies between tests performed in clinic and at home. Minor discrepancies in MD and PSD between OCCP in clinic and at home measurements were noted from the Bland Altman plots (Figure 4). However, as the application is refined and more data collected over time, supervised and unsupervised machine learning techniques can be used to refine the data and test performance, distinguishing true defects from use-related errors, improving the test reliability and repeatability over time and reducing FP rates.
Feedback analysis in our study showed potential outcomes over 11 question items, and more than 70% of participants preferring online field testing. No differential item functioning (DIF) was detected for clinical group or age. The survey found that males had more difficulty accessing the online application than females. Gender difference in accessing the online application could be an incidental finding. Technological familiarity, compliance might be the reason; still, the repeatability and reproducibility of this finding should be tested in other studies. A study of Meyerov also demonstrated that participants preferred OCCP across most questionnaire items compared to SAP (p < 0.0001).12 In comparison to the clinic-based version, this study shows that home-based OCCP tests can be acquired with acceptable reliability and precision. This marks a significant advancement in the successful performance of perimetry at home using a patient’s own device. It is also crucial to note that the opportunity for more frequent testing that comes with home-based testing can counteract any heterogeneity in that regard.4
Particularly in Asia, the continent with the majority of glaucoma prevalence worldwide, visual field testing is crucial for the detection and monitoring of glaucoma.39 Glaucoma progression will be detected through many tests after years. To detect a 1 dB advancement annually, it could take up to six years if a single test is conducted annually.40 Glaucoma deterioration could be found earlier within two years if patient has three tests annually.40 It is advised that six tests be carried out during the first two years following a definitive diagnosis in order to detect any deteriorating signs of visual field glaucoma.40 However, due to budgetary, staffing, and equipment constraints, most healthcare systems—including those in relatively developed economies—are unable to provide this level of care for all glaucoma patients.41 Less than 75% of glaucoma patients in nations like the USA have their visual fields assessed every year.41
There is evidence to support the idea that more frequent visual field tests conducted at home could identify deterioration early. A study by Anderson et al involved forty-three participants who had glaucoma, ocular hypertension or glaucoma suspect. Sensitivity of detecting −2 dB MD loss every year is 80% after 2.5 years of visual field testing performed every six months in clinic. Anderson et al found that a similar 80% sensitivity could be achieved with weekly home field test only after 0.9 years even when the compliance was 63%. These findings demonstrated how crucial routine field inspections are for shortening the time needed to detect visual field progression.2
According to a study of Prea, barriers to compliance of home visual field monitoring were information technology, logistical reasons, lack of motivation or competing life demands.5 In this current study, there was a significant drop-off rate of candidates (n = 23) performing home testing at the 3- and 6-month time points compared to baseline. Common reasons provided included not having enough time to complete the test and not having access to a computer. The latter reason is curious given they had access for the initial at home test – clearly some people’s access to computers is limited. These issues will have a profound impact on any successful home monitoring program. Access to computers with reliable internet (eg via a local hub) as well as proper education highlighting the importance of home-monitoring with visual fields in glaucoma management may be required.42 Rewards, reminders, and successful completion being linked to recompensation may be future strategies adopted to encourage faithful participation in home monitoring protocols.
Rasch analysis revealed an imperfect fit of the questionnaire results to the Rasch model. Overall, the cohort found few challenges with the home testing. While this was a strength for the application, it reduced the fitting of the questionnaire to the Rasch model, which works best when the items are appropriately targeted to discriminate multiple levels of ability in the cohort.36
The current study has some limitations. Any longitudinal study has dropout rates. However, there was no difference between the non-dropout and dropout individuals at six-month follow-up, suggesting that the missing data was less likely to impact the results. (Supplemental Table 2) As the confounding factor, age differences between the glaucoma and control groups were considerable; this is common in glaucoma cohort studies because glaucoma damage increases with age. The reliability of abnormality detection results may have been impacted by the control group’s lack of age, sex, and other relevant factor matching with the glaucoma group. Generalizability due to small sample, potential biases introduced by dropout, the lack of control for different home environments and device settings might also be influence our results. The selection of participants from a single practice may be a drawback, although this is compensated by numerous international OCCP researches. We were able to gather a study population that was comparable in size to previous home-monitoring studies (Jones et al, 20 participants;4 Chia et al, 20 subjects,10 Tsapakis et al, 10 patients6) with a suitable timeframe, despite the difficulties associated with home monitoring in general and recruiting specifically for studies in developing countries. This allowed us to create the first home-monitoring database in Asian individuals for OCCP.
In conclusion, comparable results were observed between OCCP in the clinic and OCCP at home. Additionally, acceptable consistency of OCCP home-monitoring findings over 6 months was recognized. Participants found OCCP easy to use in the home environment on their personal devices; however, the majority failed to complete the 3- and 6-month testing. While demonstrating some potential, further refinements and larger studies are needed before OCCP can be widely implemented for clinic and home monitoring.
Abbreviations
MD, Mean Deviation; PSD, Pattern Standard Deviation; VFI, Visual Field Index; VI, Visual Index.
Data Sharing Statement
Data and materials are provided on reasonable request.
Ethics Approval and Informed Consent
The study was ethically approved by Hanoi Medical University (IRB-VN01001). Consent form was obtained from participants.
Funding
There is no funding to report.
Disclosure
A/Prof Simon Skalicky is the director of Eyeonic Pty Ltd, which owns patent WO2021051162A1 regarding online circular contrast perimetry. The authors report no other conflicts of interest in this work. Tung Thanh Hoang and Tung Quoc Mai share the co-first authorship.
References
1. Brandão-de-Resende C, Alcântara LAR, Vasconcelos-Santos DV, Diniz-Filho A. Glaucoma and Telemedicine. J Glaucoma. 2023;32(5):327–332. doi:10.1097/IJG.0000000000002200
2. Anderson AJ, Bedggood PA, George Kong YX, Martin KR, Vingrys AJ. Can Home Monitoring Allow Earlier Detection of Rapid Visual Field Progression in Glaucoma? Ophthalmology. 2017;124(12):1735–1742. doi:10.1016/j.ophtha.2017.06.028
3. Hu GY, Prasad J, Chen DK, Alcantara-Castillo JC, Patel VN, Al-Aswad LA. Home Monitoring of Glaucoma Using a Home Tonometer and a Novel Virtual Reality Visual Field Device: acceptability and Feasibility. Ophthalmol Glaucoma. 2023;6(2):121–128. doi:10.1016/j.ogla.2022.05.001
4. Jones PR, Campbell P, Callaghan T, et al. Glaucoma Home Monitoring Using a Tablet-Based Visual Field Test (Eyecatcher): an Assessment of Accuracy and Adherence Over 6 Months. Am J Ophthalmol. 2021;223:42–52. doi:10.1016/j.ajo.2020.08.039
5. Prea SM, Kong GYX, Guymer RH, Uptake VAJ. Persistence, and Performance of Weekly Home Monitoring of Visual Field in a Large Cohort of Patients With Glaucoma. Am J Ophthalmol. 2021;223:286–295. doi:10.1016/j.ajo.2020.10.023
6. Tsapakis S, Papaconstantinou D, Diagourtas A, et al. Home-based visual field test for glaucoma screening comparison with Humphrey perimeter. Clin Ophthalmol. 2018;12:2597–2606. doi:10.2147/OPTH.S187832
7. Kong YX, He M, Crowston JG, Vingrys AJ. A Comparison of Perimetric Results from a Tablet Perimeter and Humphrey Field Analyzer in Glaucoma Patients. Transl Vis Sci Technol. 2016;5(6):2. doi:10.1167/tvst.5.6.2
8. Arai K, Nishijima E, Ogawa S, et al. A Novel Visual Field Screening Program for Glaucoma With a Head-Mounted Perimeter. J Glaucoma. 2023;32(6):520–525. doi:10.1097/IJG.0000000000002199
9. Wang B, Alvarez-Falcón S, El-Dairi M, Freedman SF. Performance of virtual reality game-based automated perimetry in patients with childhood glaucoma. J Aapos. 2023;27(6):325.e321–325.e326. doi:10.1016/j.jaapos.2023.08.014
10. Chia ZK, Kong AW, Turner ML, et al. Assessment of Remote Training, At-Home Testing, and Test-Retest Variability of a Novel Test for Clustered Virtual Reality Perimetry. Ophthalmol Glaucoma. 2023;7(2):139–147. doi:10.1016/j.ogla.2023.08.006
11. Phu J, Kalloniatis M. Comparison of 10-2 and 24-2C Test Grids for Identifying Central Visual Field Defects in Glaucoma and Suspect Patients. Ophthalmology. 2021;128(10):1405–1416. doi:10.1016/j.ophtha.2021.03.014
12. Meyerov J, Deng Y, Busija L, Skalicky SE. Circular Contrast Perimetry via Web Application: a Patient Appraisal and Comparison to Standard Automated Perimetry. Ophthalmol Sci. 2022;2(3):100172. doi:10.1016/j.xops.2022.100172
13. Meyerov J, Chen Y, Busija L, Green C, Skalicky SE. Repeatability of Online Circular Contrast Perimetry Compared to Standard Automated Perimetry. J Glaucoma. 2024;33(7):505–515. doi:10.1097/IJG.0000000000002384
14. Chylack Jr LT, Wolfe JK, Singer DM, et al. The Lens Opacities Classification System III. The Longitudinal Study of Cataract Study Group. Arch Ophthalmol. 1993;111(6):831–836. doi:10.1001/archopht.1993.01090060119035
15. Gedde SJ, Vinod K, Wright MM, et al. Primary Open-Angle Glaucoma Preferred Practice Pattern®. Ophthalmology. 2021;128(1):P71–p150. doi:10.1016/j.ophtha.2020.10.022
16. Heijl A, Krakau CE. An automatic static perimeter, design and pilot study. Acta Ophthalmol. 1975;53(3):293–310. doi:10.1111/j.1755-3768.1975.tb01161.x
17. Alawa KA, Nolan RP, Han E, et al. Low-cost, smartphone-based frequency doubling technology visual field testing using a head-mounted display. Br J Ophthalmol. 2021;105(3):440–444. doi:10.1136/bjophthalmol-2019-314031
18. Meyerov J, Deng Y, Busija L, Bigirimana D, Skalicky SE. Online Circular Contrast Perimetry: a Comparison to Standard Automated Perimetry. Asia Pac J Ophthalmol. 2023;12(1):4–15. doi:10.1097/APO.0000000000000589
19. Zeppieri M, Brusini P, Parisi L, Johnson CA, Sampaolesi R, Salvetat ML. Pulsar perimetry in the diagnosis of early glaucoma. Am J Ophthalmol. 2010;149(1):102–112. doi:10.1016/j.ajo.2009.07.020
20. Swanson WH, Horner DG, Dul MW, Malinovsky VE. Choice of Stimulus Range and Size Can Reduce Test-Retest Variability in Glaucomatous Visual Field Defects. Transl Vis Sci Technol. 2014;3(5):6. doi:10.1167/tvst.3.5.6
21. Johnson CA, Cioffi GA, Van Buskirk EM. Frequency doubling technology perimetry using a 24--2 stimulus presentation pattern. Optom Vis Sci. 1999;76(8):571–581. doi:10.1097/00006324-199908000-00026
22. Anderson AJ, Vingrys AJ. Interactions between flicker thresholds and luminance pedestals. Vision Res. 2000;40(19):2579–2588. doi:10.1016/S0042-6989(00)00121-8
23. W3. Guidelines WCA. Available from: https://www.w3.org/WAI/GL/wiki/Relative_luminance.
24. Campbell FW, Green DG. Optical and retinal factors affecting visual resolution. J Physiol. 1965;181(3):576–593. doi:10.1113/jphysiol.1965.sp007784
25. Bengtsson B, Heijl A. False-negative responses in glaucoma perimetry: indicators of patient performance or test reliability? Invest Ophthalmol Vis Sci. 2000;41(8):2201–2204.
26. Mulholland PJ, Redmond T, Garway-Heath DF, Zlatkova MB, Anderson RS. Spatiotemporal Summation of Perimetric Stimuli in Early Glaucoma. Invest Ophthalmol Vis Sci. 2015;56(11):6473–6482. doi:10.1167/iovs.15-16921
27. Swanson WH, Dul MW, Horner DG, Liu T, Tran I. Assessing spatial and temporal properties of perimetric stimuli for resistance to clinical variations in retinal illumination. Invest Ophthalmol Vis Sci. 2014;55(1):353–359. doi:10.1167/iovs.13-11640
28. Skalicky SE, Bigirimana D, Busija L. Online circular contrast perimetry via a web-application: optimising parameters and establishing a normative database. Eye. 2022;2022:1–7.
29. Swanson WH, Dul MW, Fischer SE. Quantifying Effects of Retinal Illuminance on Frequency Doubling Perimetry. Invest Ophthalmol Visual Sci. 2005;46(1):235–240. doi:10.1167/iovs.04-0264
30. Anderson RS, Redmond T, McDowell DR, Breslin KM, Zlatkova MB. The robustness of various forms of perimetry to different levels of induced intraocular stray light. Invest Ophthalmol Vis Sci. 2009;50(8):4022–4028. doi:10.1167/iovs.08-2934
31. Horner DG, Dul MW, Swanson WH, Liu T, Tran I. Blur-resistant perimetric stimuli. Optom Vis Sci. 2013;90(5):466–474. doi:10.1097/OPX.0b013e31828fc91d
32. Skalicky SE, Bigirimana D, Busija L. Online circular contrast perimetry via a web-application: optimising parameters and establishing a normative database. Eye. 2022;37(6):1184–1190. doi:10.1038/s41433-022-02085-4
33. Koo TK, Li MY. A Guideline of Selecting and Reporting Intraclass Correlation Coefficients for Reliability Research. J Chiropr Med. 2016;15(2):155–163. doi:10.1016/j.jcm.2016.02.012
34. Hoang TT, Mai TQ, Pham DT, et al. Glaucoma Clinic Monitoring Over 6 Months Using Online Circular Contrast Perimetry in Comparison with Standard Automatic Perimetry: the Developing-World Setting. Clin Ophthalmol. 2024;18:3767–3780. doi:10.2147/OPTH.S496728
35. Linacre J. A User”s Guide to Winsteps: rasch-Model Computer Program. 2002.
36. Khadka J, Gothwal VK, McAlinden C, Lamoureux EL, Pesudovs K. The importance of rating scales in measuring patient-reported outcomes. Health Qual Life Outcomes. 2012;10(1):80. doi:10.1186/1477-7525-10-80
37. Waterbury GT. Missing Data and the Rasch Model: the Effects of Missing Data Mechanisms on Item Parameter Estimation. J Appl Meas. 2019;20(2):154–166.
38. Tan JCK, Yohannan J, Ramulu PY, et al. Visual field testing in glaucoma using the Swedish Interactive Threshold Algorithm. Surv Ophthalmol. 2024;70(1):141–152. doi:10.1016/j.survophthal.2024.09.005
39. Tham YC, Li X, Wong TY, Quigley HA, Aung T, Cheng CY. Global prevalence of glaucoma and projections of glaucoma burden through 2040: a systematic review and meta-analysis. Ophthalmology. 2014;121(11):2081–2090. doi:10.1016/j.ophtha.2014.05.013
40. Che Hamzah J, Daka Q, Azuara-Blanco A. Home monitoring for glaucoma. Eye. 2020;34(1):155–160. doi:10.1038/s41433-019-0669-7
41. Stagg BC, Stein JD, Medeiros FA, et al. The Frequency of Visual Field Testing in a US Nationwide Cohort of Individuals with Open-Angle Glaucoma. Ophthalmol Glaucoma. 2022;5(6):587–593. doi:10.1016/j.ogla.2022.05.002
42. Spaulding EM, Miller HN, Metlock FE, et al. Leveraging community Wi-Fi and spaces for digital health use. Front Public Health. 2024;12:1. doi:10.3389/fpubh.2024.1418627
 © 2025 The Author(s). This work is published and licensed by Dove Medical Press Limited. The
full terms of this license are available at https://www.dovepress.com/terms.php
and incorporate the Creative Commons Attribution
- Non Commercial (unported, 4.0) License.
By accessing the work you hereby accept the Terms. Non-commercial uses of the work are permitted
without any further permission from Dove Medical Press Limited, provided the work is properly
attributed. For permission for commercial use of this work, please see paragraphs 4.2 and 5 of our Terms.
© 2025 The Author(s). This work is published and licensed by Dove Medical Press Limited. The
full terms of this license are available at https://www.dovepress.com/terms.php
and incorporate the Creative Commons Attribution
- Non Commercial (unported, 4.0) License.
By accessing the work you hereby accept the Terms. Non-commercial uses of the work are permitted
without any further permission from Dove Medical Press Limited, provided the work is properly
attributed. For permission for commercial use of this work, please see paragraphs 4.2 and 5 of our Terms.