")
Back to Journals » Journal of Inflammation Research » Volume 17
High Humidity Alters Myeloid-Derived Suppressor Cells in Spleen Tissue: Insights into Rheumatoid Arthritis Progression
Authors Wang H, Wang M, Wang T, Li X, Wen C, He Z, Huang L
Received 2 September 2024
Accepted for publication 21 November 2024
Published 26 November 2024 Volume 2024:17 Pages 9805—9822
DOI https://doi.org/10.2147/JIR.S490860
Checked for plagiarism Yes
Review by Single anonymous peer review
Peer reviewer comments 2
Editor who approved publication: Professor Ning Quan
Hongli Wang,1,2,* Mingzhu Wang,1,2,* Tengyue Wang,1,2 Xuanlin Li,1,2 Chengping Wen,1,2 Zhixing He,1,2 Lin Huang1,2
1Research Institute of Chinese Medical Clinical Foundation and Immunology, School of Basic Medical Science, Zhejiang Chinese Medical University, Hangzhou, 310053, People’s Republic of China; 2Key Laboratory of Chinese Medicine Rheumatology of Zhejiang Province, Zhejiang Chinese Medical University, Hangzhou, 310053, People’s Republic of China
*These authors contributed equally to this work
Correspondence: Lin Huang; Zhixing He, College of Basic Medical Science, Zhejiang Chinese Medical University, 548 Binwen Road, Binjiang District, Hangzhou, People’s Republic of China, Email [email protected]; [email protected]
Background: Rheumatoid arthritis (RA) is an autoimmune disease characterized by joint inflammation and bone destruction, leading to severe complications. Previous research has suggested that high humidity conditions may exacerbate RA, however, the underlying mechanisms remain unclear. Furthermore, there is a lack of evidence linking humidity to the worsening of RA symptoms in animal models.
Methods: The Collagen-induced arthritis (CIA) mouse model was established using C57BL/6 mice. The arthritis status of the mice was evaluated under two distinct humidity conditions (50% and 80%). The aim of the present study was to investigate the impact of elevated humidity levels on the types of splenic cells present using mass spectrometry flow. Additionally, the study utilized MDSCs, which are significantly upregulated by high humidity, to assess the levels of oxidative stress and conducted mRNA sequencing of sorted MDSCs to investigate their impact on arthritis in CIA mice.
Results: Compared to normal humidity, high humidity exacerbated arthritis incidence in mice, resulting in increased arthritis scores, swelling, serum autoantibodies (anti-COII and anti-CCP), and upregulation of pro-inflammatory cytokines. Significant variations were observed in the spleen index under high humidity condition, accompanied by noticeable inflammatory alterations. Moreover, elevated humidity levels induced a substantial modulation in MDSCs population in the spleen of CIA mice, along with alterations in oxidative stress markers such as heightened serum ROS levels, and increased expression of COX, SOD, and Nrf2 mRNA. Following successful sorting of MDSCs, mRNA sequencing revealed a decrease in the expression of Rap1 signaling pathway under high humidity environment, which may contribute to the increase of MDSCs cells and aggravate the progression of RA disease.
Conclusion: A comprehensive analysis of the available data reveals a detrimental impact of high humidity on MDSCs numbers within spleen tissue, with potential implications for the development of RA.
Keywords: rheumatoid arthritis, high humidity environment, myeloid-derived suppressor cells, Rap1 signaling pathway
Background
Rheumatoid arthritis (RA) is a chronic systemic autoimmune disease of unknown etiology, characterized by inflammation that affects joints and extra-articular structures. This condition typically leads to inflammation and bone destruction in multiple joints, resulting in long-term disability and significantly impacting patients’ the quality of life.1–3 RA affects approximately 0.5–1% of the global population, making it a prevalent cause of severe disability.4,5 The exact cause of RA remains unclear, but it is believed to involve genetic,6 autoimmune,7 and environmental factors.8 Environmental factors such as cigarette smoke,9 gut microbiota,10 diet,11 and weather fluctuations have been shown to influence the development and progression of RA.12–15 However, the impact of humidity on RA is not well-studied.
Myeloid-derived suppressor cells (MDSCs) are heterogeneous immature myeloid cells with immunosuppressive functions that regulate immune responses.16 They accumulate at sites of inflammation in autoimmune diseases like RA and are thought to play a role in disease pathogenesis.17 MDSCs have been shown to have both anti-inflammatory and pro-inflammatory effects in RA and animal models of RA.18,19 However, the specific mechanism by which MDSCs contribute to RA, particularly in high humidity environments remain unknown.
Our study sought to explore the impact of high humidity on the functionality of MDSCs in mice and elucidate the mechanism through which it exacerbates RA. By unraveling this mechanism, we aim to provide new insights into the pathogenesis of RA and potentially unveil novel strategies for immunotherapy in RA.
Materials and Methods
Animals
This study utilized male C57BL/6 mice procured from Slac in Shanghai (4 weeks old with a body weight of 13±2g). Upon arrival, all mice were housed in our animal facility for one week to acclimate to their new environment. Subsequently, the mice were randomly allocated to various groups within the SPF environment of the Experimental Animal Research Center at Zhejiang Chinese Medical University.
The process for organizing the mice into experimental groups based on weight and randomization is as follows: Initially, all mice were numbered according to their body weight, with the sequence corresponding to the order of their weights. A computer-generated random number table was then used to create a random number sequence equal in length to the total number of mice, which was sorted in ascending order. The sorted random numbers were matched with the mouse numbers to allocate them to four experimental groups, ensuring that the distribution was even. Finally, the mice were randomly divided into four groups as follows: (1) CT group: blank group with 50%±5% humidity; (2) CTCIA group: CIA model group exposed to 50%±5% humidity; (3) HT group: blank group exposed to 80%±5% humidity; (4) HTCIA group: CIA model group exposed to 80%±5% humidity. To achieve the desired humidity levels, humidity chambers were utilized to create the appropriate conditions (Supplementary Figure 1).
The mice were housed in a climatic chamber (Ningbo Jiangnan Instrument Factory, China) that maintained a controlled temperature of 25±1°C, relative humidity of 50±5% or 80%±5%, and a light/dark cycle of 12 hours. Throughout the study, the mice had free access to food and water in the climatic chamber. A one-week acclimatisation period was required prior to the commencement of the experiment to ensure that the mice were able to adapt to the feeding conditions.
Following the induction of anesthesia with 4% isoflurane, retroorbital blood samples were obtained. Subsequently, the mice were euthanized via CO2 inhalation. All experimental procedures were conducted in accordance with the guidelines of the China Council on Animal Care and Use (CCAC).
Collagen-Induced Arthritis (CIA) Model
On Day 0 of the CIA model, 10 mg of chicken type II collagen (Chondrex, USA) was completely dissolved in 2.5 mL of 0.05 Macetic acid. This solution was then emulsified with an equal volume of complete Freund’s adjuvant (CFA; Chondrex, USA). Mice were then subcutaneously injected with 0.1 mL of the chicken type II collagen emulsion, with 0.05 mL administered on each side. On Day 21, mice were underwent a rechallenge process. They were intradermally injected with 0.1 mL of chicken type II collagen emulsion, which was emulsified with incomplete Freund’s adjuvant (IFA; Chondrex, USA).20 Similar to the initial injection, 0.05 mL was administered on each side.
Assessment of Symptoms of Arthritis
Symptoms of arthritis were evaluated based on joint pain and ankle joint swelling. A scoring system was employed, which encompassed various levels ranging from 0 to 4. The scoring criteria were as follows: 0 points indicated the absence of local redness or swelling, 1 point indicated the presence of finger joint swelling, 2 points indicated mild swelling of ankle or wrist joints, 3 points indicated severe swelling affecting the entire foot and toes, and 4 points indicated stiffness or deformation of the toes. To quantify ankle swelling, claw volume was measured using the YSC-7C claw volume meter (Shandong Medical Academy, Jinan, China). This instrument allowed for an objective assessment of the extent of swelling in the ankles.
Measurement of Serum Autoantibodies and Pro-Inflammatory Cytokines
On day 60 of the experiment, C57BL/6 mice were euthanized. The collected blood samples were allowed to clot at room temperature for 1 hour. After clotting, the serum was separated by centrifugation at 1200g for 15 minutes and stored at −80°C for further analysis.
To assess the levels of inflammatory cytokines in the serum, ELISA assay kits for various markers were utilized, such as mouse serum anti-COII, anti-CCP, IL-6, IL-17, IL-1β, etc. These ELISA assay kits were obtained from CUSABIO (Wuhan, China). The analysis involved measuring the absorbance at 450nm, which allowed for the quantification of the respective cytokines in the serum samples.
Detection of Spleen Index
After euthanasia, the spleens of C57BL/6 mice were carefully dissected and weighed. The splenic index was calculated by dividing the spleen weight (in milligrams) by the body weight (in grams), resulting in the ratio expressed as mg/g.21
Hematoxylin Eosin Staining
The spleen was fixed in solution containing 4% paraformaldehyde. After fixation, the spleen samples underwent a series of steps including dehydration, transparentization, embedding, and sectioning. The resulting sections had a thickness of approximately 4 μm. To prepare the sections for staining, the samples were incubated in a 60°C oven for 2 hours. Subsequently, the sections were deparaffinized using xylene, with each step lasting for 15 minutes. Then, different concentrations of ethanol (absolute ethanol, 95% ethanol, 90% ethanol, 80% ethanol, 70% ethanol) were used for hydration, with each concentration being applied for 2 minutes.
The sections were then stained with hematoxylin for 5 minutes, followed by a water wash for 1 minute. To differentiate the staining, the sections were immersed in 1% hydrochloric acid ethanol for 20 seconds and rinsed with water for 1 minute. Counterstaining was performed using eosin for 3 minutes. After counterstaining, the sections underwent dehydration and transparentization using different concentrations of ethanol (95% ethanol, absolute ethanol) and xylene. Finally, the sections were incubated in a 60°C oven for approximately 10 minutes.
Regarding the paws of the euthanized mice, they were fixed in 10% neutral buffered formalin. Subsequently, decalcification was performed using a 10% EDTA solution for a period of one month. After decalcification, the same procedures as mentioned above for spleen H&E staining were carried out on the paw samples.
Measurement of Arginase Activity
Arginase activity was measured at 1×10^6 using a L-arginase activity detection kit (Sigma-Aldrich) as per the manufacturer’s instructions to quantify cellular activity.
Isolation of RNA and Real-Time Quantitative PCR Analysis
Real-time PCR analysis was performed to detect the expression of oxidative stress response indicators and inflammatory cytokine indicators. Total RNA was isolated using Trizol reagent (Accurate Biology, Hunan, China) and reverse-transcribed into cDNA using the Prime Script RT Kit (Accurate Biology, Hunan, China) according to the manufacturer’s instructions. For real-time PCR, SYBR Premix Ex TaqTM reagent (Accurate Biology, Hunan, China) was used with a final reaction volume of 20 μL containing 1x SuperMix, cDNA, and 0.5 mm forward and reverse primers. All experiments were conducted in triplicate and repeated three times. The primers for real-time fluorescence quantitative PCR are listed in Supplementary Table 1. The expression levels and results of target genes were normalized to β-actin expression.
Immunohistochemistry
The spleen tissue fixed in a 4% formaldehyde solution was dehydrated, clarified, and embedded in paraffin. After preheating, dewaxing, hydration, antigen retrieval, and sealing, the sections were incubated and then incubated with streptavidin-peroxidase solution. DAB chromogenic solution was added, and the slices were washed with tap water to stop the coloration. After counterstaining with hematoxylin for 5 minutes, the slices were washed with tap water again, followed by recovery of the blue color with PBS solution, dehydration, air-drying, and mounting. The Image-pro Plus software was used to calculate the IOD and the mean optical density value (mean density) of the anode portion, represented as IOD/area.
Immunofluorescence
Following the collection of spleen tissue, the samples were fixed, dehydrated, and embedded, with the deparaffinization step performed similarly to the HE staining procedure. The specimens were then incubated with rat anti-CD11b and rabbit anti-Ly6G overnight at 4°C. The following day, the samples were reheated for 20 minutes at 37°C, washed three times with phosphate-buffered saline, and subsequently incubated at 37°C for 40 minutes with secondary antibodies conjugated with PE fluorescent dye. After three washes with phosphate-buffered saline, the specimens were incubated at 37°C for 40 minutes with secondary antibodies conjugated with FITC fluorescent dye. Following three washes with phosphate-buffered saline, the samples were observed under a fluorescence microscope.
Flow Cytometry
The spleen was dissected, rinsed with buffer, a small piece of spleen tissue was aseptically cut, placed in a filter, and 1 mL of RPMI-1640 medium was added. The tissue was minced rapidly with a 5 mL syringe, and the prepared cell suspension was transferred to a centrifuge tube, centrifuged at 350×g for 5 min, the supernatant was discarded, 1 mL of red blood cell lysis buffer was added, and left at room temperature for 1 min. Then, 3 mL of PBS was added, centrifuged at 350×g for 5 min, the supernatant was discarded, the buffer was resuspended in 100 μL, and the cell density was adjusted to 1×10^6 cells/100 μL. Each sample tube was added with 0.5 μL of flow cytometry antibodies (CD11b, Gr-1, Ly6G and Ly6C), incubated in the dark at 4 °C for 30 min, washed with 1 mL of buffer after incubation, centrifuged at 350×g for 5 min, the supernatant was discarded, and resuspended in 500 μL of phosphate buffer, filtered, and analyzed on the flow cytometer.
Mass Cytometry (Cytometry by Time of Flight [CyTOF])
Following the aforementioned procedure, splenic cells were isolated using flow cytometry. The CyTOF analysis was performed by Zhejiang Purling Health Technology Co. Ltd. (Hangzhou, China).
To ensure accurate identification and analysis of each sample, a dual gating strategy with unique quality-tagged barcodes was utilized for debarcoding the data.22,23 Each FCS file was normalized using bead normalization method.24 FlowJo software was employed for manual gating of the data, enabling the selection of viable individual immune cells while excluding dead cells and debris. This step ensured the retention of relevant cells for further analysis. To group cells based on the expression levels of biomarkers, the X-shift clustering algorithm was used.25 Subsequently, the t-SNE algorithm, developed by van der Maaten and Hinton, was employed for dimensionality reduction and visualization of high-dimensional data in two dimensions.26 This visualization method helped reveal the distribution of clusters, expression patterns of labels, and differences among various groups or different types of samples.
Isolation of MDSCs
Single-cell suspensions were prepared from the spleen by mechanical dissociation, followed by resuspending the cells in a buffer (Miltenyi Biotec). The cell suspension was then incubated with FcR blocking reagent for 10 minutes, followed by incubation with biotinylated anti-Ly-6G antibody (MDSCs-Kit) for another 10 minutes. After centrifugation at 300×g for 10 minutes at 4°C, the cells were washed and resuspended in buffer. Biotin microbeads were added, and the cells were incubated at 4°C for 15 minutes, followed by washing with 10–20 mL of buffer and centrifugation at 300×g for 10 minutes. The purified Gr1 cells with a purity of >95% were obtained through LS column magnetic separation, and their purity was further evaluated by FACS analysis.
RNA-Seq Method
Samples were ground under liquid nitrogen in a mortar and pestle, and the resulting powder dissolved in TRIzol™ Reagent (Invitrogen, Carlsbad, CA, USA), then extracted total RNA. The quality and purity of RNA were examined by a NanoDrop™ One/OneC spectrophotometer (Thermo Scientific, Waltham, MA, USA) and Life InvitrogennQubit RNA BR (Broad-Range) Assay Kit. RNA integrity was analyzed using Agilent 4200 TapeStation system (Agilent, Santa Clara, CA, USA). The second step is the preparation of mRNA sequencing library. 0.1–1 μg of total RNA per sample was prepared for library preparation. The NEBNext® Poly(A) mRNA Magnetic Isolation Module and NEBNext® Ultra™ II mRNA Library Prep Kit for Illumina® were used for mRNA isolation and library construction following the manufacturers’ protocols. As for the quality control of library, Qubit dsDNA HS Assay Kit was used to measure the concentration of library, then Agilent 4200 was used to examine the distribution of segments in library. Finally, library molar concentration was determined using the KAPA Library Quant kit (illumina) universal qPCR Mix. High-throughput transcriptome sequencing was performed on an Illumina NovaSeq 6000 platform according to the manufacturer’s instructions.
Statistical Analysis
Statistical analysis was conducted using GraphPad Prism 8.0. Normally distributed quantitative data were expressed as SEM ± mean, and comparisons between multiple groups were analyzed using one-way analysis of variance. Pairwise comparisons between groups were conducted using the least significant difference method. Significance levels were indicated as follows: * denoting p < 0.05, ** denoting p < 0.01, *** denoting p < 0.001, **** denoting p < 0.0001 and ns indicating no significant difference.
Heatmap was plotted by https://www.bioinformatics.com.cn (last accessed on 20 June 2024), an online platform for data analysis and visualization.27
Result
High Humidity Aggravated Arthritis Symptoms in the CIA Model Mice
To investigate the impact of humidity on inflammatory arthritis in vivo, a CIA model was established in C57BL/6 mice under normal (50±5%) or high humidity (80±5%) conditions. Mice began to show symptoms of arthritis 30 days following the first immunization. In conditions of elevated humidity, the prevalence of CIA exhibited a notable increase, reaching 91.6%. Conversely, under typical humidity levels, the incidence was observed to be 54.5% (Figure 1A). Following the booster immunization, the degree of arthritis was evaluated and the extent of paw swelling was quantified. The influence of humidity on the arthritis score and paw volume was determined, and data were represented in (Figure 1B and C). When compared with CTCIA, the CIA model in high humidity environment, demonstrated a significantly increased arthritis index and ankle swelling from day 26 to day 60. Additionally, the hind paw of mice in the HTCIA group were severely swollen and deformed (Figure 1D). Assessment of arthropathology and cartilage destruction by H&E staining showed that the ankle joints of HTCIA mice showed a significant increase in increased infiltration of inflammatory cells and narrowing of the joint space compared to CTCIA group (Figure 1E). Levels of two types of autoantibodies in CIA model, anti-COII IgG and anti-CCP, were also significantly increased by high humidity (Figure 1F and G).
 |
Figure 1 High humidity exacerbates the severity of collagen-induced arthritis. (A) variation in the incidence of RA under different humidity levels. (B) Swelling of the left ankle was measured weekly. (C) Joint scoring was conducted every three days on mice. (D) Representative images of the ankle joint. (E) Representative histological images of the ankle joint H&E staining. (F) Serum anti-CII IgG levels were detected through ELISA. (G) Serum anti-CCP levels were detected through ELISA. (H–J) Serum inflammatory factor levels were measured via ELISA. Values are expressed as SEM ± mean. “*” represents p < 0.05; “**” represents p < 0.01; “***” represents p < 0.001; “****” represents p < 0.0001; “ns” represents p ≥ 0.05. Abbreviations: CT, control group; CTCIA, collagen-induced arthritis group induced at 50% humidity; HT, blank group at 80% humidity; HTCIA, collagen-induced arthritis group induced at 80% humidity. |
Next, we measured the inflammatory cytokines associated with CIA model. Compared with the CTCIA group, the sera levels of proinflammatory cytokines IL-17A, IL-6 and IL-1β were significantly increased in the HTCIA group (Figure 1H–J).
Increased Humidity Induces More Severe Inflammation in the Spleen of CIA Model Mice
As illustrated in Figure 2, the HTCIA group exhibited a remarkable decrease in the body weight (Figure 2A) and increment in the spleen index (Figure 2B and C). This raised the question of whether severe inflammatory lesions were occurring in the spleen under high humidity conditions. H&E staining demonstrated that in the CT and HT groups, the red and white medulla of the spleen exhibited a distinct structural integrity, characterised by discernible boundaries and uniform distribution. In the CTCIA group, although the structural integrity of the red and white medulla could still be discerned, the boundaries were no longer apparent, and the white medulla exhibited a lighter chromatin. In the HTCIA group, the pathological structure was so disorganised that it was challenging to differentiate between the cortex and the medulla (Figure 2D).
 |
Figure 2 Increased humidity induces more severe inflammation in the spleen of CIA model mice. (A) weight. (B) Representative images of spleen. (C) Spleen index. (D) Representative histological image of spleen with H&E staining. (E) Representative immunohistochemical image of IL-6 in spleen. (F) IOD/area of IL-6 immunohistochemistry in spleen. (G–I) mRNA expression in spleen. Values are expressed as SEM ± mean. “*” represents p < 0.05; “**” represents p < 0.01; “***” represents p < 0.001; “****” represents p < 0.0001; “ns” represents p ≥ 0.05. The red arrow indicates splenic white marrow, while the black arrow indicates the splenic red marrow. Abbreviations: CT, control group; CTCIA, collagen-induced arthritis group induced at 50% humidity; HT, blank group at 80% humidity; HTCIA, collagen-induced arthritis group induced at 80% humidity. |
To determine whether there was an inflammatory response, the impact of the experimental procedure on IL-6 levels within the spleen was evaluated through immunohistochemical analysis. The intensity of IL-6-positive in the HTCIA group was significantly increased compared with that in the CTCIA group. CT and HT groups rarely showed the presence of IL-6 in spleen (Figure 2E and F). Furthermore, we also measured inflammatory cytokines in the spleen using qPCR and found that IL-6, IL-17 and GM-CSF were significantly increased in the HTCIA group (Figure 2G–I, Supplementary Figure 2).These findings suggest that a more severe inflammatory response occurs in the spleen under high humidity conditions.
High Humidity Upregulated the Accumulation of MDSCs in the Spleens of CIA Mice
To gain further insight into the alterations occurring in the spleen under high humidity conditions, CyTOF was conducted to classify the immune cells present. The Analysis of each group of samples identified 33 clusters using 41 immune markers (Figure 3A). The t-distributed stochastic neighbor embedding (TSNE) method was utilized for two-dimensional visualization of high-dimensional data. Based on the expression of characteristic markers, specific known cell types were identified within the clusters (Figure 3B). Compared to the CT group, the proportion of spleen immune cell subpopulations was significantly altered in the HT group, and differences were also observed in the HTCIA model compared to the HTCIA group (Figure 3C).
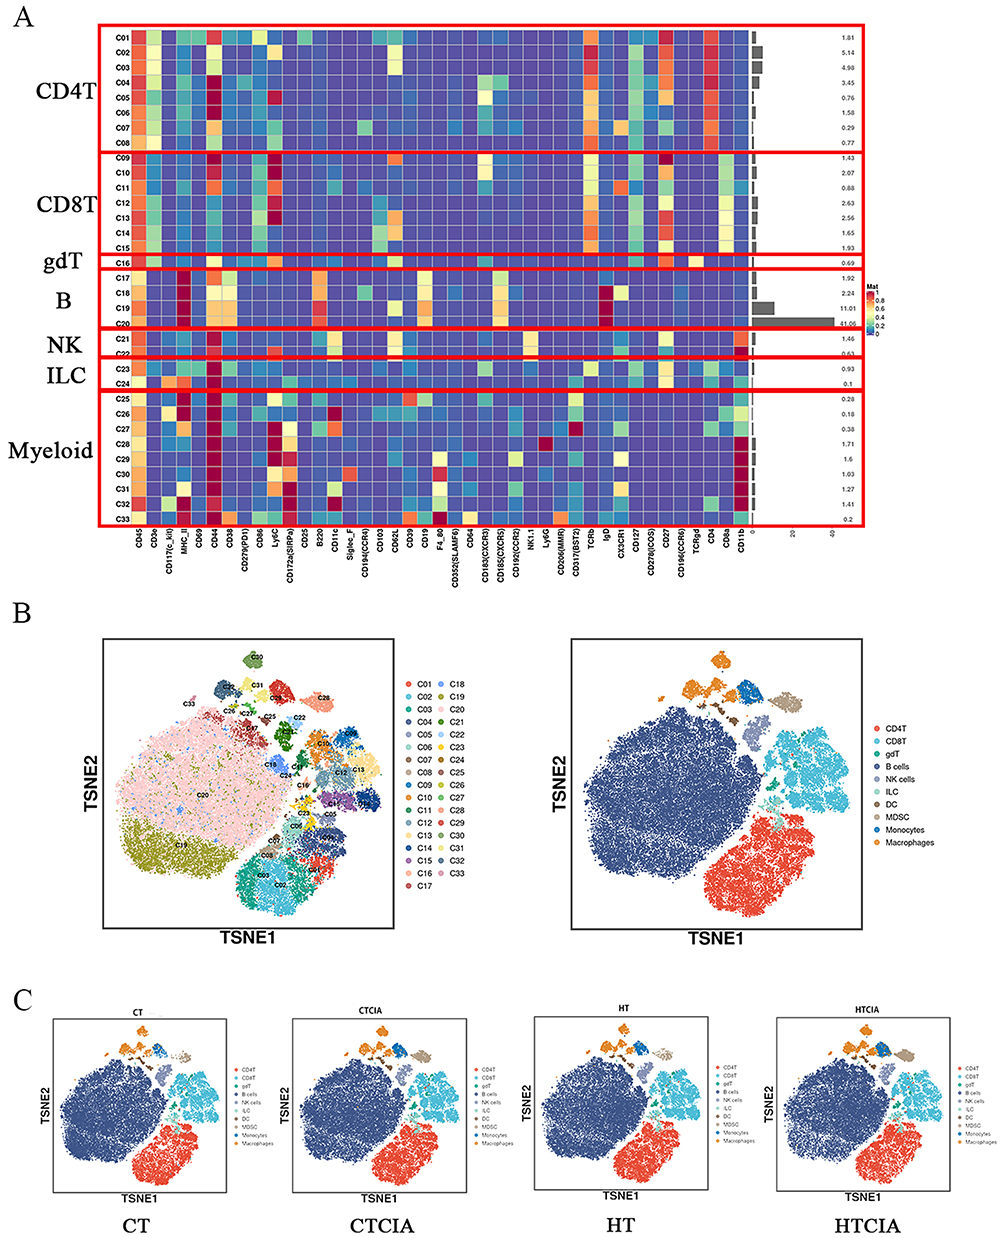 |
Figure 3 Classification of immune cell clusters in spleen tissue based on marker expression levels. (A) Heatmap of standardized immune cell marker expression for 33 immune cell clusters. (B) Distribution of 33 clusters and differences between groups. (C) Distribution of 33 clusters and differences between four groups. Abbreviations: CT, control group; CTCIA, collagen-induced arthritis group induced at 50% humidity; HT, blank group at 80% humidity; HTCIA, collagen-induced arthritis group induced at 80% humidity. |
The figures illustrate changes in MDSCs, macrophages, monocytes, ILCs, DCs, and other cell types. In the CTCIA and HTCIA groups, there was an overall increasing trend in MDSCs (p < 0.05), macrophages (p > 0.05), monocytes (p > 0.05), and ILCs (p > 0.05), with MDSCs being the only cell type to demonstrate a pronounced difference under high humidity conditions. Furthermore, a decreasing trend was observed in DCs (p > 0.05) (Figure 4A). A comparison of the CT group with the CTCIA group revealed a significant increase in MDSCs (p < 0.05), macrophages (p < 0.05), monocytes (p < 0.05), and ILCs (p < 0.05), indicating a notable elevation of bone marrow-derived cells and innate lymphoid cells in the splenic tissue of mice under normal humidity conditions (Figure 4A). DCs demonstrated a notable decline. When contrasting the HT group with the HTCIA group, MDSCs and ILCs exhibited a considerable increase, whereas DCs displayed a significant reduction. Overall, MDSCs exhibited a statistically significant increase in all three comparisons, indicating a consistent upward trend (Figure 4A).
 |
Figure 4 The impact of high humidity on the surface markers of immune cells in the spleen tissue of CIA mice is shown. (A) Bar graphs illustrating differences in immune cells among the four groups of spleen tissue. (B–D) Differential expression of surface markers across the four groups. (E) Heatmap showing changes in T cell content. Values are expressed as SEM ± mean. “*” represents p < 0.05; “**” represents p < 0.01; “***” represents p < 0.001; “****” represents p < 0.0001; “ns” represents p ≥ 0.05. Abbreviations: CT, control group; CTCIA, collagen-induced arthritis group induced at 50% humidity; HT, blank group at 80% humidity; HTCIA, collagen-induced arthritis group induced at 80% humidity. |
In terms of MDSC markers, such as Ly6G, Ly6C, and CD11b, an increasing trend was observed under different humidity conditions (Figure 4B and C). However, only a difference in Ly6C expression was observed between the CTCIA and HTCIA groups (Figure 4D). These results, along with the observed trends in MDSCs, further support the notion that a high-humidity environment increases the expression of MDSCs in the spleens of mice in the model.
It has been well documented that MDSCs inhibit T cell proliferation.28 Our findings, obtained through CyTOF, corroborate this, showing that CD4T and CD8T exhibited an inhibitory trend when MDSCs were significantly elevated (Figure 4E).
To further investigate the impact of high humidity on MDSCs, a flow cytometry analysis was conducted, confirming that high humidity does indeed affect the quantity of MDSCs (Figure 5A). As previously indicated, the results of flow cytometry were consistent with the aforementioned observations, with MDSC levels exhibiting a notable elevation under conditions of the CIA model in a high-humidity environment (Figure 5B). The immunofluorescence results demonstrated that the co-expression of CD11b and Ly6G was most significantly elevated in the spleen of the HTCIA group, followed by the CTCIA group (Figure 5C and D), Supplementary Figure 3.
 |
Figure 5 The impact of high humidity on the expression of surface markers of immune cells in the spleen tissue of CIA mice. (A) Flow cytometry detection results. (B) Bar graph showing the quantity of MDSCs based on flow cytometry analysis. (C) Immunofluorescence image depicting the co-expression of CD11b and Ly6G in the spleen tissues. (D) Immunofluorescence image measuring the IOD/area ratio of Ly6G and CD11b. Values are expressed as SEM ± mean. “*” represents p < 0.05; “**” represents p < 0.01; “***” represents p < 0.001. Abbreviations: CT, control group; CTCIA, collagen-induced arthritis group induced at 50% humidity; HT, blank group at 80% humidity; HTCIA, collagen-induced arthritis group induced at 80% humidity. |
In conclusion, it can be confirmed that in a high-humidity environment, MDSCs in the spleen tissue of CIA mice do indeed increase. The severity of the disease in CIA mice is increased in a high humidity environment, accompanied by elevated levels of MDSCs and inflammatory factors in the spleen, including IL-6, which is closely associated with MDSCs. These findings provide evidence that, in this context, MDSCs play a pro-inflammatory role in CIA mice.
High Humidity Affects the Oxidative Stress Levels of MDSCs in the Spleens of CIA Mice
A literature review indicates a close association between MDSCs and oxidative stress.29,30 To investigate whether oxidative stress is altered in the context of high humidity inflammation, a research study was conducted.
Initially, the levels of ROS in the serum were quantified. Compared to CTCIA, the serum ROS levels in HTCIA were significantly elevated (Figure 6A). Additionally, in the splenic homogenates, there was a clear upward trend under high humidity conditions, although the difference was not statistically significant under normal humidity conditions (Figure 6B). Interestingly, there was no significant difference in NO levels under high humidity conditions (Figure 6C). MDA, a product of membrane lipid peroxidation, was measured in splenic homogenates. The MDA levels in HTCIA were significantly higher than in mice exposed to high humidity without inflammation (HT), but there was no significant difference between CTCIA and HTCIA (Figure 6D). Additionally, the levels of Arg-1, an enzyme associated with MDSCs, were significantly higher in the splenic homogenates of HTCIA compared to CTCIA (Figure 6E). These results suggest that mice with CIA may experience increased levels of oxidative stress under high humidity conditions.
 |
Figure 6 Oxidative stress results. (A) Serum ROS levels. (B) Spleen homogenate ROS levels. (C) Spleen homogenate NO levels. (D)Spleen homogenate MDA levels. (E) Spleen homogenate Arg-1 levels. (F) Spleen homogenate GSH levels. (G) Spleen homogenate GSH-PX levels. (H) Spleen homogenate SOD levels. (I–N) mRNA levels of corresponding oxidative stress indicators in spleen tissue. Values are expressed as SEM ± mean. “*” represents p < 0.05; “**” represents p < 0.01; “***” represents p < 0.001; “****” represents p < 0.0001; “ns” represents p ≥ 0.05. Abbreviations: CT, control group; CTCIA, collagen-induced arthritis group induced at 50% humidity; HT, blank group at 80% humidity; HTCIA, collagen-induced arthritis group induced at 80% humidity. |
The human body and mice require an appropriate level of ROS, NO, and other molecules to maintain normal physiological functions. Excess free radicals can be neutralized by the antioxidant system, which includes antioxidant enzymes and non-enzyme antioxidant molecules.31 MDSCs are capable of scavenging excessive ROS through certain transcription factors, such as Nrf2 and HO-1.32 To further demonstrate the occurrence of oxidative stress in the CIA model under high humidity conditions, this study investigates relevant factors.
High humidity significantly alter the level of GSH in the serum and splenic homogenate. HTCIA showed an increase in serum GSH levels (Figure 6F) as well as increased levels of GSH-PX and SOD in splenic homogenates (Figure 6G–I). PCR analysis revealed increased expression of Nrf2, Arg1, GPX-1, GPX-2, HO-1 mRNA (Figure 6J–N), which are oxidative stress-related indicators, in the spleen of CIA mice under high humidity conditions. These findings suggest that the high humidity environment can increase oxidative stress levels in the spleens of CIA mice, potentially through its association with MDSCs.
MDSCs Affect the Development of RA Through the Rap1 Signaling Pathway
Subsequently, we investigate the molecular mechanisms of MDSCs in spleen tissues under high humidity conditions. Initially, we performed bulk mRNA-seq analysis to assess changes in gene expression profiles. Three mice were randomly selected from each of the four groups mentioned above, and MDSCs were isolated from their spleens (Figure 7A and B) for mRNA sequencing.
 |
Figure 7 MDSC has a pro-inflammatory effect and increases oxidative stress levels under high humidity.(A) Flow diagram of splenic tissue before sorting. (B) Flow diagram of splenic tissue after sorting. (C) Differential expression of pro-inflammatory markers in MDSC. (D and F) mRNA levels of corresponding oxidative stress indicators in MDSC. Values are expressed as SEM ± mean. “*” represents p < 0.05; “**” represents p < 0.01; “ns” represents p ≥ 0.05. Abbreviations: CT, control group; CTCIA, collagen-induced arthritis group induced at 50% humidity; HT, blank group at 80% humidity; HTCIA, collagen-induced arthritis group induced at 80% humidity. |
We found that MDSCs from HTCIA group showed increased expression of inflammatory chemokines, cytokines(Figure 7C). The date showed that MDSCs may have a predominantly pro-inflammatory role in the disease of RA.
Following the sorting of the cells, a flow analysis of ROS was conducted, which revealed a notable elevation in ROS levels within the HTCIA group. This finding was corroborated by PCR, which demonstrated that MDSC in the spleens of CIA mice subjected to a high-humidity environment exhibited a considerable degree of oxidative stress (Figure 7D–F).
A Gene Ontology (GO) and Kyoto Encyclopedia of Genes and Genomes (KEGG) pathway enrichment analysis was conducted on the mRNA sequencing data. EdgeR analysis was employed to identify differentially expressed transcripts between the CIA and HTCIA groups, using a filtering criteria of |log2FC| ≥ 1 and p < 0.05. The results were presented in the form of volcano plots (Figure 8A). In mice with CIA, exposure to high humidity conditions appeared to modulate 6403 genes with differential expression, comprising 2720 down-regulated genes and 3683 up-regulated genes. In addition, a cluster heatmap was generated to visualize the differentially expressed transcripts in each group (Figure 8B), demonstrating that the high humidity treatment group could be distinguished from the control group through hierarchical clustering of differentially expressed genes.
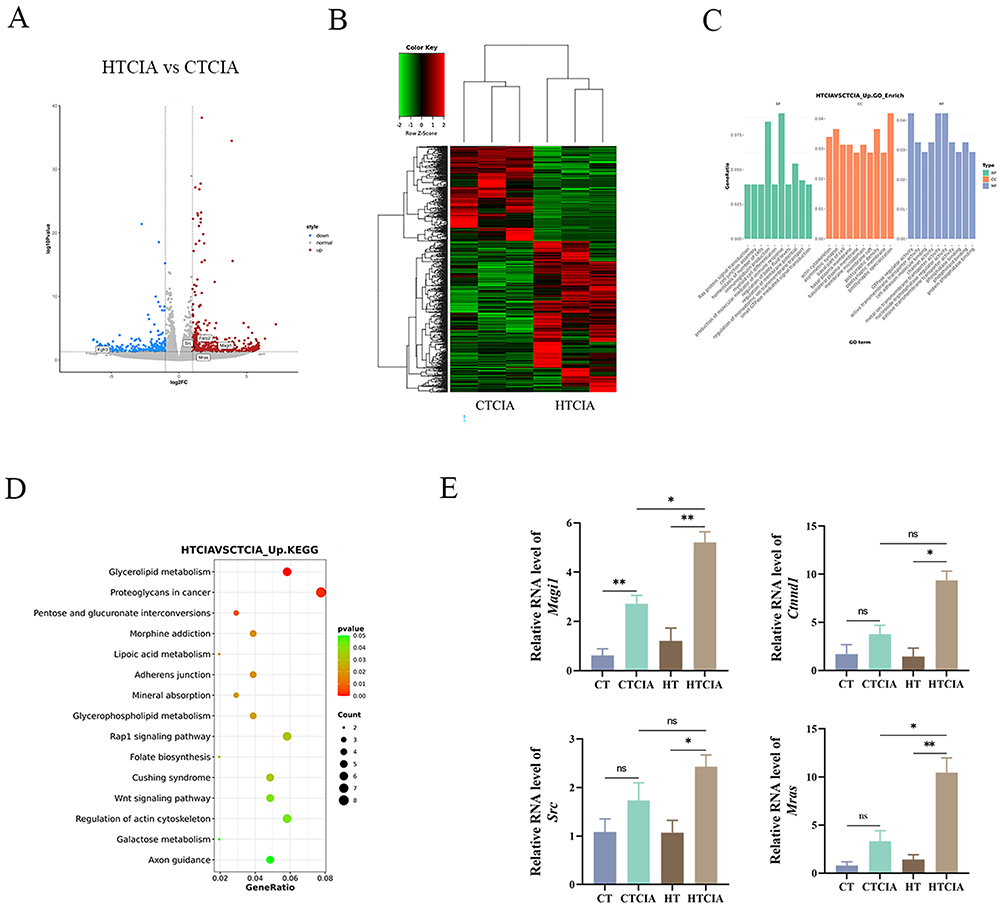 |
Figure 8 Transcriptomic results of MDSCs after sorting. (A) Volcano maps of differentially expressed genes in MDSCs cells of HTCIA vs CTCIA group. (B) Clustering heat map of differential transcripts. (C) GO pathway enrichment analysis of differentially expressed genes in MDSCs cells of HTCIA vs CTCIA group. (D) KEGG pathway enrichment analysis of differentially expressed genes in MDSCs cells of HTCIA vs CTCIA group. (E) mRNA levels. Values are expressed as SEM ± mean. “*” represents p < 0.05; “**” represents p < 0.01; “ns” represents p ≥ 0.05. Abbreviations: CT, control group; CTCIA, collagen-induced arthritis group induced at 50% humidity; HT, blank group at 80% humidity; HTCIA, collagen-induced arthritis group induced at 80% humidity. |
Subsequently, we conducted GO enrichment analysis. The top 10 entries for BP, CC and MF were visualized (Figure 8C). The major changes in the biological processes they are involved in are mainly focused on BP, metabolic processes, molecular functions, etc. The main changes in differentially expressed genes in CC are located in the cell membrane, nucleus, and cell membrane. In the MF analysis, the changes in gene expression levels manifest various functions, primarily including binding, catalytic activity, etc.33 Analysis of the figures reveals alterations in Ras protein signal transduction and small GTPase mediated signal transduction. Furthermore, KEGG pathway enrichment analysis was performed on 241 differentially expressed transcripts, visualizing the top 15 KEGG pathways as shown in (Figure 8D). The results indicate that high humidity primarily regulates pathways such as Rap1 signaling pathway, Wnt signaling pathway, Lipoic acid metabolism, Folate biosynthesis, and Galactose metabolism. Genes such as Ctnnd1, Magi1, Mras and Src exhibit upregulated expression, enriched in the Rap1 signaling pathway. Literature review suggests that members of the RAS family appear to play significant roles in the pathogenesis of several autoimmune diseases (RA, SLE, MS, and T1D).34 Compared with the control group, activation of the RAS pathway is enhanced in RA patients.35 Moreover, it is worth investigating the impact of high humidity conditions on the Rap1 signaling pathway, and selecting relevant genes within the Rap1 signaling pathway for experimental validation. Through PCR testing, we were able to confirm if the genes associated with the Rap1 pathway that were upregulated were indeed upregulated. The data indicated that the three genes of Ctnnd1, Magi1, and Mras were considerably higher in HTCIA when compared to the CTCIA group, while the Src gene was not statistically significant but did exhibit an increasing tendency (Figure 8E). In the CIA model, we also suspected that elevated humidity caused changes to the Rap1 signaling pathway.
Discussion
In recent years, there has been a growing interest in the impact of environmental factors on health and disease progression. Alteration in the external environment, such as humidity, play a significant role in influencing health, particularly in relation to the immune system.36,37 The spleen, being the largest immune organ in the body, was a focal point in our study. Our research revealed a notable increase in spleen inflammation and the presence of MDSCs in the CIA model. Interesting, exposure to 80% relative humidity did not exhibit a notable elevation in MDSC within their spleens. However, when combined with CIA modeling, exposure to 80% relative humidity was found to markedly exacerbate splenic inflammation and enhance the content of MDSCs in the spleen. These observations suggest that 80% relative humidity exacerbates the severity of the CIA model.
MDSCs constitute a diverse population of myeloid cells with regulatory functions in the immune system, primarily inhibiting T cell activity through various mechanisms.16,38 These cells are recognized as key mediators of immunosuppression, capable of inducing tolerance to immune responses mediated by effector T cells, NK cells, and other immune cells.29 The immunosuppressive effects of MDSCs are largely attributed to the secretion of active substances such as Arg-1, NO and ROS, which inhibit the activation, proliferation and migration of T cells.39 Peroxynitrite, a product of ROS and NO interaction, contributes to the inhibition of effector T cells.39 Our study employed CyTOF analysis of spleen immune cells to investigate the impact of relative humidity on spleen MDSC content. At 80% relative humidity, an increase in spleen MDSC content was observed, concomitant with a significant reduction in CD4+ and CD8+ T cells. Additionally, levels of Arg-1, NO, and ROS in the spleen were significantly elevated in the high-humidity CIA models, indicating a more pronounced immunosuppressive effect of spleen MDSCs and a substantial decrease in T cell numbers.
The role of MDSCs in the pathogenesis of RA remains a topic of debate. Some studies suggest a positive correlation between MDSCs and pro-inflammatory Th17 cells, implying a pro-inflammatory role for MDSCs.28 As precursors to osteoclasts, MDSCs can differentiate into osteoclasts via the IL-1α-induced activation of the NF-κB pathway, leading to joint destruction.40 Conversely, it has been proposed that MDSCs may ameliorate RA by expanding Treg cells through IL-10 action, exerting anti-inflammatory effects.19 These findings suggest that MDSCs may play a complex role in the pathogenesis of RA. Consequently, we proceeded to sort splenic MDSCs and subsequently conducted a mRNA-seq analysis. Furthermore, CIA modelling revealed a notable elevation in inflammatory factors and chemokines at 80% humidity, including IL-12b, IL-17c, CCR2, CCR7, and others. It was therefore surmised that MDSCs would exhibit a greater propensity for pro-inflammatory activity in a high humidity environment. This ultimately resulted in the onset of RA.
As mentioned above, MDSCs are also capable of secreting NO, ROS and other substances. These substances not only have the potential to inhibit effector T cells, but also contribute to oxidative stress. Oxidative stress can be defined as a phenomenon caused by an imbalance between the production and accumulation of oxygen-reactive substances, ROS, in cells and tissues, and the ability of biological systems to detoxify these reaction products.41,42 Simultaneously, MDSCs are often found in oxidative stress-prone environments, such as inflammation.29 At the same time, a variety of inflammatory and pathological conditions are associated with the overproduction of ROS molecules.43 Therefore, it is very interesting to study the relationship between MDSC and ROS. According to the results of our study, ROS in peripheral blood and spleen increased significantly and appeared unbalanced in the 80% humidity environment. Therefore, we hypothesised that after CIA modelling in a high-humidity environment, the number of MDSCs increased significantly, resulting in excessive ROS secretion and destroying the original balance. Additionally, we observed a notable elevation in the activity of certain antioxidant enzymes, including superoxide dismutase and glutathione peroxidase, in the 80% humidity CIA model. This finding corroborates our initial hypothesis regarding the heightened oxidative stress in the system. To further confirm whether the increase in ROS was a direct consequence of the presence of MDSCs, we also measured the corresponding oxidative stress indices of MDSC after sorting, which also confirmed our previous hypothesis.
The results demonstrated that the Rap1 pathway was markedly elevated in the HTCIA group following splenic MDSC mRNA-seq analysis. Rap1 is a member of the Ras guanosine triphosphatase superfamily.44 Despite the significant amino acid sequence identity of Ras and Rap proteins, Ras signal transduction is primarily involved in regulating growth, differentiation, and apoptosis, whereas Rap signal transduction is responsible for controlling cell adhesion to the extracellular matrix and the formation and potential stabilisation of intercellular connections.45 Furthermore, the dysregulation of Rap1 ubiquitination has been demonstrated to induce the production of ROS.46 Furthermore, research has revealed that in RA, the dysregulation of Ras and Rap1 signalling pathways plays a pivotal role in the development of oxidative stress and subsequent alterations in T cell functionality.47 It can be observed that Rap1 is also closely associated with oxidative stress.
Despite the insights gained from this study, several limitations should be acknowledged: (1) the lack of validation using human samples and the need for further verification of pathway mechanisms, (2) the small sample size (n=3) in the mass spectrometry flow cytometry experiment, (3) the use of a humidity chamber for humidity control and the necessity for alternative humidity control methods in future studies, and (4) the preliminary nature of the mRNA sequencing results, warranting deeper exploration. Our team plans to delve into these mechanisms further in upcoming research endeavors. This study, while shedding light on the impact of humidity on RA, underscores the need for continued investigation into this complex relationship.
Conclusion
In conclusion, the data demonstrate that elevated humidity (80±5%) is associated with an increase in the number of MDSC cells within the spleen tissue, which may have implications for the development of rheumatoid arthritis.
Data Sharing Statement
Further information and requests for resources should be directed to the corresponding author, Lin Huang(Email: [email protected]) and Zhixing He (Email: [email protected]).
Ethics Approval and Informed Consent
All animal handling and experimental procedures were carried out following the guidelines for laboratory animal care and use set forth by the local ethics committee and the National Institutes of Health. Furthermore, the Ethics Committee of Zhejiang Chinese Medical University approved all animal-related procedures in this study in April 2023 (approval number: 20230410-09). Throughout the duration of the experiment, measures were taken to minimize animal distress and strategically plan the procedures.
Acknowledgments
This study was remarkably due to the guidance of Professor Lin Huang and Professor Zhixing He, and all authors have read and approved the manuscript. We thanked Mingjie Chen (Shanghai NewCore Biotechnology Co., Ltd.) for providing data analysis and visualization support. Finally, we would like to thank Min Chen, who played an important role in correcting the grammar.
Author Contributions
All authors made a significant contribution to the work reported, whether that is in the conception, study design, execution, acquisition of data, analysis and interpretation, or in all these areas; took part in drafting, revising or critically reviewing the article; gave final approval of the version to be published; have agreed on the journal to which the article has been submitted; and agree to be accountable for all aspects of the work.
Funding
This research was supported by National Natural Science Foundation of China (No. 82274382, No. 82405212), Postdoctoral Fellowship Program of CPSF(GZC20232374).
Disclosure
The authors report no conflicts of interest in this work. This paper has been uploaded to ResearchSquare as preprint: https://www.researchsquare.com/article/rs-4229507/v1.
References
1. Babaahmadi M, Tayebi B, Gholipour NM, et al. Rheumatoid arthritis: the old issue, the new therapeutic approach. Stem Cell Res Ther. 2023;14:268. doi:10.1186/s13287-023-03473-7
2. Zhu M, Ding Q, Lin Z, et al. New targets and strategies for rheumatoid arthritis: from signal transduction to epigenetic aspect. Biomolecules. 2023;13:766. doi:10.3390/biom13050766
3. Xu Y, Liu W, Ren L. Emerging roles and mechanism of m6a methylation in rheumatoid arthritis. Biomed Pharmacother. 2024;170:116066. doi:10.1016/j.biopha.2023.116066
4. Lei Q, Yang J, Li L, et al. Lipid metabolism and rheumatoid arthritis. Front Immunol. 2023;14:1190607. doi:10.3389/fimmu.2023.1190607
5. Firestein GS, McInnes IB. Immunopathogenesis of rheumatoid arthritis. Immunity. 2017;46:183–196. doi:10.1016/j.immuni.2017.02.006
6. Scherer HU, Häupl T, Burmester GR. The etiology of rheumatoid arthritis. J Autoimmun. 2020;110:102400. doi:10.1016/j.jaut.2019.102400
7. Jang S, Kwon EJ, Lee JJ. Rheumatoid arthritis: pathogenic roles of diverse immune cells. Int J Mol Sci. 2022;23:905. doi:10.3390/ijms23020905
8. Ding Q, Hu W, Wang R, et al. Signaling pathways in rheumatoid arthritis: implications for targeted therapy. Signal Transduct Target Ther. 2023;8:68.
9. Hedström AK, Stawiarz L, Klareskog L, Alfredsson L. Smoking and susceptibility to rheumatoid arthritis in a Swedish population-based case-control study. Eur J Epidemiol. 2018;33:415–423. doi:10.1007/s10654-018-0360-5
10. Attur M, Scher JU, Abramson SB, Attur M. Role of intestinal dysbiosis and nutrition in rheumatoid arthritis. Cells. 2022;11:2436. doi:10.3390/cells11152436
11. Guan CM, Beg S. Diet as a risk factor for rheumatoid arthritis. Cureus. 2023;15:e39273. doi:10.7759/cureus.39273
12. Mori H, Sawada T, Nishiyama S, et al. Influence of seasonal changes on disease activity and distribution of affected joints in rheumatoid arthritis. BMC Musculoskelet Disord. 2019;20:30. doi:10.1186/s12891-019-2418-2
13. Zhao D, Cheng J, Bao P, et al. Effect of ambient temperature on outpatient admission for osteoarthritis and rheumatoid arthritis in a subtropical Chinese city. BMC Public Health. 2022;22:172. doi:10.1186/s12889-021-11994-0
14. Deane KD, Demoruelle MK, Kelmenson LB, et al. Genetic and environmental risk factors for rheumatoid arthritis. Best Pract Res Clin Rheumatol. 2017;31:3–18. doi:10.1016/j.berh.2017.08.003
15. Edwards CJ, Cooper C. Early environmental factors and rheumatoid arthritis. Clin Exp Immunol. 2006;143:1–5. doi:10.1111/j.1365-2249.2005.02940.x
16. Navashenaq JG, Shabgah AG, Hedayati-Moghadam M, et al. The role of myeloid-derived suppressor cells in rheumatoid arthritis: an update. Life Sci. 2021;269:119083. doi:10.1016/j.lfs.2021.119083
17. Yan L, Liang M, Yang T, et al. The immunoregulatory role of myeloid-derived suppressor cells in the pathogenesis of rheumatoid arthritis. Front Immunol. 2020;11:568362. doi:10.3389/fimmu.2020.568362
18. Hu C, Zhen Y, Ma Z, et al. Polyamines from myeloid-derived suppressor cells promote th17 polarization and disease progression. Mol Ther. 2023;31:569–584. doi:10.1016/j.ymthe.2022.10.013
19. Park MJ, Lee SH, Kim EK, et al. Interleukin-10 produced by myeloid-derived suppressor cells is critical for the induction of tregs and attenuation of rheumatoid inflammation in mice. Sci Rep. 2018;8:3753.
20. Luan J, Hu Z, Cheng J, et al. Applicability and implementation of the collagen-induced arthritis mouse model, including protocols (review). Exp Ther Med. 2021;22:939. doi:10.3892/etm.2021.10371
21. Gou KJ, Zeng R, Ren XD, et al. Anti-rheumatoid arthritis effects in adjuvant-induced arthritis in rats and molecular docking studies of Polygonum orientale l. Extracts. Immunol Lett. 2018;201:59–69. doi:10.1016/j.imlet.2018.11.009
22. Zunder ER, Finck R, Behbehani GK, et al. Palladium-based mass tag cell barcoding with a doublet-filtering scheme and single-cell deconvolution algorithm. Nat Protoc. 2015;10:316–333.
23. Tian J, Dai SB, Jiang SS, et al. Specific immune status in Parkinson’s disease at different ages of onset. NPJ Parkinsons Dis. 2022;8:5. doi:10.1038/s41531-021-00271-x
24. Finck R, Simonds EF, Jager A, et al. Normalization of mass cytometry data with bead standards. Cytometry A. 2013;83:483–494. doi:10.1002/cyto.a.22271
25. Samusik N, Good Z, Spitzer MH, et al. Automated mapping of phenotype space with single-cell data. Nat Methods. 2016;13:493–496. doi:10.1038/nmeth.3863
26. Gralinska E, Kohl C, Sokhandan Fadakar B, Vingron M. Visualizing cluster-specific genes from single-cell transcriptomics data using association plots. J Mol Biol. 2022;434:167525. doi:10.1016/j.jmb.2022.167525
27. Tang D, Chen M, Huang X, et al. Srplot: a free online platform for data visualization and graphing. PLoS One. 2023;18:e0294236. doi:10.1371/journal.pone.0294236
28. Guo C, Hu F, Yi H, et al. Myeloid-derived suppressor cells have a proinflammatory role in the pathogenesis of autoimmune arthritis. Ann Rheum Dis. 2016;75:278–285. doi:10.1136/annrheumdis-2014-205508
29. Ohl K, Tenbrock K. Reactive oxygen species as regulators of mdsc-mediated immune suppression. Front Immunol. 2018;9:2499. doi:10.3389/fimmu.2018.02499
30. Huang J, Zhao Y, Zhao K, et al. Function of reactive oxygen species in myeloid-derived suppressor cells. Front Immunol. 2023;14:1226443. doi:10.3389/fimmu.2023.1226443
31. Li M, Zhu D, Wang T, et al. Roles of myeloid-derived suppressor cell subpopulations in autoimmune arthritis. Front Immunol. 2018;9:2849. doi:10.3389/fimmu.2018.02849
32. Jiang T, Harder B, de la Vega MR, et al. P62 links autophagy and nrf2 signaling. Free Radic Biol Med. 2015;88:199–204. doi:10.1016/j.freeradbiomed.2015.06.014
33. Li Z, Chen M, Wang Z, et al. Berberine inhibits ra-fls cell proliferation and adhesion by regulating ras/MAPK/foxo/hif-1 signal pathway in the treatment of rheumatoid arthritis. Bone Joint Res. 2023;12:91–102. doi:10.1302/2046-3758.122.BJR-2022-0269.R1
34. Singh K, Deshpande P, Li G, et al. K-ras GTPase- and B-RAF kinase-mediated T-cell tolerance defects in rheumatoid arthritis. Proc Natl Acad Sci U S A. 2012;109:E1629–1637. doi:10.1073/pnas.1117640109
35. de Launay D, Vreijling J, Hartkamp LM, et al. Silencing the expression of ras family GTPase homologues decreases inflammation and joint destruction in experimental arthritis. Am J Pathol. 2010;177:3010–3024. doi:10.2353/ajpath.2010.091053
36. Mueller AL, Payandeh Z, Mohammadkhani N, et al. Recent advances in understanding the pathogenesis of rheumatoid arthritis: new treatment strategies. Cells. 2021;10. doi: 10.3390/cells10113017
37. Runkle JD, Sugg MM, Leeper RD, et al. Short-term effects of specific humidity and temperature on covid-19 morbidity in select us cities. Sci Total Environ. 2020;740:140093. doi:10.1016/j.scitotenv.2020.140093
38. Gabrilovich DI, Nagaraj S. Myeloid-derived suppressor cells as regulators of the immune system. Nat Rev Immunol. 2009;9:162–174. doi:10.1038/nri2506
39. Kusmartsev S, Nefedova Y, Yoder D, Gabrilovich DI. Antigen-specific inhibition of cd8+ t cell response by immature myeloid cells in cancer is mediated by reactive oxygen species. J Immunol. 2004;172:989–999. doi:10.4049/jimmunol.172.2.989
40. Kouis P, Kakkoura M, Ziogas K, et al. The effect of ambient air temperature on cardiovascular and respiratory mortality in thessaloniki, Greece. Sci Total Environ. 2019;647:1351–1358. doi:10.1016/j.scitotenv.2018.08.106
41. Pizzino G, Irrera N, Cucinotta M, et al. Oxidative stress: harms and benefits for human health. Oxid Med Cell Longev. 2017;2017:8416763. doi:10.1155/2017/8416763
42. Filomeni G, De Zio D, Cecconi F. Oxidative stress and autophagy: the clash between damage and metabolic needs. Cell Death Differ. 2015;22:377–388. doi:10.1038/cdd.2014.150
43. Novak EA, Mollen KP. Mitochondrial dysfunction in inflammatory bowel disease. Front Cell Dev Biol. 2015;3:62. doi:10.3389/fcell.2015.00062
44. Boettner B, Van Aelst L. Control of cell adhesion dynamics by rap1 signaling. Curr Opin Cell Biol. 2009;21:684–693. doi:10.1016/j.ceb.2009.06.004
45. Pannekoek WJ, Kooistra MR, Zwartkruis FJ, Bos JL. Cell-cell junction formation: the role of rap1 and rap1 guanine nucleotide exchange factors. Biochim Biophys Acta. 2009;1788:790–796. doi:10.1016/j.bbamem.2008.12.010
46. Sewduth RN, Carai P, Ivanisevic T, et al. Spatial mechano-signaling regulation of GTPases through non-degradative ubiquitination. Adv Sci. 2023;10:e2303367. doi:10.1002/advs.202303367
47. Remans PH, Gringhuis SI, van Laar JM, et al. Rap1 signaling is required for suppression of ras-generated reactive oxygen species and protection against oxidative stress in t lymphocytes. J Immunol. 2004;173:920–931. doi:10.4049/jimmunol.173.2.920
 © 2024 The Author(s). This work is published and licensed by Dove Medical Press Limited. The
full terms of this license are available at https://www.dovepress.com/terms.php
and incorporate the Creative Commons Attribution
- Non Commercial (unported, 3.0) License.
By accessing the work you hereby accept the Terms. Non-commercial uses of the work are permitted
without any further permission from Dove Medical Press Limited, provided the work is properly
attributed. For permission for commercial use of this work, please see paragraphs 4.2 and 5 of our Terms.
© 2024 The Author(s). This work is published and licensed by Dove Medical Press Limited. The
full terms of this license are available at https://www.dovepress.com/terms.php
and incorporate the Creative Commons Attribution
- Non Commercial (unported, 3.0) License.
By accessing the work you hereby accept the Terms. Non-commercial uses of the work are permitted
without any further permission from Dove Medical Press Limited, provided the work is properly
attributed. For permission for commercial use of this work, please see paragraphs 4.2 and 5 of our Terms.