")
Back to Journals » Journal of Inflammation Research » Volume 17
High RRM2 Correlates with Mitochondrial and Immune Responses in the Eosinophilic Subtype of Clear Cell Renal Cell Carcinoma
Authors Zhu X, Al-danakh A, Jian Y, Safi M, Luo S, Chen Q, Wang S, Yang D
Received 16 July 2024
Accepted for publication 24 October 2024
Published 2 November 2024 Volume 2024:17 Pages 8117—8133
DOI https://doi.org/10.2147/JIR.S478993
Checked for plagiarism Yes
Review by Single anonymous peer review
Peer reviewer comments 2
Editor who approved publication: Professor Ning Quan
Xinqing Zhu,1,* Abdullah Al-danakh,1,* Yuli Jian,2,* Mohammed Safi,3,* Sijie Luo,1,* Qiwei Chen,1 Shujing Wang,2 Deyong Yang1,4
1Department of Urology, First Affiliated Hospital of Dalian Medical University, Dalian, Liaoning, People’s Republic of China; 2Department of Biochemistry and Molecular Biology, Institute of Glycobiology, Dalian Medical University, Dalian, Liaoning People’s Republic of China; 3Thoracic/Head and Neck Medical Oncology Department, MD Anderson Cancer Center, Houston, TX, USA; 4Department of Surgery, Healinghands Clinic, Dalian, Liaoning, People’s Republic of China
*These authors contributed equally to this work
Correspondence: Deyong Yang; Shujing Wang, Email [email protected]; [email protected]
Background: Clear cell renal cell carcinoma (ccRCC), the predominant subtype of RCC, is distinguished by unique biological characteristics and heterogeneity, including eosinophilic and clear subtypes. Notwithstanding progress in therapy, immune checkpoint inhibitors (ICIs), and tyrosine kinase inhibitors (TKIs), the prognosis for individuals with metastatic ccRCC remains poor, presumably owing to metabolic alterations leading to mitochondrial dysfunction, which affects treatment response variability.
Methods: We analyzed histological and immunohistochemical data from a cohort at Dalian Medical University’s First Affiliated Hospital alongside RNA-sequencing transcriptome data from the TCGA database. Histologically, eosinophilic and clear ccRCC subtypes were evaluated using Kaplan-Meier and Cox proportional hazards models for survival analysis and prognosis. Differential gene expression (DEG) analysis and Gene Set Enrichment Analysis were performed to explore transcriptomic differences and relevant pathways.
Results: The study discovered substantial histological and molecular differences between the eosinophilic and clear cell subtypes of ccRCC. The eosinophilic subtype linked with frequent high-grade tumors (69.05% eosinophil vs 35.35% clear) and a poorer prognosis (HR=2.659, 95% CI:1.437– 4.919, P=0.002). DEG analysis revealed distinct expression patterns among subtypes and identified a risk score signature that remained significant even after adjusting for clinical variables (HR=3.967, 95% CI: 1.665– 9.449, P=0.002), showing less favorable survival in the high-risk group (P < 0.0001). RRM2 emerged as the most prognostic gene from this risk score, particularly in the eosinophilic subtype, alongside other clinical variables. By IHC, RRM2 shows high IHC score in eosinophilic compared to clear subtype (P=0.019). In addition, highly expressed RRM2 correlates with poor outcomes and is linked to mitochondrial genes, immunological pathways, and ICIs treatment.
Conclusion: These findings show significant differences in prognosis between subtypes. RRM2 was the most prognostic gene from the discovered novel risk score signature associated with subtypes. Future research is essential to validate these insights and their therapeutic implications for ccRCC management.
Keywords: clear cell renal cell carcinoma subtypes, metabolic reprogramming. mitochondria, tumor microenvironment, RRM2, immune checkpoint inhibitors
Introduction
Renal cell carcinoma (RCC) is one of the ten most often diagnosed malignancies worldwide.1,2 Clear cell renal cell carcinoma (ccRCC) is the most prevalent histological subtype of RCC, accounting for approximately 75% of all RCC cases.3,4 Although surgical resection is a potential therapy option for early-stage localized ccRCC, over 30% of individuals with localized diseases may ultimately develop metastasis.5 Metastatic ccRCC patients still have a poor prognosis, with 5 year survival rate of 12%.5 Current standard treatments for advanced and metastatic ccRCC include molecular targeted therapies, including immune checkpoint inhibitors (ICIs) and tyrosine kinase inhibitors (TKIs).4,6,7 Nonetheless, these treatments often face challenges due to generally inadequate responsiveness, leading to resistance to the drugs and progressive disease for many patients because of varied individual responses to therapy.8 Therefore, identifying high-risk patients and choosing the most suitable targeted treatments is becoming increasingly challenging.
The alteration of metabolic processes carried out by cancer cells in reaction to stress has been acknowledged as a necessity for the malignant advancement of cancer. Studies have demonstrated that inhibiting this reprogramming can decrease cancer spread to other body parts.9,10 Researchers have shown that as cancer progresses, tumors undergo changes in their metabolic properties and tendencies, thereby accelerating tumor metastasis.11 The change from oxidative phosphorylation to glycolysis in tumor cells, known as the Warburg effect, enhances their ability to invade and spread to other body parts by boosting epithelial-mesenchymal transition and angiogenesis.9,12,13 Prior works have established that ccRCC is a metabolic disorder.14,15 The cholesterogenic profile may provide a survival advantage by indirectly increasing pyruvate transport into the mitochondria and decreasing the generation of lactate, a recognized factor in promoting tumor development.16 Mitochondria play a crucial role in producing energy, regulating cell metabolism, facilitating cell signaling, linked to the genesis and progression of cancer.17,18 Cancer cells frequently exhibit mutations in mtDNA to facilitate the reconfiguration of energy production and the manufacture of biological molecules. In addition, mitophagy, which refers to the targeted elimination of dysfunctional mitochondria, is receiving increasing recognition for its involvement in cancer biology.19–22 Understanding these intricate processes sheds light on potential therapeutic targets and the development of innovative treatment strategies.
The ccRCC often exhibits many histological characteristics, including cytoplasm loaded with glycogen, eosinophilic cytoplasm, a delicate vascular network, and increased thick vascular structures.23 A new study has shown that regions with eosinophilic characteristics, characterized by granular, eosinophilic cytoplasm, had lower levels of blood vessels but included a high number of immune cells compared to areas with clear subtype. Currently, these areas are not regarded as distinct subtypes.24,25 In contrast to the clear subtype, the eosinophilic subtype is clinically important because of its connection with elevated nuclear grade and advanced stage, resulting in a worse prognosis and resistance to current therapy.26,27 Furthermore, no research has comprehensively investigated the fundamental mechanics of this variation. This renders it a particularly significant area for study, as comprehending its unique attributes may result in more efficacious treatment techniques for individuals presenting this particular form of illness.
The focus on the eosinophilic subtype of ccRCC stems from the need to understand better the pathways driving its aggressiveness and treatment resistance. While advances in transcriptomics and genetics have expanded our understanding, clinical decisions still rely heavily on histological analysis due to its accessibility and cost-effectiveness.28,29 Using RNA-sequencing data from the TCGA and advanced histological image processing, we employed machine-learning models to distinguish eosinophilic from clear cell subtypes of ccRCC. We assessed survival differences, clinical correlations, key pathways involved in ccRCC progression, and therapeutic predictions, validating these findings through lab work on hospital ccRCC cases. This comprehensive approach enhances our understanding of patient outcomes and paves the way for novel therapeutic targets for this aggressive cancer subtype.
Materials and Method
Patients’ Cohort and Histology Evaluation
The Cancer Genome Atlas (TCGA) Cohort
The TCGA was employed to access tumor RNA-sequencing gene expression data and histological slides of Kidney Renal Clear Cell Carcinoma (KIRC) from the National Cancer Institute Genomic Data Commons (GDC) database (https://gdc.cancer.gov).
Image Preprocessing
The image preprocessing steps was to ensure that only relevant and high-quality data were included for analysis, reducing noise and improving the model’s performance. By utilizing the openslide library, Whole Slide Images (WSIs) were sliced into 256×256 pixel patches at 10x magnification without overlap to maintain uniform resolution and capture granular histological details. Patches predominantly showing the background (determined by RGB values below 220) were discarded to exclude irrelevant areas and ensure focus on the tissue regions of interest. Color normalization was performed using Macenko’s method30, chosen for its ability to standardize color variations across different slides, which is critical for consistent image analysis. An InceptionV3 model31, identified and excluded patches with abnormal staining, that refining the dataset and enhancing the accuracy of downstream analyses. This process resulted in 1,605,541 patches, with each WSI yielding between 133 and 8625 patches (Figure 1), enabling more robust statistical analysis.
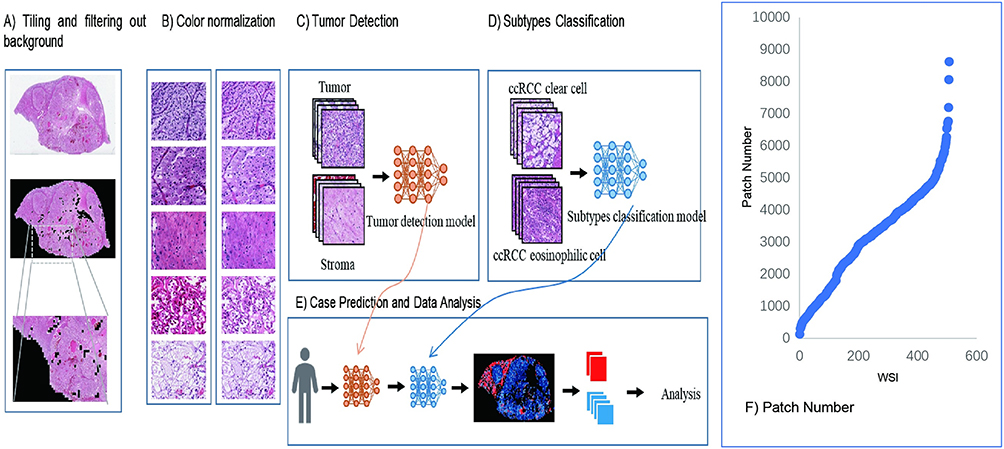 |
Figure 1 Workflow for identifying ccRCC subtypes using WSI and deep learning. (A) WSI were segmented into 256×256 pixel tiles, with background and low-information tiles filtered out to focus on relevant tissue areas. (B) Comparison of tiles before and after color normalization. (C) Tumor detection was performed using CNN trained to distinguish tumor tissue from stroma at the tile level. (D) Subtype classification model trained on tumor-containing tiles to differentiate between the clear and eosinophilic subtypes of ccRCC. (E) Patient-level subtype prediction and case-level analysis by aggregating tile classifications, producing comprehensive subtype heatmaps. (F) Distribution of the number of tiles generated per WSI, illustrating the variability in tissue content across different cases. |
Dataset Training, Tumor Detection, and ccRCC Classifications
The patches were labeled by uro-pathologists for tumor and mesenchymal dichotomies, resulting in a dataset distribution of 3422 tumor patches and 3077 mesenchymal patches. The dataset was split into training, validation, and testing sets (in a 7:1:2 ratio), and five rounds of training were conducted using the InceptionV3 model. The best-performing model was selected for predictions, which generated 1,030,119 tumor patches. Model performance was evaluated using accuracy, area under the curve (AUC), recall, and precision metrics, focusing on patches with high prediction confidence. The number of tumor patches predicted per WSI ranged from 71 to 7963.
The eosinophilic and clear ccRCC subtypes were classified using the same methodology, yielding a dataset of 1828 clear patches and 865 eosinophilic patches (Supplementary Figure 1). Patches with predicted probabilities greater than 0.7 for clear or eosinophilic subtypes were included to ensure high confidence in classification outcomes.
Transfer learning was implemented to overcome the challenges of limited labeled medical imagery and enhance classification accuracy. Pre-trained weights from the ImageNet dataset were leveraged to optimize the InceptionV3 model’s final classification layer for this specific medical imaging task. This approach was selected for its efficiency in improving model performance without retraining the model from scratch. InceptionV3 was chosen due to its robust architecture and effectiveness in pathological image analysis31 (Figure 1 and Supplementary Figure 1). Two independent urological pathologists (YD, CQ) verified the classification results for the eosinophilic and clear ccRCC subtypes.
Hospital Cohort
Hematoxylin and Eosin Staining and ccRCC Subtypes Classification
This research was conducted in strict adherence to the pertinent ethical guidelines outlined in the Helsinki Declaration, having secured the necessary approvals from the First Affiliated Hospital of Dalian Medical University with an approval NO (PJ-KS-KY-2023-353), with informed consent provided by all participants. Tissue specimens were obtained from nephrectomy procedures executed within our institution in China. A systematic approach to tumor sampling was employed, and each specimen underwent fixation in formalin to facilitate histological and immunohistochemical analyses. Tissue specimens, previously fixed in formalin and embedded in paraffin, were sectioned into 4-μm-thick slices and subjected to hematoxylin and eosin (H&E) staining following established protocols. In the case of all examined cohorts, slides stained with H&E representing entire tissue sections were subjected to a thorough re-assessment by a urological pathologist (YD), who conducted the evaluation without prior knowledge of the clinical outcomes. This process confirmed that all tumors were histologically classified as ccRCC. The histological examination extended to features such as the World Health Organization/International Society of Urological Pathology (WHO/ISUP) grade and the pathological stage (according to the 2018 TNM classification), alongside the histological phenotypes, which were characterized based on the appearance of the tumor cells, either as clear (cells exhibiting clear or pale cytoplasm) or eosinophilic (cells with eosinophilic cytoplasm), particularly in the regions exhibiting the highest tumor grade.25,32 For the purpose of evaluating interobserver variability, another urology pathologist (CQ) conducted an independent review of H&E-stained slides, focusing on the WHO/ISUP grade and histological phenotype.
Immunohistochemical Analysis
The samples were fixed overnight in 4% paraformaldehyde solution to prepare for paraffin embedding. Subsequent steps involved deparaffinization sections with xylene, followed by a graded alcohol rehydration process. Antigen retrieval was performed using Tris-EDTA buffer (pH 9.0), after which endogenous peroxidase activity was quenched by treating the slides with a 3% solution of an endogenous catalase inhibitor.
TOM20 and anti-human anti-mitochondria are well-established biomarkers for mitochondria in the literature.33–35 The rabbit anti-human TOM20 primary antibody (Bioworld Technology, Inc.BS9924M) was used at a dilution of 1:100, rabbit RRM2 polyclonal primary antibody(Bioworld Technology, Inc.BS7520.) was used at a dilution of 1:200, and mouse Anti-human anti-Mitochondria primary antibody (Abcam.ab92824) used at a dilution of 1:1000 overnight at 4°C. The following day, sections were incubated with an enzyme-conjugated goat anti-rabbit/mouse IgG polymer, and the signal was developed using Diaminobenzidine (DAB). The staining process concluded with counterstaining with hematoxylin, subsequent dehydration through a graded series of alcohols, and examination under a microscope. Protein expression levels were compared between two ccRCC subtypes using the IHC score. IHC staining was blindly scored as low or high based on the positive cell proportion and staining intensity, rated on a scale of 0–12, with the positive cell proportion graded as 0 (≤5%), 1 (<25%), 2 (<50%), 3 (<75%), and 4 (≥75%), and the staining intensity graded as 0 (negative), 1 (faint), 2 (intermediate), and 3 (strong).
Statistical Analysis
Survival Analysis was conducted utilizing the “survival” and “survminer” packages within the R programming environment, employing Kaplan-Meier (KM) estimates alongside the Log rank test to evaluate differences in survival rates. To compare two or more groups, the χ2 test was used for categorical variables, one-way analysis of variance for parametric variables, and the Mann–Whitney U-test or Kruskal–Wallis test for non-parametric variables. The Spearman’s rank correlation test was used to assess the correlations between the two variables. Independent non-parametric test was applied for numerical data with Differential expression analysis of genes between the groups was carried out, with a significance threshold set at a FDR-value < 0.02, utilizing the “heatmap” package in R. Furthermore, a univariate and multivariate Cox proportional hazards model was applied to identify significant predictors of survival, with a stringent significance level set at a p-value < 0.05, using the respective package in the R software. Receiver operating characteristic (ROC) with the area under curve (AUC) was applied to check for prediction accuracy. For all statistical analyses, two two-tailed p-value < 0.05 indicated statistical significance and a limit of <0.0001. These analyses were performed using version 4.1.3 of the R programming software and Graph Prism version 8.
Results
TCGA Clinicopathological Analysis of ccRCC Histology Phenotypes
A cohort of 141 ccRCC patients was identified to meet our classification criteria. This included 42 cases classified as the eosinophilic subtype and 99 as the clear subtype. The clear subtype was more prevalent in early-stage (70.7%) and low-grade (64.6%) tumors, while the eosinophilic subtype was predominantly found in advanced-stage cases, accounting for 54.5% of the group and in high-grade tumors, constituting 69% of its cases. Additionally, a notable proportion of the eosinophilic group consisted of younger patients (59%). Significant differences in tumor grade between the two subtypes were observed (P<0.0001). Detailed clinicopathological characteristics are provided in Table 1.
 |
Table 1 Clinicopathological Variables of Clear Cell Renal Cell Carcinoma (ccRCC) Subtypes: Clear vs Eosinophilic in the TCGA Cohort |
To evaluate the prognostic relevance of subtype classification in ccRCC, a logistic regression analysis was performed based on various clinicopathological characteristics. The results indicated that tumor grade could be significantly predicted with an odds ratio of 4 (95% CI:1.88–8.8, P< 0.0001). The tumor stage also showed a marginally significant prediction with an odds ratio of 1.99(95% CI:0.9–4.2, P= 0.07). However, we found no significant predictive value for patient demographics such as age and gender (Supplementary Table 1).
Survival analyses were performed using the KM method, and a statistically significant correlation between the eosinophilic subtype and poorer prognosis compared to the clear subtype (P<0.05) Figure 2A. Additionally, multivariate Cox regression analysis, adjusted for other clinicopathological variables, affirmed the eosinophilic subtype as an independent predictor of adverse outcomes (HR=2.659, 95% CI:1.43–4.9, P = 0.002) Figure 2B.
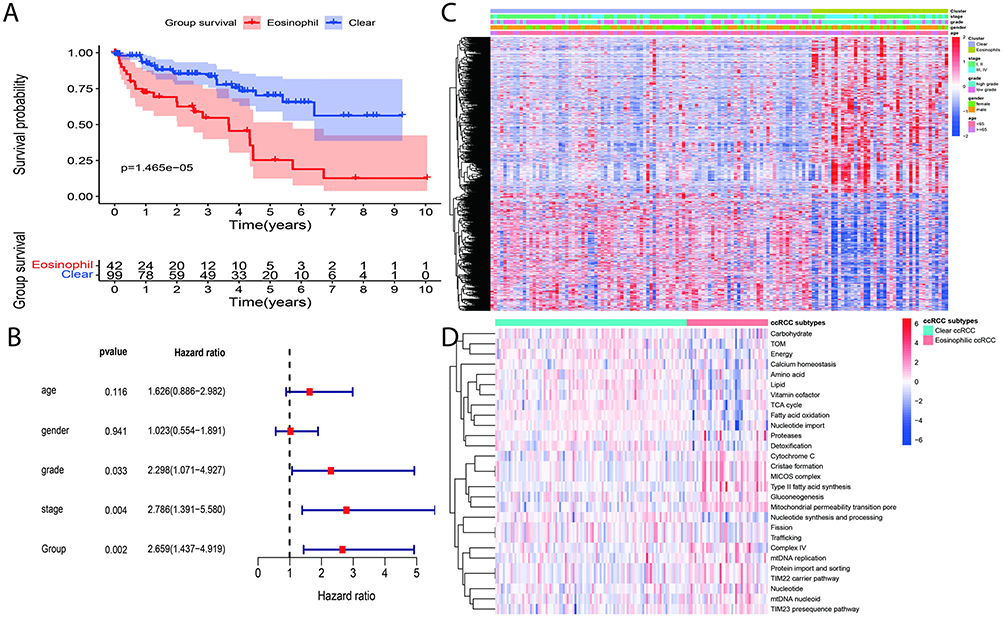 |
Figure 2 Survival and molecular profiling of ccRCC subtypes. (A) Kaplan-Meier survival curves comparing overall survival between ccRCC subtypes (B) Multivariate cox regression analysis with adjusted clinical variables demonstrated eosinophilic subtype showing a higher hazard ratio for death than clear subtype (HR=2.659, 95% CI:1.43–4.9, P=0.002). (C) Heatmap displaying DEGs between eosinophilic and clear cell ccRCC subtypes, with clustering and associated clinical annotations. (D) Heatmap illustrating differences in mitochondrial and metabolic pathway activity between eosinophilic and clear cell subtypes. |
Gene Expression and Pathway Analysis of Eosinophil vs Clear Subtypes of ccRCC
Using the limma package, we identified 3756 DEGs between 99 clear and 42 eosinophilic ccRCC samples, achieving significance at an FDR < 0.02 (Figure 2C and Supplementary Figure 2A). To probe the molecular mechanisms potentially governing the histological differences in ccRCC, we conducted a gene set enrichment analysis (GSEA), specifically targeting KEGG and GO pathways based on these DEGs. The analysis revealed significant enrichment of pathways associated with cellular organelles, notably mitochondria, Golgi apparatus, and peroxisomes, as well as cell cycle processes in the eosinophilic subtype. Additionally, the clear subtype was significantly enriched in metabolic pathways (Figure 2D, Supplementary Figure 2B and C). Our findings are in line with previous literature linking eosinophilic ccRCC to a higher abundance of cellular organelles like mitochondria22,24,36,37 and implicating metabolic pathways, particularly those related to fatty and glycerolipid metabolism, in the clear subtype.
Subsequently, we used the Venny website (https://csbg.cnb.csic.es/BioinfoGP/venny.html) to match our DEGs resultant genes with the ssGSEA metabolic gene set and mitochondrial genes sourced from MitoCarta and MitoMiner,38,39 yielding 299 genes in common (Supplementary Figure 2D). We then performed a univariate Cox regression analysis on these 299 genes, which identified 42 genes with prognostic significance value (P<0.001), as shown in (Supplementary Table 2). To further refine our analysis, we conducted a multivariate Cox hazard regression analysis revealed 12 genes with the most substantial prognostic significance (GALC, CPT2, CUBN, RRM2, ACAD11, MLYCD, SLC10A2, AMDHD1, HAO2, PECR, ARSB, and DMGDH) with P < 0.05 (Figure 3A). RRM2, ACAD11, HAO2, and DMGDH were associated with unfavorable prognoses in ccRCC. The predictive capability of the risk score was further evaluated through survival analysis, where significant differences in survival rates between high-risk and low-risk groups were observed. The high-risk group demonstrated markedly higher mortality rates (P< 0.001), as shown in Figure 3B and C. Additionally, the risk score’s predictive accuracy was validated using a receiver operating characteristic ROC curve analysis, which indicated robust predictive performance with AUC at one year(86%), two years(83%), and three years (85%) Figure 3D.
 |
Figure 3 Multivariate analysis and survival outcomes based on risk scores in ccRCC subtypes. (A) Multivariate cox regression analysis identifying significant prognostic risk score genes. (B) Kaplan-Meier survival analysis comparing overall survival between high-risk and low-risk patient groups based on risk scores derived from the multivariate cox model. The high-risk group shows significantly reduced survival compared to the low-risk group (P<0.0001). (C) Scatter plot illustrating the distribution of survival status in relation to increasing risk score. (D) Receiver operating characteristic (ROC) curves for risk score-based prognostic prediction at 1, 2, and 3 years. (* P< 0.05, ** P < 0.01, *** P < 0.001). |
To elucidate the risk score’s strength as an independent prognostic factor, we conducted a univariate analysis on clinical factors, including ccRCC subtype grouping. Subsequently, significant variables identified in the univariate analysis were utilized to do a multivariate Cox regression analysis. Interestingly, the risk score (HR=3.96, 95% CI:1.66–9.4, P=0.002) remains an independent predictive variable. Grouping also shows significant prediction with (HR=1.87, 95% CI:0.99–3.50, P=0.05). While grading showed significance in the univariate analysis alone, the staging was significant in both univariate and multivariate contexts(HR=2.4, 95% CI:1.16–5, P=0.018) Figure 4A. Additionally, a non-parametric independent test demonstrated significant differences between the risk score and clinical characteristics, including grouping, grade, and stage (P < 0.05). Patients with elevated risk scores, mostly related to the eosinophilic subgroup, had higher tumor grades and were at more advanced stages Figure 4B–D.
 |
Figure 4 Risk score and clinical variables analysis (A) Multivariate cox regression analysis for risk score adjusted with clinical variables. (B–D) Independent non-parametric analyses (Mann–Whitney U-test) assessing the association between risk score and categorical clinical variables with significant values (P<0.0001); ccRCC subtype (B), tumor grade (C), and tumor stage (D). |
The subsequent investigation revolved around the precise genetic attributes of individual genes and their implications for survival, clinical outcomes, prognostic value, and the regulatory impact observed in variations among ccRCC subtypes. It was noteworthy that RRM2, a gene recognized as a hub gene belonging to the nucleotide pathway, exhibited significant enrichment among the eosinophilic ccRCC subtype (Figure 2D, Supplementary Figure 2B and C).
Analyzing RRM2 expression on survival impact using KM of the whole ccRCC cohort shows poor survival in the high expression group compared to the low expression group (P<0.0001), and it is high expression linked with an advanced stage, as well as high-grade (P<0.05) (Supplementary Figure 3A–C). Furthermore, the cohort comprising ccRCC subtypes (eosinophil and clear) also exhibited a diminished survival rate in the group with elevated RRM2 expression by using the KM test (P<0.05) Figures 5A. Finally, non-parametric independent test results show high RRM2 gene expression significantly correlates with the eosinophilic group (P=0.002), high-grade (P< 0.0001), and advanced stage (P=0.006) compared to low expression group (Figures 5B–D). Furthermore, Figure 5E shows protein-protein interactions between RRM2 and mitochondrial genes. Therefore, in the next section, we will focus on RRM2 due to its clinical value and its participation in nucleotide metabolism, cell cycle, and DNA repair.
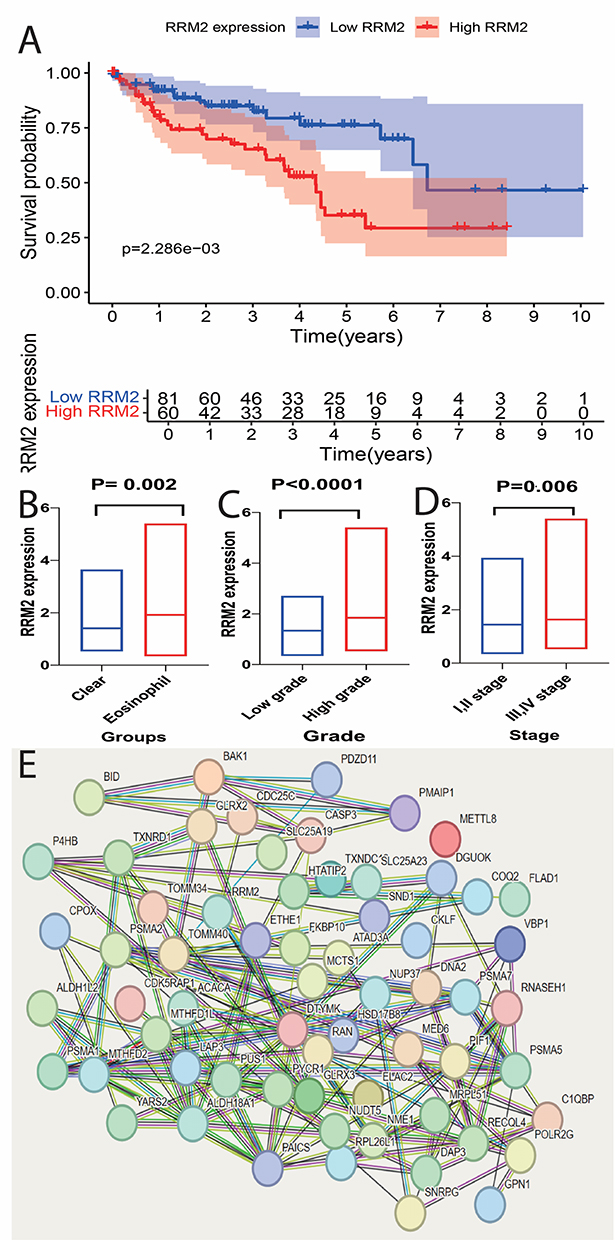 |
Figure 5 Analysis of RRM2 expression in ccRCC subtypes. (A) Kaplan-Meier survival analysis comparing overall survival between patients with high versus low RRM2 expression in the ccRCC cohort. High RRM2 expression is associated with significantly worse survival outcomes (P<0.05). (B–D) Box plots showing differential expression of RRM2 across various clinical categories. (B) Comparison of RRM2 expression between ccRCC subtypes with higher expression in the eosinophilic subtype (P=0.002). (C) RRM2 expression in relation to tumor grade shows elevated levels in high-grade tumors (P<0.0001). (D) RRM2 expression in early-stage (I/II) versus advanced-stage (III/IV) tumors, with significantly higher levels in advanced stages (P=0.006). (E) Protein-protein interaction network analysis of RRM2, highlighting its interactions with mitochondrial-related proteins, indicating potential involvement in mitochondrial regulation in ccRCC. |
The Influence of RRM2 on Mitochondria and Response to ICIs in Eosinophilic ccRCC Subtype
To investigate the role of RRM2 within the context of ccRCC subtypes, particularly given its association with mitochondrial abundance, its contribution to DNA replication and repair, and its influence on the current treatment modalities as documented in prior studies.40–46 Initially, we classified RRM2 expression in ccRCC patients into high versus low levels. Such stratification enabled the use of GSEA to assess KEGG and GO pathways, illuminating RRM2’s involvement in DNA repair, metabolism, and the cell cycle, among other processes, as evidenced by Supplementary Figure 4 and Supplementary Table 3. A notable finding was the identification of 66 mitochondrial genes closely correlated with RRM2 expression in ccRCC patients, which predominantly exhibited a significant positive correlation (P <0.05) (Table 2).
 |
Table 2 Correlation Between RRM2 and Mitochondrial Genes in ccRCC Subtypes (Eosinophilic vs Clear) Using Spearman’s Rank Correlation Analysis |
The IMmotion gene signature and ClearCode34 gene signature, both well-established in previous literature47,48 for predicting treatment responses to ICIs and TKIs in ccRCC, were quantified, with the IMmotion signature focusing on angiogenesis, immune response, antigen presentation, and myeloid inflammation, and ClearCode34 on hypoxia, cell cycle, glucose metabolism, and EMT. Additionally, well-known ccRCC molecular subtypes, including clear cell B (ccB), an aggressive subtype associated with poor survival, and clear cell A (ccA), a less aggressive subtype linked to improved survival,25,49 have been employed alongside other pathways. Our findings indicate that ccB, cell cycle activities, DNA replication, and immune-related pathways, were significantly high in the eosinophilic ccRCC group, whereas ccA, NOTCH, RAS, and angiogenesis pathways were enriched in clear ccRCC group (Figure 6A). This suggests that patients with the clear ccRCC group might sufficiently respond to TKIs, whereas those with an eosinophilic subtype could benefit more from ICIs. Further analysis was performed to discern the potential role of RRM2 in ccRCC therapy by correlating its expression with above mentioned pathways. Results demonstrated a positive association of RRM2 with the eosinophilic group, thereby indicating its strong prognostic value for immunotherapy, albeit with a noted resistance to TKIs-related pathways (Figure 6B).
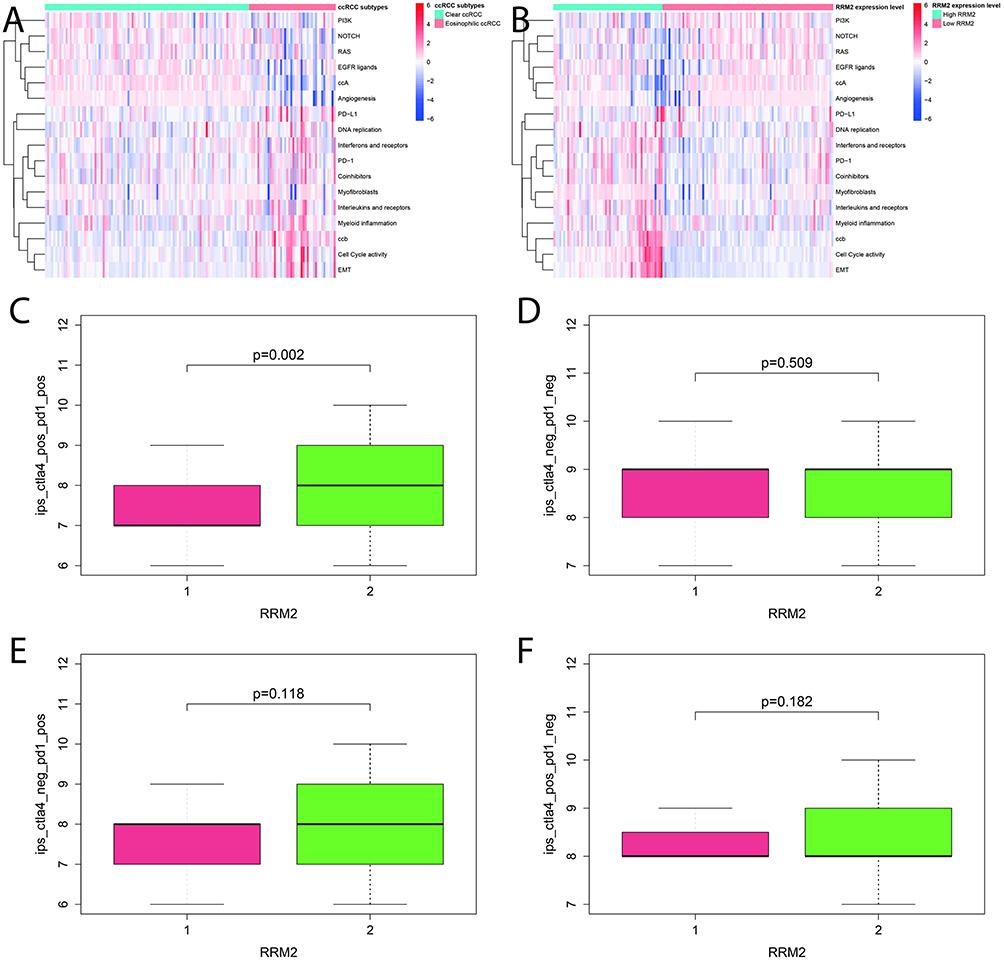 |
Figure 6 Pathway clustering and immune response analysis. (A) Heatmap depicting differential pathway enrichment between eosinophilic and clear cell ccRCC subtypes. (B) Correlation of RRM2 expression with the aforementioned pathways, illustrating a positive association between elevated RRM2 levels and pathways enriched in the eosinophilic subtype. (C–F) Box plots comparing Immunophenoscore (IPS) across RRM2 high (2) and low (1) expression groups, stratified by PD-1 and CTLA-4. |
To predict the efficacy of ICIs therapies, we utilized the Immunophenoscore (IPS) from the Cancer Immunome Atlas (https://tcia.at/home), which integrates data on the expression of major histocompatibility complex (MHC) molecules, immunomodulatory factors, effector cells (ECs), and suppressor cells (SCs) into a comprehensive score. This score is subdivided into four categories: ips_ctla4_pos_pd1_pos, ips_ctla4_pos_pd1_neg, ips_ctla4_neg_pd1_pos, and ips_ctla4_neg_pd1_neg, which helps refine predictions concerning the success of treatments targeting CTLA-4 and PD-1. Notably, patients with elevated RRM2 expression demonstrated significantly higher scores (P=0.002) in the ips_ctla4_pos_pd1_pos category, reinforcing the predictive value of RRM2 expression levels for responsiveness to ICIs therapy in those patients with PD-1 and CTLA-4 positive markers (Figure 6C–F). This evidence supports the potential of RRM2 as a biomarker in guiding treatment decisions for ccRCC.
Histological Subtypes Characteristics of Hospital ccRCC Patients
We identified 39 ccRCC patients who met our classification criteria based on H&E-stained ccRCC phenotypes (eosinophilic vs clear). Analysis of the data showed that 21 patients (54%) were classified as having the eosinophilic subtype, whereas 18 patients (46%) were associated with the clear subtype. Representative images of these phenotypes are depicted in Figure 7. In comparing the two groups, we observed that all patients with the clear subtype presented at an early stage of the disease and predominantly exhibited low-grade tumors (94.4%). The majority were first-time presentations (89%) and underwent partial nephrectomy (61.1%), with a nearly equal distribution across age and gender. Conversely, the eosinophilic subtype predominantly affected younger individuals (62%) and was more common in males (66.7%), with a recurrence rate of (19%). Most patients in this group underwent total nephrectomy (85.7%).
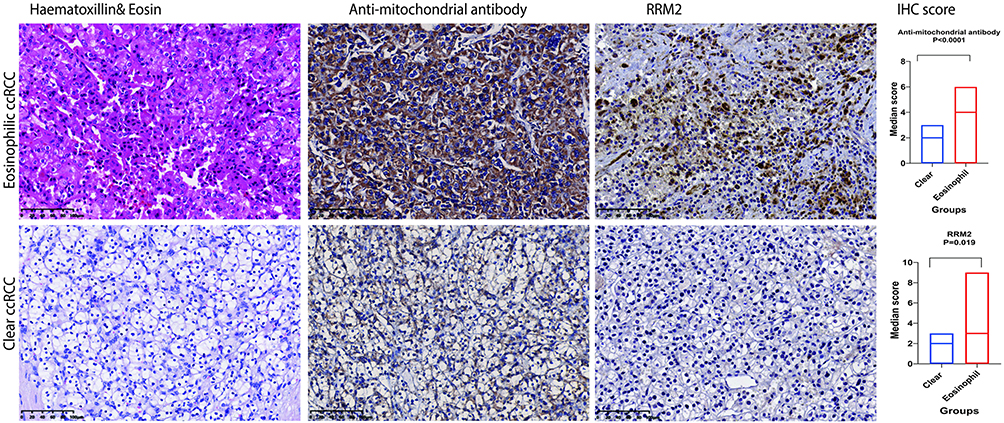 |
Figure 7 Immunohistochemical characterization of ccRCC Subtypes (eosinophilic vs clear). The left panel shows representative H&E and IHC staining for anti-mitochondrial antibody and RRM2. The eosinophilic ccRCC (top row) displays distinct granular morphology in H&E and more intense IHC staining compared to the clear ccRCC (bottom row). Antibodies used are indicated above each column. scale bar = 100 µm. The right panel quantifies IHC scores using the Mann–Whitney U-test, showing significantly higher expression of anti-mitochondrial antibody and RRM2 in eosinophilic ccRCC (P < 0.0001 and P = 0.019, respectively). |
While the differences in most clinicopathological variables between the two subtypes were not statistically significant, the eosinophilic subtype was notably associated with more adverse tumor grade features and a higher frequency of radical nephrectomies, as demonstrated by significant P values of 0.011 and 0.003, respectively (Table 3).
 |
Table 3 Clinicopathological Variables of Clear Cell Renal Cell Carcinoma (ccRCC) Subtypes: Clear vs Eosinophilic in the Hospital Cohort |
Further statistical analysis involved logistic regression to assess the predictive value of various variables in ccRCC subtyping. The results revealed that tumor grade was a significant predictor with an odds ratio of 0.078 (95% CI:0.009–0.704, P=0.023). Additionally, the type of surgery performed also proved to be a significant predictor, with an odds ratio of 0.106 (95% CI:0.023–0.498, P=0.004) Table 4. These findings underscore the importance of these factors in the clinical decision-making process for ccRCC treatment strategies.
 |
Table 4 Logistic Regression Analysis Predicting Subtypes in the Hospital ccRCC Cohort: Eosinophilic vs Clear |
Building on observations from existing literature that associate the eosinophilic appearance in ccRCC with a predominance of cellular organelles such as mitochondria, and the clear subtype with higher lipid content that may wash out during slide preparation,22,24,36,37 and to validate bioinformatic results regarding mitochondrion pathways and mitochondria genes, we aimed to validate these findings at the molecular level. Our study examined the protein expression levels of well-known mitochondrial markers (anti-mitochondrial antibody, and TOM20) via IHC in our hospital’s ccRCC cohort. Results showed more intense staining of these markers in the eosinophilic subtype compared to the clear subtype with a significantly high IHC score in the eosinophilic subtype using an independent test (P<0.05) Figure 7, Supplementary Figure 5. Additionally, we conducted IHC analyses to validate the expression of RRM2, a target gene identified through TCGA analysis, in both eosinophilic and clear subtypes of ccRCC. This analysis confirmed that RRM2 protein expression was significantly higher in the eosinophilic group than in the clear group with a significant high IHC score (P= 0.019) Figure 7.
In summary, our IHC investigations support the findings of previous studies and bioinformatic analyses, demonstrating that both mitochondrial markers and RRM2 show higher expression in the eosinophilic subtype compared to the clear subtype of ccRCC, thereby supporting the proposed underlying biological mechanisms.
Discussion
RCC mostly associated with mitochondrial changes, however the processes driving mitochondrial abnormalities differ amongst RCC subtypes.50 ccRCC represents the most common subtype of RCC, with recent advancements ICIs showing promising results.51 However, eosinophilic ccRCC subtypes exhibit more aggressive molecular behavior, and there is a dearth of data about effective therapy options for this subtype.52 Numerous studies have investigated the molecular differences among ccRCC subtypes and their influence on treatment responses, highlighting potential treatment strategies.5,53 The current study explores the histological subtypes of ccRCC (eosinophilic and clear phenotypes), uncovering significant clinical and genomic distinctions that have important implications for patient prognosis and biological mechanisms.
Our analysis of publicly available and hospital data highlights the prognostic importance of histological phenotyping in ccRCC, confirming the correlation of the eosinophilic phenotype with elevated tumor grade, increased disease aggressiveness, and poorer oncological outcomes, in alignment with prior studies.24,25,54 This study identifies a novel risk signature based on subtypes that predicts prognosis in ccRCC with a sensitivity exceeding 83% at one, two, and three years.
Based on this risk score, RRM2 emerged as the most predictive gene, exhibiting elevated expression in eosinophilic compared to clear subtypes with clinical factors. Our analysis highlights enhanced RRM2 expression in eosinophilic ccRCC subgroups, which also exhibit heightened mitochondrial gene expression. This indicates that RRM2 is crucial for mtDNA synthesis and may influence mitophagy, as seen by the connections between mitochondrial gene expression and RRM2 levels. Furthermore, our examination of RRM2 concerning contemporary ccRCC therapies indicates a significant correlation between RRM2 expression and immune-related pathways, especially in response to ICIs, but not TKIs. Our study builds on this finding by analyzing pathways that distinguish the eosinophilic from the clear cell subtypes. We found that immune-related pathways were enriched in the eosinophilic subtype, while pathways related to TKIs were more prevalent in the clear subtype. These data indicate that targeting RRM2, with ICIs, might enhance therapy outcomes in the eosinophilic ccRCC subgroup. RRM2, a key enzyme in DNA synthesis, repair, replication, and the maintenance of genomic stability has emerged as a significant player in cancer progression, including ccRCC.16,55,56 As part of Ribonucleotide Reductase (RNR) complex, which regulates the de novo synthesis of deoxyribonucleoside triphosphates (dNTPs)- essential for the replication and repair of nuclear and mitochondrial DNA.43,57,58 Investigating the relationship between RRM2, DNA repair mechanisms, and mitochondrial function offers valuable insights into the molecular underpinnings of neoplasms, with implications for targeted therapies and personalized treatment approaches.41,55,59,60 Research show that dysregulation of RRM2 can impair mitochondrial DNA (mtDNA) synthesis, leading to mitochondrial dysfunction, oxidative damage, and tissue deterioration, which might drive oncogenesis.41,42,44,60 Extensive metabolomic analyses have linked metabolic dysregulation with the onset and advancement of ccRCC, further establishing a correlation between enhanced mitochondrial activity and decreased survival rates among a specific patient demographic.61–64 Consistent with these findings, our study elucidates distinct variations in metabolic and mitochondrial pathways and oxidative respiration across different ccRCC subtypes. Previous research has also underscored an elevated mitochondrial presence within the eosinophilic group.22 Additionally, our analysis has verified an increased prevalence of mitochondria in the eosinophilic subtype through the use of anti-mitochondrial gene markers within our hospital’s patient cohort, underscoring the clinical relevance of mitochondrial biomarkers in distinguishing between ccRCC subtypes.
Despite these advancements, our study acknowledges limitations inherent in its retrospective design, cohort size, and the potential impact of prior treatments on histological phenotype. The variation in tissue sampling methods further complicates the direct comparison of metastatic cases. However, the consistency observed between histological phenotype and clinicopathological behavior across our cohorts’ results strengthens the argument for histological phenotyping as a valuable tool in predicting oncological outcomes and tailoring systemic therapies. Additionally, expanding the range of molecular markers analyzed and employing comprehensive genomic profiling techniques could further refine the understanding of ccRCC heterogeneity and its clinical implications.
Conclusion
The distinct prognostic disparities among ccRCC subtypes have been established by our cohort data and the data that is publicly available. The eosinophilic subtype has a worse prognosis relative to the clear ccRCC subtype. We also identified a unique risk score signature among ccRCC subtypes that delineates their molecular differentiation. RRM2 demonstrated its correlation with subtype variations, specifically exhibiting elevated expression in the eosinophilic subtype, with its clinical parameters, notably stage and grade. Furthermore, metabolic and mitochondrial pathways exhibit distinctions between the two kinds. Through clarifying the function of genes such as RRM2 and pathways associated with mitochondria, cell cycle, nucleotide synthesis, immune response, and metabolism, we pinpoint possible targets for treatment for both subtypes. Furthermore, the prediction of ICIs response indicated superior results for the eosinophilic subtype, especially with elevated RRM2 levels. Further research is necessary to validate these findings and explore the full potential of histological and molecular profiling in enhancing the future therapeutic targets for ccRCC.
Data Sharing Statement
The data and materials supporting the findings of this study are included within the article and its Supplementary Material. For additional information, please contact the corresponding authors.
Acknowledgments
The authors would like to acknowledge the patient participants and their relatives, as well as the clinical and research teams. Additionally, the authors express their gratitude to TCGA for the availability of data.
Author Contributions
All authors made a significant contribution to the work reported, whether that is in the conception, study design, execution, acquisition of data, analysis and interpretation, or in all these areas; took part in drafting, revising or critically reviewing the article; gave final approval of the version to be published; have agreed on the journal to which the article has been submitted; and agree to be accountable for all aspects of the work.
Funding
This research did not receive any funding.
Disclosure
The authors have declared no competing interests.
References
1. Siegel RL, Miller KD, Jemal A. Cancer statistics. CA: a Cancer Journal for Clinicians. 2020;70(1):7–30. doi:10.3322/caac.21590
2. Capitanio U, Bensalah K, Bex A, et al. Epidemiology of Renal Cell Carcinoma. European Urology. 2019;75(1):74–84. doi:10.1016/j.eururo.2018.08.036
3. Hsieh JJ, Purdue MP, Signoretti S, et al. Renal cell carcinoma. Nature Reviews. Disease Primers. 2017;3(1):17009. doi:10.1038/nrdp.2017.9
4. Rathmell WK, Rumble RB, Van Veldhuizen PJ, et al. Management of Metastatic Clear Cell Renal Cell Carcinoma: ASCO Guideline. Journal of Clinical Oncology. 2022;40(25):2957–2995. doi:10.1200/JCO.22.00868
5. Pan X-W, Chen W-J, Xu D, et al. Molecular subtyping and characterization of clear cell renal cell carc inoma by tumor differentiation trajectories. iScience. 2023;26(12):108370. doi:10.1016/j.isci.2023.108370
6. Motzer RJ, Escudier B, McDermott DF, et al. Nivolumab versus Everolimus in Advanced Renal-Cell Carcinoma. The New England Journal of Medicine. 2015;373(19):1803–1813. doi:10.1056/NEJMoa1510665
7. Al-Danakh A, Safi M, Alradhi M, et al. Immune Checkpoint Inhibitor (ICI) Genes and Aging in Clear Cell Renal Cell Carcinoma (ccRCC): clinical and Genomic Study. Cells. 2022;11(22):3641. doi:10.3390/cells11223641
8. Motzer RJ, Hutson TE, Cella D, et al. Pazopanib versus sunitinib in metastatic renal-cell carcinoma. New Eng J Med. 2013;369(8):722–731. doi:10.1056/NEJMoa1303989
9. Li X, Tang L, Deng J, et al. Identifying metabolic reprogramming phenotypes with glycolysis-lipid metabolism discoordination and intercellular communication for lung adenocarcinoma metastasis. Commun Biol. 2022;5(1):198. doi:10.1038/s42003-022-03135-z
10. Navarro C, Ortega Á, Santeliz R, et al. Metabolic Reprogramming in Cancer Cells: emerging Molecular Mechanisms and Novel Therapeutic Approaches. Pharmaceutics. 2022;14(6):1303. doi:10.3390/pharmaceutics14061303
11. Martínez-Reyes I, Chandel NS. Cancer metabolism: looking forward. Nat Rev Cancer. 2021;21(10):669–680. doi:10.1038/s41568-021-00378-6
12. Yang J, Ren B, Yang G, et al. The enhancement of glycolysis regulates pancreatic cancer metastasis. Cell Mol Life Sci. 2020;77(2):305–321. doi:10.1007/s00018-019-03278-z
13. Tan SK, Hougen HY, Merchan JR, et al. Fatty acid metabolism reprogramming in ccRCC: mechanisms and potential targets. Nat Rev Urol. 2023;20(1):48–60. doi:10.1038/s41585-022-00654-6
14. Zhu X, Al-Danakh A, Zhang L, et al. Glycosylation in Renal Cell Carcinoma: mechanisms and Clinical Implications. Cells. 2022;11(16):2598. doi:10.3390/cells11162598
15. Di Meo NA, Lasorsa F, Rutigliano M, et al. Renal Cell Carcinoma as a Metabolic Disease: an Update on Main Pathways, Potential Biomarkers, and Therapeutic Targets. Int J Mol Sci. 2022;23(22):14360. doi:10.3390/ijms232214360
16. Karasinska JM, Topham JT, Kalloger SE, et al. Altered Gene Expression along the Glycolysis-Cholesterol Synthesis Axi s Is Associated with Outcome in Pancreatic Cancer. Clin Cancer Res. 2020;26(1):135–146. doi:10.1158/1078-0432.CCR-19-1543
17. Liu Y, Sun Y, Guo Y, et al. An Overview: the Diversified Role of Mitochondria in Cancer Metabolism. Int J Biol Sci. 2023;19(3):897–915. doi:10.7150/ijbs.81609
18. Lin YH, et al. Functional Role of Mitochondrial DNA in Cancer Progression. Int J Mol Sci. 2022;23(3):1.
19. Wang S, Long H, Hou L, et al. The mitophagy pathway and its implications in human diseases. Sig Transduc Target Ther. 2023;8(1):304. doi:10.1038/s41392-023-01503-7
20. Song C, Pan S, Zhang J, et al. Mitophagy: a novel perspective for insighting into cancer and cancer treatment. Cell Prolif. 2022;55(12):e13327. doi:10.1111/cpr.13327
21. Guan Y, Wang Y, Li B, et al. Mitophagy in carcinogenesis, drug resistance and anticancer therapeutics. Cancer Cell International. 2021;21(1):350. doi:10.1186/s12935-021-02065-w
22. Nikolic G, Zivotic M, Cirovic S, et al. The Utility of Mitochondrial Detection Methods Applied as an Additiona l Tool for the Differentiation of Renal Cell Tumors. Diagnostics. 2023;13(14):2319. doi:10.3390/diagnostics13142319
23. Verine J, Colin D, Nheb M, et al. Architectural Patterns are a Relevant Morphologic Grading System for Clear Cell Renal Cell Carcinoma Prognosis Assessment: comparisons With WHO/ISUP Grade and Integrated Staging Systems. The American Journal of Surgical Pathology. 2018;42(4):423–441. doi:10.1097/PAS.0000000000001025
24. Nilsson H, Lindgren D, Axelson H, et al. Features of increased malignancy in eosinophilic clear cell renal cell carcinoma. J Pathol. 2020;252(4):384–397. doi:10.1002/path.5532
25. Yoshida T, Ohe C, Ikeda J, et al. Eosinophilic features in clear cell renal cell carcinoma correlate with outcomes of immune checkpoint and angiogenesis blockade. J Immunother Cancer. 2021;9(9):e002922. doi:10.1136/jitc-2021-002922
26. Grisaru-Tal S, et al. A new Dawn for eosinophils in the tumour microenvironment. Nat Rev Cancer. 2020;20(10):594–607. doi:10.1038/s41568-020-0283-9
27. Guo T, et al. Screening and identification of prognostic genes associated with eosinophilic features of clear cell renal cell carcinoma. Heliyon. 2023;9(6):e16479. doi:10.1016/j.heliyon.2023.e16479
28. Sertel O, Kong J, Shimada H, et al. Computer-aided Prognosis of Neuroblastoma on Whole-slide Images: classification of Stromal Development. Pattern Recognit. 2009;42(6):1093–1103. doi:10.1016/j.patcog.2008.08.027
29. Niazi MKK, Yao K, Zynger DL, et al. Visually Meaningful Histopathological Features for Automatic Grading of Prostate Cancer. IEEE J Biomed Health Inform. 2017;21(4):1027–1038. doi:10.1109/JBHI.2016.2565515
30. Macenko M, et al. A method for normalizing histology slides for quantitative analysis. in
31. Szegedy C, et al., Rethinking the Inception Architecture for Computer Vision. arxiv:1512.00567[cs.CV].
32. Moch H, Cubilla AL, Humphrey PA, et al. The 2016 WHO classification of tumours of the urinary system and male genital organs—part A: renal, penile, and testicular tumours. Eur Urol. 2016;70(1):93–105. doi:10.1016/j.eururo.2016.02.029
33. Vig S, Lambooij JM, Dekkers MC, et al. ER stress promotes mitochondrial DNA mediated type-1 interferon response in beta-cells and interleukin-8 driven neutrophil chemotaxis. Front Endocrinol (Lausanne). 2022;13:991632. doi:10.3389/fendo.2022.991632
34. Bruhn C, Bastianello G, Foiani M. Cancer cell histone density links global histone acetylation, mitochondrial proteome and histone acetylase inhibitor sensitivity. Commun Biol. 2022;5(1):882. doi:10.1038/s42003-022-03846-3
35. Franco S, et al. Defective mitochondrial protein import contributes to complex I-induced mitochondrial dysfunction and neurodegeneration in Parkinson’s disease. Cell Death & Disease. 2018;9:1.
36. Zhang J, Yu W, Ryu SW, et al. Cardiolipins Are Biomarkers of Mitochondria-Rich Thyroid Oncocytic Tumors. Cancer Res. 2016;76(22):6588–6597. doi:10.1158/0008-5472.CAN-16-1545
37. Tallini G. Oncocytic tumours. Virchows Arch. 1998;433(1):5–12. doi:10.1007/s004280050209
38. Smith AC, Robinson AJ. MitoMiner v4.0: an updated database of mitochondrial localization evidence, phenotypes and diseases. Nucleic Acids Res. 2019;47(D1):D1225–d1228. doi:10.1093/nar/gky1072
39. Calvo SE, Clauser KR, Mootha VK. MitoCarta2.0: an updated inventory of mammalian mitochondrial proteins. Nucleic Acids Research. 2016;44(D1):D1251–D1257. doi:10.1093/nar/gkv1003
40. Wang X, Liu X, Xue L, et al. Ribonucleotide reductase subunit p53R2 regulates mitochondria homeostasis and function in KB and PC-3 cancer cells. Biochem Biophys Res Commun. 2011;410(1):102–107. doi:10.1016/j.bbrc.2011.05.114
41. Cho E-C, Kuo M-L, Cheng J-H, et al. RRM2B-Mediated Regulation of Mitochondrial Activity and Inflammation u nder Oxidative Stress. Mediators of Inflammation. 2015;2015(1):287345. doi:10.1155/2015/287345
42. Shakeri M, Kong B, Zhuang H, et al. Potential Role of Ribonucleotide Reductase Enzyme in Mitochondria Function and Woody Breast Condition in Broiler Chickens. Animals. 2023;13(12):2038. doi:10.3390/ani13122038
43. Shakeri M, Berisha D, Martinson A, et al. Ribonucleotide reductase mediated regulation of mitochondrial activity in the adult heart. Biophysical Journal. 2022;121(3):396a–397a. doi:10.1016/j.bpj.2021.11.781
44. Fumagalli M, Ronchi D, Bedeschi MF, et al. A novel RRM2B mutation associated with mitochondrial DNA depletion syndrome. Mol Genet Metab Rep. 2022;32:100887. doi:10.1016/j.ymgmr.2022.100887
45. Chen YF, Lin I-H, Guo Y-R, et al. Rrm2b deletion causes mitochondrial metabolic defects in renal tubules. Sci Rep. 2019;9(1):13238. doi:10.1038/s41598-019-49663-3
46. Xue L, Liu X, Wang Q, et al. Ribonucleotide reductase subunit M2B deficiency leads to mitochondrial permeability transition pore opening and is associated with aggressive clinicopathologic manifestations of breast cancer. Am J Transl Res. 2018;10(11):3635–3649.
47. Brooks SA, Brannon AR, Parker JS, et al. ClearCode34: a prognostic risk predictor for localized clear cell renal cell carcinoma. Eur Urol. 2014;66(1):77–84. doi:10.1016/j.eururo.2014.02.035
48. McDermott DF, Huseni MA, Atkins MB, et al. Clinical activity and molecular correlates of response to atezolizumab alone or in combination with bevacizumab versus sunitinib in renal cell carcinoma. Nature Medicine. 2018;24(6):749–757. doi:10.1038/s41591-018-0053-3
49. Motzer RJ, et al. Molecular Subsets in Renal Cancer Determine Outcome to Checkpoint and Angiogenesis Blockade. Cancer Cell. 2020;38(6):803–817.e4.
50. Bezwada D, et al. Mitochondrial complex I promotes kidney cancer metastasis. Nature. 2024;633(8031):923–931. doi:10.1038/s41586-024-07812-3
51. Wang Y, Suarez ER, Kastrunes G, et al. Evolution of cell therapy for renal cell carcinoma. Molecular Cancer. 2024;23(1):8. doi:10.1186/s12943-023-01911-x
52. Wen N, Li X, Lu J, et al. Quantification of eosinophilic area and its potential molecular featur e in clear cell renal cell carcinoma. Japanese Journal of Clinical Oncology. 2024;54(6):689–698. doi:10.1093/jjco/hyae022
53. Jonasch E, Walker CL, Rathmell WK. Clear cell renal cell carcinoma ontogeny and mechanisms of lethality. Nature Reviews Nephrology. 2021;17(4):245–261. doi:10.1038/s41581-020-00359-2
54. Fuhrman SA, Lasky LC, Limas C. Prognostic significance of morphologic parameters in renal cell carcinoma. Am J Surg Pathol. 1982;6(7):655–663. doi:10.1097/00000478-198210000-00007
55. Xiong W, Zhang B, Yu H, et al. RRM2 Regulates Sensitivity to Sunitinib and PD-1 Blockade in Renal Can cer by Stabilizing ANXA1 and Activating the AKT Pathway. Adv Sci. 2021;8(18):e2100881. doi:10.1002/advs.202100881
56. Giang LH, Wu K-S, Lee W-C, et al. Targeting of RRM2 suppresses DNA damage response and activates apoptosis in atypical teratoid rhabdoid tumor. Journal of Experimental & Clinical Cancer Research. 2023;42(1):346. doi:10.1186/s13046-023-02911-x
57. Wiley CD, Campisi J. The metabolic roots of senescence: mechanisms and opportunities for intervention. Nature Metabolism. 2021;3(10):1290–1301. doi:10.1038/s42255-021-00483-8
58. Kuo M-L, Sy AJ, Xue L, et al. RRM2B Suppresses Activation of the Oxidative Stress Pathway and is Up-regulated by P53 During Senescence. Scientific Reports. 2012;2(1):822. doi:10.1038/srep00822
59. Pontarin G, Ferraro P, Bee L, et al. Mammalian ribonucleotide reductase subunit p53R2 is required for mitochondrial DNA replication and DNA repair in quiescent cells. Proceedings of the National Academy of Sciences. 2012;109(33):13302–13307. doi:10.1073/pnas.1211289109
60. Chen G, Luo Y, Warncke K, et al. Acetylation regulates ribonucleotide reductase activity and cancer cell growth. Nature Communications. 2019;10(1):3213. doi:10.1038/s41467-019-11214-9
61. Bezwada D, et al. Mitochondrial metabolism in primary and metastatic human kidney cancers. bioRxiv. 2023;2023:1.
62. Coffey NJ, Simon MC. Metabolic alterations in hereditary and sporadic renal cell carcinoma. Nature Reviews Nephrology. 2024;20(4):233–250. doi:10.1038/s41581-023-00800-2
63. Rupert C, Dell’ Aversana C, Mosca L, et al. Therapeutic targeting of P2X4 receptor and mitochondrial metabolism in clear cell renal carcinoma models. Journal of Experimental & Clinical Cancer Research. 2023;42(1):134. doi:10.1186/s13046-023-02713-1
64. Gu Y-R, Kim J, Na JC, et al. Mitochondrial metabolic reprogramming by SIRT3 regulation ameliorates drug resistance in renal cell carcinoma. PLoS One. 2022;17(6):e0269432. doi:10.1371/journal.pone.0269432
 © 2024 The Author(s). This work is published and licensed by Dove Medical Press Limited. The
full terms of this license are available at https://www.dovepress.com/terms.php
and incorporate the Creative Commons Attribution
- Non Commercial (unported, 3.0) License.
By accessing the work you hereby accept the Terms. Non-commercial uses of the work are permitted
without any further permission from Dove Medical Press Limited, provided the work is properly
attributed. For permission for commercial use of this work, please see paragraphs 4.2 and 5 of our Terms.
© 2024 The Author(s). This work is published and licensed by Dove Medical Press Limited. The
full terms of this license are available at https://www.dovepress.com/terms.php
and incorporate the Creative Commons Attribution
- Non Commercial (unported, 3.0) License.
By accessing the work you hereby accept the Terms. Non-commercial uses of the work are permitted
without any further permission from Dove Medical Press Limited, provided the work is properly
attributed. For permission for commercial use of this work, please see paragraphs 4.2 and 5 of our Terms.