")
Back to Journals » Journal of Inflammation Research » Volume 17
Identification and Validation of IFI44 as a Novel Biomarker for Primary Sjögren’s Syndrome
Authors Wei B, Yue Q , Ka Y, Sun C, Zhao Y, Ning X, Jin Y, Gao J, Wu Y , Liu W
Received 11 July 2024
Accepted for publication 16 August 2024
Published 28 August 2024 Volume 2024:17 Pages 5723—5740
DOI https://doi.org/10.2147/JIR.S477490
Checked for plagiarism Yes
Review by Single anonymous peer review
Peer reviewer comments 2
Editor who approved publication: Professor Ning Quan
Bowen Wei,1,2,* Qingyun Yue,1,2,* Yuxiu Ka,1,2,* Chenyang Sun,1,2 Yuxing Zhao,1,2 Xiaomei Ning,1,2 Yue Jin,1,2 Jingyue Gao,1,2 Yuanhao Wu,1,2 Wei Liu1,2
1Department of Rheumatism and Immunity, First Teaching Hospital of Tianjin University of Traditional Chinese Medicine, Tianjin, People’s Republic of China; 2National Clinical Research Center for Chinese Medicine Acupuncture and Moxibustion, Tianjin, People’s Republic of China
*These authors contributed equally to this work
Correspondence: Wei Liu, Email [email protected]
Background: Primary Sjögren’s syndrome (pSS) is an autoimmune condition marked by lymphocyte infiltration in the exocrine glands. Our study aimed to identify a novel biomarker for pSS to improve its diagnosis and treatment.
Methods: The gene expression profiles of pSS were obtained from the Gene Expression Omnibus (GEO) database. The specific differentially expressed genes (DEGs) were screened by the Least Absolute Shrinkage and Selection Operator (LASSO), Random Forest (RF), and Recursive Feature Elimination with Support Vector Machines (SVM-RFE). A biomarker was picked out based on correlation and diagnostic performance, the connection between the biomarker and clinical traits and immune infiltrating cells was explored, and the biomarker’s protein expression level in the serum of pSS patients was detected by enzyme-linked immunosorbent assay (ELISA). The competitive endogenous RNA (ceRNA) network regulated by the biomarker was predicted to verify the reliability of the biomarker in diagnosing pSS.
Results: IFI44, XAF1, GBP1, EIF2AK2, IFI27, and IFI6 showed prominent diagnostic ability, with the high accuracy (AUC = 0.859) and significance (R ≥ 0.8) of IFI44 within the training dataset. IFI44 strongly exhibited a negative correlation with resting NK cells, macrophages M0, and eosinophils, and a positive correlation with activated dendritic cells, naive B cells, and activated CD4 memory T cells. Furthermore, IFI44 was significantly positively correlated with clinical traits such as IgG, SSA, SSB, ANA, and ESSDAI, with its protein expression level in the serum of pSS patients being notably elevated compared to controls (p < 0.001). Finally, the ceRNA regulatory network showed that hsa-miR-944, hsa-miR-9-5p, hsa-miR-126-5p, and hsa-miR-335-3p were significantly targeted IFI44, suggesting that IFI44 may serve as a dependable biomarker for pSS.
Conclusion: In this study, we dug out IFI44 as a biomarker for pSS, systematically studied the potential regulatory mechanism of IFI44, and verified its reliability as a biomarker for pSS.
Keywords: primary Sjögren’s syndrome, machine learning, immune cell infiltration, biomarker, IFI44
Introduction
Primary Sjögren’s syndrome (pSS) is a complicated and heterogeneous autoimmune disorder with clinical symptoms characterized by exocrine gland dysfunction1 and immunopathogenesis involving infiltration of T and B lymphocytes,2 which will lead to symptoms such as xerostomia, xerophthalmia, fatigue, joint pain, and potentially resulting in serious complications such as lymphoma.3 The prevalence of pSS ranges from 0.03% to 5% across different countries, while, it is about 0.33–0.77% in China,4,5 and the standard death rate is 3.63.6 However, the precise biological mechanisms underlying pSS remain unclear, with no definitive diagnostic markers that are both sensitive and specific. Understanding the pathophysiology linked to pSS is essential for diagnosing and treating patients experiencing dryness symptoms, fatigue, and joint discomfort, thereby enhancing their quality of life.
Because of the clinical heterogeneity of pSS, the current diagnostic method relies on minor salivary gland biopsy (MSGB)7,8 in conjunction with clinical symptoms and autoimmune serology.9,10 Typical diagnostic markers for pSS include anti-Ro/SSA, anti-La/SSB, antinuclear antibodies, rheumatoid factor, etc.11,12 However, MSGB, an invasive test, may lead to uncomfortable symptoms and complicating disease13 and the diagnosis may be influenced by the subjective decision of the observer.14 Anti-Ro/SSA antibodies may suggest a more advanced disease stage, and depending solely on it for diagnosis may result in insufficient detection of early pSS.15 Furthermore, patients with primary biliary cholangitis (formerly called primary biliary cirrhosis) are frequently anti-SSA antibody positivity, but autoimmune liver disease and primary biliary cholangitis are rarely associated with pSS.16 Importantly, also patients with HCV liver disease may develop autoantibodies and autoimmune phenomena including secondary SS.17 Similarly, anti-SSB antibodies can also be detected positively in other autoimmune disorders such as systemic lupus erythematosus, rheumatoid arthritis, and secondary SS.18–20 Therefore, it is necessary to find a sensitive, specific, and accurate non-invasive diagnostic method to aid in the early diagnosis of pSS. Previous studies11,12 have provided many serum, salivary, and histologic biomarkers, such as C-X-C motif chemokine 13 (CXCL13), histone S, interleukin (IL)-4, IL-5, and certain genes stimulated by type I and type II IFNs. However, there is no single laboratory, clinical, pathologic, or radiologic feature that can reach the “gold standard” for the diagnosis of pSS.21 Scientists continue to explore novel disease biomarkers to advance simpler and quicker diagnostic approaches for pSS.
In recent years, the development of gene microarray and high-throughput technology has enabled the rapid and effective screening of differentially expressed genes (DEGs), clarifying pathogenic mechanisms, and identifying potential targets for therapy through bioinformatics analysis.22 A range of machine learning algorithms have been extensively utilized for disease model prediction, with improving accuracy and advancing applicability and validity in risk prediction, disease diagnosis, and outcome prediction.23 It has become one of the important analytical tools in the medical field. Our previous study24 screened cluster-specific DEGs through WGCNA and then identified the machine learning model with the highest accuracy to predict 5 hub genes, which mainly focused on the association between cuproptosis and pSS, as well as its possible role in pSS. Our study aimed to recognize the most accurate biomarker related to immune infiltration for pSS diagnosis with high effectiveness by machine learning algorithms. Finally, the reliability of the biomarker was verified in various aspects such as external validation datasets, clinical traits, and enzyme-linked immunosorbent assay (ELISA).
Materials and Methods
Data Collection and Pre-Processing
In the Gene Expression Omnibus (GEO) database (https://www.ncbi.nlm.nih.gov/geo/), the search term “primary Sjögren’s syndrome” was utilized to explore gene expression profiles, with the restriction type set as “series”, the assay/data classification as “expression profiling by array”, and the organism as “Homo sapiens”. Four eligible datasets were picked out: GSE51092, GSE66795, GSE84844, and GSE40611 (Table 1). The probe names in each dataset were converted to gene symbols according to the annotation files. The combat function of the “SVA” package of the R software (version 4.1.2) was applied to merge GSE51092 and GSE66795, and after eliminating the batch effect, they were employed as the training dataset. Three hundred and twenty-one pSS samples and 61 control samples were performed analysis for differential expression by the “limma” package. GSE84844 and GSE40611 served as the validation dataset independently. DEGs thresholds were defined as samples with adjusted false positive rates of p < 0.05.
 |
Table 1 Eligible Gene Expression Datasets |
Data Processing and DEG Screening
Based on the annotation information of the platform file, the analysis commenced by transforming the probe matrix into a gene matrix. The final expression value of each gene was decided by calculating the average of multiple probes corresponding to a single gene. After data normalization, adjusted p < 0.05 and |logFC| > 1 were set as the filtering conditions, and the DEGs between pSS patients and controls were analyzed via the “limma” package, and “ggplot2” was utilized to generate a volcano plot.
Screening Specific DEGs by Machine Learning
We applied three machine learning algorithms to screen for DEGs, which are named Least Absolute Shrinkage and Selection Operator (LASSO), Support Vector Machine Recursive Feature Elimination Algorithm (SVM-RFE), and Random Forest (RF), and then the overlap of the screening consequences of the three algorithms was taken to identify the specific DEGs of pSS. A 10-fold cross-validation of the LASSO regression analysis was conducted using the “glmnet” package to optimize the parameters through penalization. As a dimensionality reduction method, LASSO regression shows better performance in evaluating high-dimensional data and uses regularization to improve prediction accuracy.25 RF, a supervised machine learning algorithm noted in decision tree methods, was designed to address both regression and classification tasks. Feature importance was decided by the average decrease in the Gini index computed by RF.26 SVM-RFE, evaluated based on the average false positive rate by the “e1071” package,27 can rank features recursively to mitigate overfitting.28 We used the “limma” “ggpubr” packages to draw the line chart of the expression levels of the specific DEGs of pSS and violin plots of differential analysis, plotted the receiver operating characteristic (ROC) curves, and utilized the “pROC” package to evaluate the predictive ability of the specific DEGs.29 When the area under the curve (AUC) > 0.700, it indicated that the models or genes were accurate in diagnosing the disease.
Validation of Diagnostic Performance of Specific DEGs
ROC curves for the specific DEGs were generated in the validation dataset using “glmnet” “pROC”, and evaluated based on their results, and the AUC was computed to measure the diagnostic performance of specific DEGs.
Functional Annotation Analysis
The specific DEG with the highest diagnostic performance was selected as the biomarker, and the training dataset samples were categorized into low- and high-expression groups based on the biomarker’s expression levels. The median was used as the critical value of each gene so that the differences in gene expression between the low-expression group and the high-expression group were computed, and these differential genes’ connection was examined and graphically shown. Single-gene enrichment analysis based on the biomarker was performed by “clusterProfiler”, “colorspace”, “ggpolt2”, “enrichplot”, “stringi”, etc. GO and KEGG entries with significant enrichment were screened out and generated visualization results.
Evaluation of Immune Cell Infiltration
The CIBERSORT algorithm, a dependable machine learning technique based on linear support vector regression (SVR), is commonly applied to evaluate the relative abundance of 22 immune cells and the dynamic regulatory processes and is excellent in identifying human immune cell phenotypes concerning handling noise and unknown mixed content. We uploaded the gene matrix to the CIBERSORT database (https://cibersortx.stanford.edu/) and estimated the relative abundance of 22 immune cells in the LM22 feature matrix. Monte Carlo sampling was employed in CIBERSORT to calculate the p-value of the inverse ploidy product for each sample. p < 0.05 for the immune cell component was considered accurate. Each sample’s predicted immune cell type scores added up to one. Correlation heatmaps of 22 immune cell infiltration levels were drawn using the “corrplot” package, box plots of differences in immune cell infiltration were plotted in the “ggplot2” package, and differences in immune cell function were analyzed between the low- and high-expression groups.
Correlation Analysis Between the Biomarker and Infiltrating Immune Cells
Spearman correlation coefficient was calculated with the filter condition set to p < 0.05, to obtain the correlation and p-values between the biomarker expression and the proportional distribution of immune cells, and to generate a scatter plot.
Correlation Analysis Between Clinical Traits and the Biomarker
The Nephroseq V5 tool (https://nephroseq.org/) was used to assess the relationship between the biomarker and clinical traits such as IgG, SSA, SSB, ANA, and ESSDAI in pSS patients, and the “ggplot2” package was applied to create a scatter plot.
Construction of Biomarker-Targeted Competitive Endogenous RNA (ceRNA) Regulatory Network
The miRWalk website (http://mirwalk.umm.uni-heidelberg.de/) miRanda, miRDB, and TargetScan software were utilized to predict miRNAs targeting the biomarker (screening criteria: CLIP-DATA ≥ 1). Then, we aligned the predicted miRNAs with differential expression miRNAs to screen for key miRNAs with opposite expression trends to the biomarkers. Similarly, the StarBase database (http://starbase.sysu.edu.cn/) was employed to predict lncRNAs targeting miRNAs in identical relational pairs and retained lncRNAs with contrary trends of expression to the key miRNAs. Eventually, the lncRNA-miRNA-mRNA network was depicted using the “Cytoscape” package (v3.7.2).
Clinical Specimens
At the First Teaching Hospital of Tianjin University of Traditional Chinese Medicine (Tianjin, China), 36 pSS patients and 30 controls were recruited for the study. The following were the criteria for inclusion of patients with pSS: compliance with the 2002 European criteria proposed by the American-European Consensus Group;30 pSS duration of less than 10 years; and the treatment was restricted to disease-modifying antirheumatic drugs (DMARDs) and non-steroidal anti-inflammatory drugs (NSAIDs). The criteria for inclusion of the controls: Undergo an examination at our hospital’s Department of Physical Examination and voluntarily participate in the study; No history of SS; Aged over 18 years; Physical examination, routine blood test, liver and kidney function tests are within normal range. The Ethics Committee of the First Teaching Hospital of Tianjin University approved the clinical trial (TYLL2018[K]026). All participants provided their formal, informed, and written consent, expressly agreeing to donate serum samples for the study. These samples were processed to separate serum, and stored at −80°C.
ELISA
IFI44 ELISA kit (TW-0215) was sourced from SHANGHAI TONGWEI BIOTECHNOLOGY CO., LTD (Shanghai, China). The test was conducted following the instructions provided by the manufacturer.
Statistical Analysis
The statistical analyses were carried out using SPSS 20.0 software. Categorical variables were reported in percentages, while quantitative data were presented as means ± SD. χ²-test was employed to compare the categorical variables between the two groups. In quantitative data, an independent-sample t-test was conducted for variables with a normal distribution. Otherwise, we also use a nonparametric test (Mann–Whitney U–test) for the data analysis. For statistical significance, p < 0.05 was the threshold.
Results
Results of DEG Screening
The detailed study design is illustrated in a flow chart in Figure 1. We analyzed 321 pSS samples and 61 control samples of the training dataset and merged them to remove the batch effect (Figure 2A) during the study period. A total of 29 DEGs were obtained (Figure 2B), among which 28 DEGs were up-regulated and 1 DEG was down-regulated, and the results were shown in the volcano plot (Figure 2C).
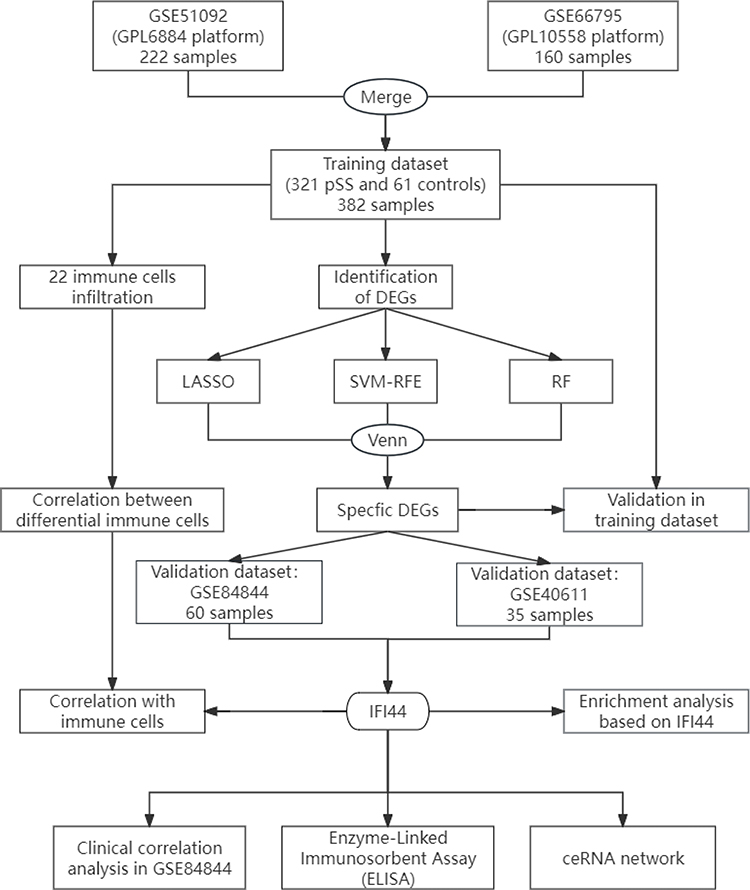 |
Figure 1 Flow chart of the study. |
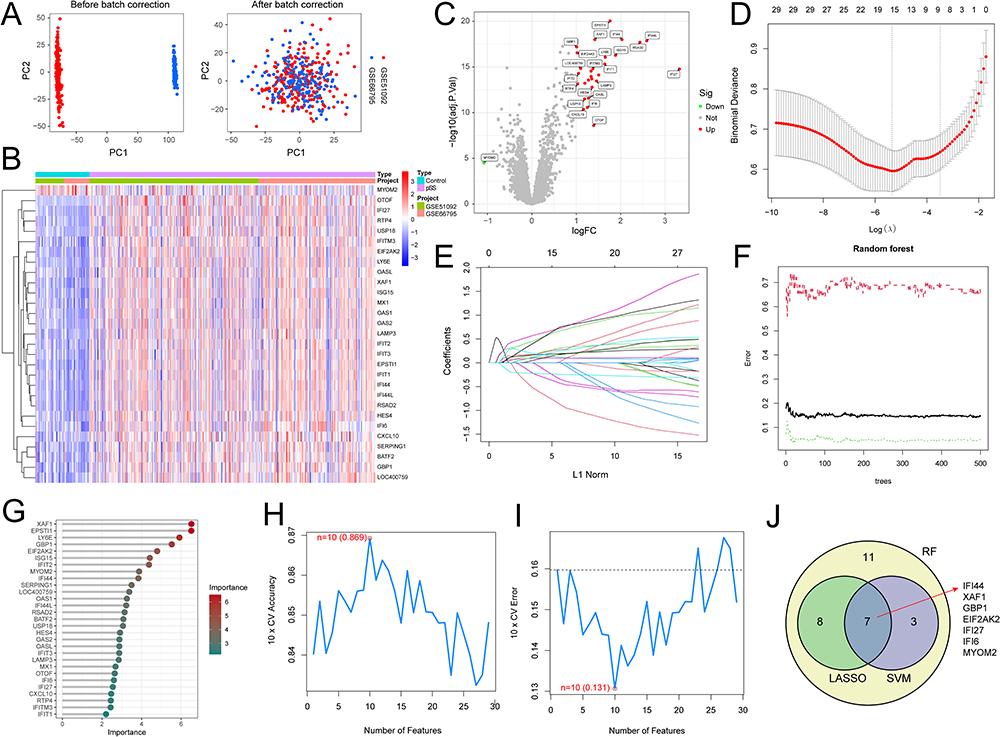 |
Figure 2 Screening of specific DEGs. (A) Results of removing batch effects before and after merging. (B) Heatmap of DEGs. (C) Volcano plot of DEGs. (D and E) Diagram illustrating the regression coefficient path and cross-validation curves in the LASSO regression. (F and G) RF-based feature importance identification. (H and I) Curves depicting variations in predicted true and error values for each gene in the SVM-RFE algorithm. (J) Screening results of three machine learning algorithms. |
Results of Specific DEG Screening
Using the LASSO regression algorithm, 15 candidate-specific DEGs were selected (Figure 2D and E). The optimal number of decision trees was derived as 29 by the RF algorithm, which served as candidate-specific DEGs (Figure 2F and 2). And 10 candidate-specific DEGs were identified with the SVM-RFE algorithm (Figure 2H and I). The overlap genes produced in the three machine learning techniques served as specific DEGs, named IFI44, XAF1, GBP1, EIF2AK2, IFI27, IFI6, and MYOM2 (Figure 2J). Their expression levels in the training dataset were shown in Figure 3A, with IFI44, XAF1, GBP1, EIF2AK2, IFI27, and IFI6 all overexpressed in pSS (p < 0.001) (Figure 3B–G), while MYOM2 was significantly reduced (p < 0.001) (Figure 3H).
 |
Figure 3 Expression levels of the specific DEGs. (A) Line chart of the expression levels of the 7 specific DEGs. (B–H) Expression differences of the 7 specific DEGs in pSS and controls. Notes: ***p < 0.001. |
Diagnostic Performance of Specific DEGs in the Training Dataset
The ROC analysis demonstrated that IFI44, XAF1, GBP1, EIF2AK2, IFI27, and IFI6 showed a favorable diagnostic ability (AUC > 0.700), with AUCs of 0.859 (0.816–0.900), 0.858 (0.810–0.899), 0.848 (0.793–0.892), 0.844 (0.797–0.889), 0.833 (0.790–0.874), and 0.782 (0.724–0.837), respectively; whereas MYOM2 was excluded because of its low diagnostic ability (AUC = 0.681) (Table 2).
 |
Table 2 Diagnostic Performance of 7 Specific DEGs in Identifying pSS |
Diagnostic Performance of Specific DEGs in the Validation Dataset
In the validation dataset GSE84844, the overall AUC of the predictive model reached 0.978, and the AUC values of IFI44, XAF1, GBP1, EIF2AK2, IFI27, and IFI6 were 0.887, 0.784, 0.817, 0.811, 0.812, and 0.879, respectively, all showing favorable diagnostic ability (AUC > 0.700) (Figure 4A and B). And the expression levels of the specific DEGs were all significantly elevated (p < 0.001) (Figure 4C–H). In another validation dataset GSE40611, the AUC of the predictive model was 0.905, and the AUC values of IFI44, XAF1, GBP1, EIF2AK2, IFI27, and IFI6 were 0.892, 0.899, 0.814, 0.879, 0.804, and 0.781, all showing favorable diagnostic ability (AUC > 0.700) (Figure 4I and J), and the expression levels of the specific DEGs were all significantly elevated (p < 0.01) (Figure 4K–P).
 |
Figure 4 Evaluating the diagnostic performance of the 6 specific DEGs in the validation dataset. (A and B) ROC curves of the specific DEGs in GSE84844. (C–H) Expression differences of the specific DEGs in GSE84844. (I and J) ROC curves of the specific DEGs in GSE40611. (K–P) Expression differences of specific DEGs in GSE40611. Notes: **p < 0.01, ***p < 0.001. |
Single-Gene Enrichment Analysis Based on IFI44
The correlations between IFI44 and other specific DEGs were all greater than 0.8 (p < 0.05), with the highest correlation with XAF1 (R = 0.91), the lowest correlation with GBP1 (R = 0.8) (Figure 5A), and IFI44 was selected as a biomarker for pSS because of the highest AUC value (0.859) in the training dataset. The 21 differential genes between the high- and low- IFI44 expression groups were screened based on |logFC| ≥ 1 and adjusted p < 0.05 (Figure 5B), of which 20 differential genes were found to be positively correlated with IFI44 (R ≥ 0.8, p < 0.05), such as IFI44L, RSAD2, etc. (Figure 5C). GO enrichment analysis highlighted that the differential genes were predominantly involved in biological processes related to viral interaction, including response to virus, defense response to virus, defense response to symbiont, and virus genome replication (Figure 5D). The KEGG enrichment analysis results indicated that the differential genes were primarily enriched in the pathway associated with Influenza A, Hepatitis C, and Coronavirus disease - COVID-19 signaling pathways (Figure 5E).
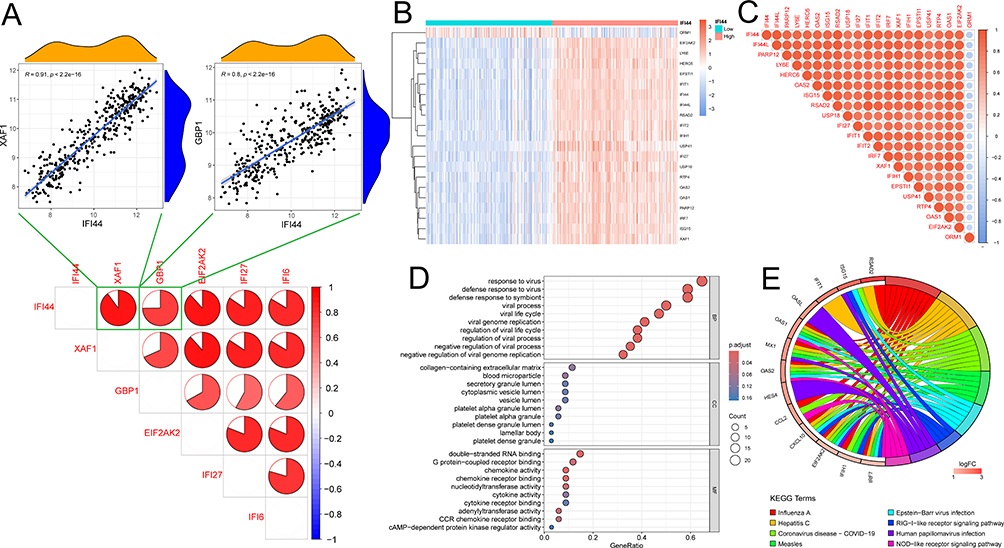 |
Figure 5 Single-gene enrichment analysis based on IFI44. (A) The correlations between IFI44 and other specific DEGs. (B and C) Differential genes and their correlation between the high- and low-IFI44 expression groups; Red represents a positive correlation, blue signifies a negative correlation, and correlation coefficients were denoted by the size of each segment in the pie chart. (D) Bubble plot of enriched GO terms. BP, biological process; CC, cellular component; MF, molecular function. (E) Chord diagram of enriched KEGG terms. |
Evaluation of Immune Cell Infiltration
Using CIBERSORT to calculate the percentage of 22 types of immune cells in the training dataset and plotting the stacked histograms (Figure 6A) to compare the differences in immune cell infiltration levels between pSS and controls, it was found that the levels of resting CD4 memory T cells and activated dendritic cells were significantly increased in pSS (p < 0.05) (Figure 6B). Whereas correlation analysis among immune cells revealed a significant positive correlation (p < 0.05) between CD8 T cells and activated NK cells (R = 0.49), B memory cells, and T regulatory cells (Tregs) (R = 0.36). Activated dendritic cells and M0 Macrophages (R = −0.42), CD8 T cells and Monocytes (R = −0.40), and activated NK cells and resting NK cells (R = −0.39) were significantly negatively correlated (p < 0.05) (Figure 6C). The high- and low-IFI44 expression groups exhibited significant differences (p < 0.05) in 21 immune cell-related functions such as T cell subtypes, pro-inflammatory response, and IFN response (Figure 6D).
 |
Figure 6 Immune cell infiltration analysis. (A) Histogram of immune cell infiltration. (B) Box plot of immune cell infiltration. (C) Heatmap of correlation analysis between immune infiltrating cells. (D) Correlation between specific DEGs and the functional level of immune cells. Notes: *p < 0.05, **p < 0.01, ***p < 0.001. |
Correlation Analysis Between IFI44 and Immune Infiltrating Cells
The findings from immune cell correlation analysis (Figure 7A) showed that IFI44 was significantly positively correlated (p < 0.05) with activated dendritic cells (R = 0.73), naive B cells (R = 0.19), and activated CD4 memory T cells (R = 0.11) (Figures 7B–D), and significantly negatively correlated (p < 0.05) with Eosinophils (R = −0.15), resting NK cells (R = −0.23), and Macrophages M0 (R = −0.33) (Figures 7E–G).
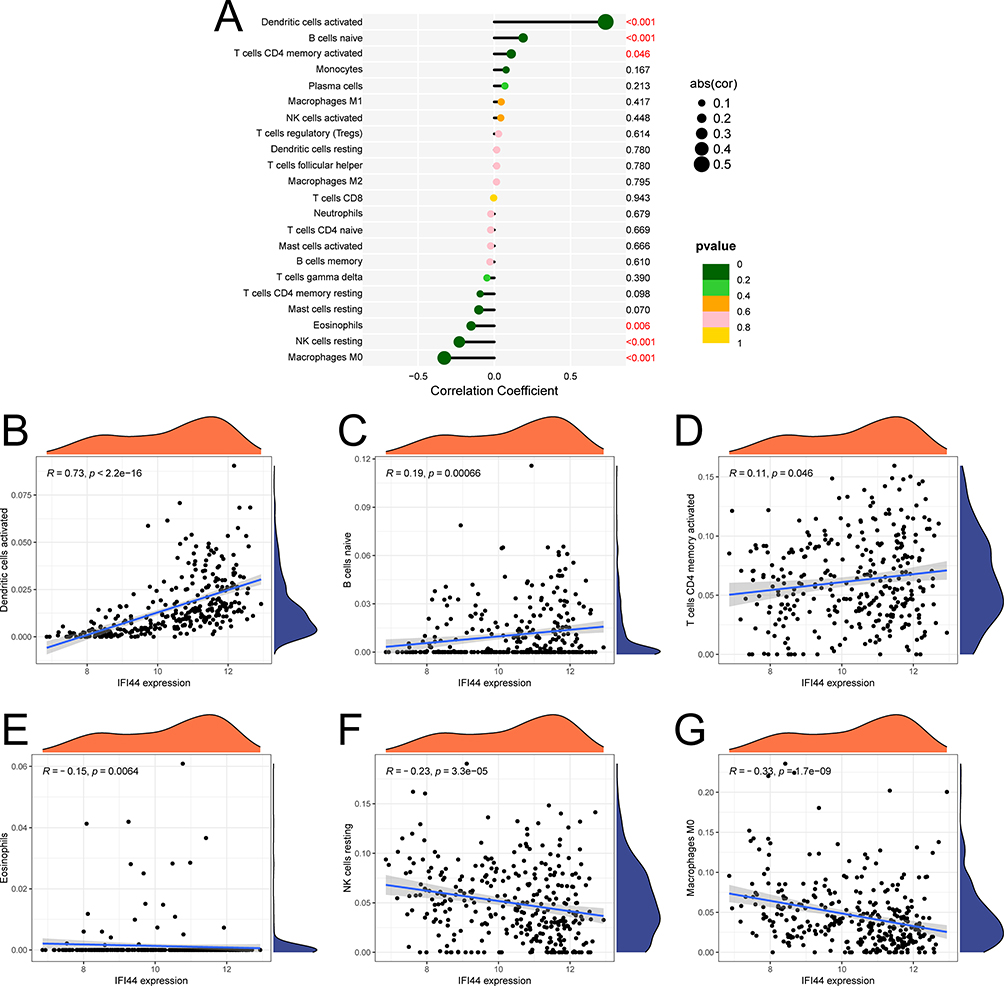 |
Figure 7 Correlation between IFI44 and immune infiltrating cells. (A) Correlation bubble plot. (B–G) Correlation scatter plot between the biomarker and immune cell infiltration levels. |
Correlation Between IFI44 and Clinical Traits of pSS
In GSE84844, there was a significant positive correlation (p < 0.05) between IFI44 and IgG (R = 0.58), SSA (R = 0.83), SSB (R = 0.57), ANA (R = 0.47), and ESSDAI (R = 0.43) (Figures 8A–E).
 |
Figure 8 Clinical relations of IFI44. (A–E) Correlation between IFI44 and IgG, SSA, SSB, ANA, ESSDAI. (F) The protein expression levels of IFI44 in serum of pSS patients and controls. Notes: ***p < 0.001. |
Validation of Protein Expression Levels of IFI44 in Serum of pSS Patients
The contrast of clinical characteristics between pSS patients and controls was shown in Table 3. pSS patients exhibited elevated levels of anti-SSA, anti-SSB, RF, and ESR compared to controls. Moreover, we confirmed the IFI44 protein expression in serum samples. The findings indicated that pSS patients had serum levels of the IFI44 protein that were noticeably greater than those of controls (p < 0.001) (Figure 8F).
 |
Table 3 Comparison of Clinical Characteristics Between pSS Patients and Controls |
The IFI44-Targeted ceRNA Network
Through the miRWalk website, miRanda, miRDB, and TargetScan software were used to predict the miRNAs of IFI44, and 7 miRNAs were predicted. In addition, IFI44-miRNA pairs exhibiting contrasting expression trends were also chosen, with four matching miRNAs, that are hsa-miR-944, hsa-miR-9-5p, hsa-miR-126-5p, and hsa-miR-335-3p. Likewise, six miRNA-lncRNA pairs exhibiting contrasting expression trends were predicted in the StarBase website, named has-miR-944 binding to RP5-1077H22.2, has-miR-9-5p binding to RP11-397O4.1, has-miR-126-5p binding to RP11-164O23.8 and RP11-517O13.1, and has-miR-335-3p binding to SLC8A1-AS1, CTA-392E5.1, RP11-146D12.2, RP11-335L23.4, LINC01122, and RP11-96K19.4. Finally, the network consisted of 15 nodes and 14 edges. Cytoscape provides visualization for the ceRNA network, showing that IFI44 is crucial in pSS and able to act as a disease diagnostic biomarker (Figure 9).
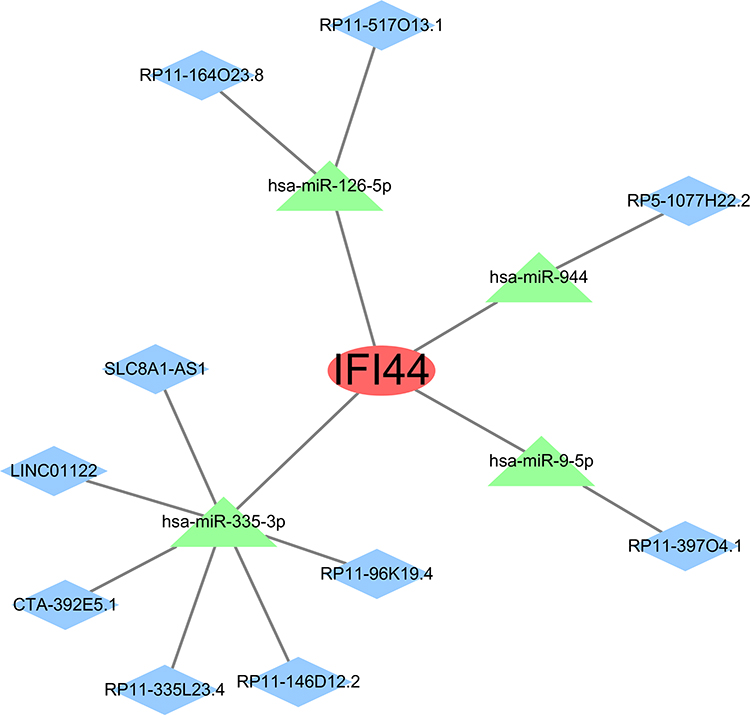 |
Figure 9 The mRNA-miRNA-lncRNA network targeting IFI44. Red ovals indicate the biomarker, green triangles indicate miRNAs and blue diamonds indicate lncRNAs. |
Discussion
pSS is a chronic inflammatory disease characterized by impaired secretory gland function, marked by B and T lymphocyte infiltration,2 and around 20%–40% of pSS patients may have extra-glandular involvement,3 with lymphoma being the main cause of death.31 Because of the heterogeneity of various etiologies and clinical phenotypes, identifying key biomarkers is crucial for understanding the complex mechanism of pSS. Therefore, this study utilized bioinformatics approaches to identify potential biomarkers of pSS, explore the characterized genes closely linked to the development of pSS, and explore intervention targets, aiming to offer new insights into early diagnosis and treatment of pSS.
In recent years, Li32 and Zhong33 et al revealed biomarkers in salivary glands and blood of pSS patients, respectively. We extended and further studied biomarkers for pSS: Firstly, we used three better machine learning methods with stronger biomarker recognition ability. Secondly, parotid gland samples can reflect the disease more accurately, whereas blood samples are more readily available and more likely to be duplicated in subsequent clinical monitoring. We validated our predictions in blood samples and parotid gland samples separately. Finally, we merged 2 large sample-size datasets, which made the biomarkers we screened more credible, precise, and versatile. In addition, innate immune response and type I IFN signaling pathway included in our enriched pathways are common pathways associated with pSS. This suggested that the biomarker dug out in DEGs may be a credible biomarker for the pSS.
In this study, we found 29 DEGs in the training dataset of pSS patients and controls. To screen for potential diagnostic biomarkers of pSS, we applied machine learning with three different algorithms (LASSO, RF, and SVM-RFE) to analyze these 29 DEGs and identified 6 genes (IFI44, XAF1, GBP1, EIF2AK2, IFI27, and IFI6) as specific DEGs. IFI44 (Interferon-induced protein 44), correlated with immune cell infiltration, can emerge as a favorable diagnostic marker for SS and may be a new diagnostic and therapeutic target for SS.34 IFI44, a type I IFN characteristic gene, which is overexpressed in CD14 monocytes of pSS patients.35 Type I IFN in monocytes is associated with higher ESSDAI, autoantibody production, B cell-activating factor (BAFF) gene expression, rheumatoid factor, serum IgG, and lower C3 complement levels.36 The expression level of XAF1 (XIAP-associated factor 1) elevates in SS patients and has been considered to be a possible hub gene in SS.36,37 IFN-stimulated genes revealed the most significant differences between SS patients and healthy controls in a microarray screen, and IFI27 (interferon alpha-inducible protein 27, mitochondrial) showed elevated expression levels in the peripheral blood of patients with SS.38 Meanwhile, THP-1 cells were stimulated with pSS serum in the presence of a blocking IFN-α/β receptor antibody or isotype control showed significantly higher levels of IFI27 expression.39 IFI44, XAF1, IFI27, and IFI6 (interferon alpha-inducible protein 6) are IFN-stimulated genes, mainly produced by plasmacytoid dendritic cells (pDC).36,38 There is ample evidence indicating that type I IFN plays a significant role in the pathogenesis and progression of pSS through immune dysregulation.40 For instance, it can affect the immune system to pSS, participate in the antiviral response activation, and regulate the immune response by interacting with the relevant receptors.41 GBP1 (Guanylate-binding protein 1) is a type II IFN-stimulated gene produced by T lymphocytes, natural killer (NK) cells, and natural killer T (NKT) cells. NKT cells and immunohistochemistry of salivary gland epithelial cells revealed that GBP1 protein expressed significantly higher in the SG of SS patients than in the non-SS group.42 EIF2AK2 (interferon-induced, double-stranded RNA-activated protein kinase) gene in chromosome 2, can encode the improved protein kinase R (PKR), an IFN-induced double-stranded RNA-activated protein kinase.43 Research has shown that EIF2AK2 is a pSS diagnostic gene,44 and the gene encoding PKR is linked to the treatment of pSS, verifying EIF2AK2 plays a crucial role in the development of pSS,45 and RT-qPCR further confirmed the significant elevation of EIF2AK2 in clinical PBMC samples from pSS patients.46 ROC curves have shown the high accuracy (AUC = 0.859) and significance (R ≥ 0.8) of IFI44 to identify pSS samples from non-pSS samples, which were validated in both blood samples and parotid gland samples. Therefore, IFI44 was served as a biomarker for pSS.
We also analyzed the association between IFI44 and immune-infiltrating cells, and IFI44 showed a positive correlation with activated dendritic cells, naive B cells, and activated CD4 memory T cells, while negatively correlated with Eosinophils, resting NK cells, and Macrophages M0. T lymphocytes are deemed crucial in the immunopathogenesis of pSS, while the activation of B cells can expedite disease progression and lead to specific disease manifestations.47 Studies have found that CD4+ T cells migrate to tissues from the blood of pSS patients, resulting in a reduction of CD4+ T cells in the blood.48,49 CD4+ T cells release a variety of cytokines and contribute to autoantibody production, lymphocyte infiltration, and even the development of lymphomas in pSS.49–51 Type I IFN plays a critical role in stimulating immune activation, thereby influencing the production and control of pro-inflammatory cytokines and other mediators.52 Monocytes, when stimulated by type I IFNs, differentiate into dendritic cells. These dendritic cells then induce the expression of chemokines and co-stimulatory molecules in immature dendritic cells, facilitating their migration to secondary lymphoid organs, which ultimately activates adaptive immunity.53 Besides, IFN stimulates macrophages to enhance phagocytosis. Monocytes upregulate BAFF expression following stimulation by type I and type II IFNs, which promote B-cell activation and participate in the pSS pathogenesis.54 Apart from monocytes, dendritic cells, macrophages, and salivary gland epithelial cells also upregulate BAFF expression upon stimulation by IFNs.55,56 This implies that IFNs (especially type I IFN) contribute to the progression of pSS through induction of inherent immunity, activation of acquired immunity, and modulation of inflammatory cytokine and levels of antibody, corroborating the reliability of the type I IFN-inducible gene, IFI44, as a biomarker for pSS.
In recent years, studies have focused on the regulatory role of miRNAs in disease development, especially in the physiopathological processes of inflammatory responses. miRNA molecules are non-coding RNAs, which function in cells mainly by inhibiting the translation or promoting the degradation of specific target mRNAs, thereby regulating gene expression.57 miRNAs have crucial roles in numerous biological processes covering cell proliferation, differentiation, and apoptosis, as well as being closely linked to various disease processes including cancer and inflammatory responses.58–61 The predictions of this study showed that IFI44 was closely associated with hsa-miR-944, hsa-miR-9-5p, hsa-miR-126-5p, and hsa-miR-335-3p. Hsa-miR-944 is located in the tumor protein p63 (TP63) ‘s fourth intron in chromosome 3q28 region.62 It is aberrantly giving expression to cancers of multiple systems, including endocrine, neurological, reproductive, respiratory, and digestive systems, and participates in the cancer cell behaviors regulation such as growth, cycle, proliferation, cancer cell invasion, epithelial-mesenchymal transition (EMT) and metastasis, and is associated with the Jak-STAT3 pathway, the Wnt/β-catenin pathway and the PI3K-Akt pathway.63 Previous research has also shown the involvement of hsa-miR-9 in ischemic stroke. The expression of Hsa-miR-9 is up-regulated in serum exosomes of patients with acute ischemic stroke, which predicts an adverse outcome for the patients, and is closely associated with IL-6 production,64,65 which has been discovered to be a putative biomarker of diabetes mellitus exacerbated by stroke.66 Hsa- miR-126 participates in immune cell development and function, and hsa-miR-126 deficiency significantly enhances CD4 T cell activation and proliferation as well as IFN-γ secretion in vitro and in vivo.67 Studies have shown that miR-126a-5p stimulates the differentiation of naïve CD4 T cells in mice through the DLK1-mediated Notch1 signaling pathway.68 Hsa-miR-335-3p promotes cardiac mesodermal and stem cell differentiation, and is highly expressed in the mature heart.69,70 The involvement of these miRNAs in the progression of pSS needs further in-depth study.
However, our study has some limitations. The reliability of gene expression was verified by bioinformatics analysis of early research, which laid a theoretical basis for quick detection of IFI44 expression in peripheral blood and diagnosis of pSS. Meanwhile, the diagnostic efficacy, drug-targeting outcomes, and regulatory network of IFI44 are only initial findings from bioinformatics studies and predictions at this point. It is essential to proceed with larger-scale research on a wider range of patient groups and subsequent animal experiments to verify its safety, effectiveness, and stability. In addition, the number of clinically validated patients is small, and there is a need for real-world data from more clinical samples to validate the mechanisms of interaction between immune cells and crucial genes. Despite the difficulties, progress in genomics provides a rare opportunity to better understand the pathological mechanisms of pSS and formulate new therapeutic strategies, and further research on pSS may lead to innovative treatments.
Conclusion
In summary, this study screened specific DEGs (IFI44, XAF1, GBP1, EIF2AK2, IFI27, and IFI6) in the training dataset through three machine learning models and evaluated their expression levels and accuracy in diagnosing pSS. Their role in distinguishing pSS samples from control samples can be demonstrated by ROC curves. In addition, the high accuracy (AUC = 0.859) and significance (R ≥ 0.8) of IFI44 were validated in both blood samples and parotid gland samples. Subsequently, we investigated the correlation between IFI44 and immune infiltrating cells as well as clinical traits of pSS, argued for the importance of IFI44 in pSS, and applied ELISA to detect the protein expression level of IFI44 in the serum of pSS patients. Finally, an IFI44-regulated ceRNA regulation network was created to investigate the molecular mechanism of these genes in a preliminary manner, which suggests that IFI44 could serve as a dependable biomarker for pSS.
Data Sharing Statement
The datasets generated and/or analyzed in the study can be found in the Gene Expression Omnibus datasets (GEO, https://www.ncbi.nlm.nih.gov/geo/, GSE51092, GSE66795, GSE40611, and GSE84844).
Ethics Approval and Informed Consent
The study was conducted following the Declaration of Helsinki and approved by the Ethics Committee of the First Teaching Hospital of Tianjin University (TYLL2018[K]026). The participants consented in writing to take part in this research.
Consent for Publication
This article was published with the written consent of the patient.
Author Contributions
All authors participated in the drafting, revising, or critical review of the article; they gave final approval of the version to be published; they reached an agreement on the journal to which the article has been submitted; and they agreed to be responsible for all aspects of the work. Collectively, the authors made a significant contribution to the work reported, whether it be in the study design, conception, acquisition of data, execution, analysis, and interpretation, or in all these areas.
Funding
This research was supported by the Traditional Chinese Medicine Inheritance and Innovation “Hundred Million” Talent Project (Qihuang Project) (Chinese Medicine People’s Education Letter [2018] No. 12)-Liu Wei Qihuang Scholar Studio Construction Project and Tianjin Key Specialty Program (20210602-1), and the Famous Old Chinese Medicine Inheritance Studio of the State Administration of Traditional Chinese Medicine (975022), the Research on the investigation and clinical efficacy evaluation of TCM and ethnomedical syndrome elements (2020MZ319-350601).
Disclosure
The authors report no conflicts of interest in this work.
References
1. Mariette X, Criswell LA. Primary sjögren’s syndrome. New Engl J Med. 2018;378(10):931–939. doi:10.1056/NEJMcp1702514
2. Negrini S, Emmi G, Greco M, et al. Sjögren’s syndrome: a systemic autoimmune disease. Clin Exp Med. 2022;22(1):9–25. doi:10.1007/s10238-021-00728-6
3. Seror R, Ravaud P, Bowman SJ, et al. Eular sjogren’s syndrome disease activity index: development of a consensus systemic disease activity index for primary sjogren’s syndrome. Ann Rheum Dis. 2010:1103–1109. doi:10.1136/ard.2009.110619.
4. Zhao Y, Li Y, Wang L, et al. Primary sjögren syndrome in han Chinese: clinical and immunological characteristics of 483 patients. Medicine. 2015;94(16):e667. doi:10.1097/MD.0000000000000667
5. Xu D, Zhao S, Li Q, et al. Characteristics of Chinese patients with primary sjögren’s syndrome: preliminary report of a multi-centre registration study. Lupus. 2020;29(1):45–51. doi:10.1177/0961203319889666
6. Qian J, He C, Li Y, et al. Ten-year survival analysis of patients with primary sjögren’s syndrome in China: a national prospective cohort study. Ther Adv Musculoskelet Dis. 2021;13:1759720X211020179. doi:10.1177/1759720X211020179
7. Shiboski CH, Shiboski SC, Seror R, et al. 2016 American college of rheumatology/European league against rheumatism classification criteria for primary sjögren’s syndrome: a consensus and data-driven methodology involving three international patient cohorts. Ann Rheum Dis. 2017;76(1):9–16. doi:10.1136/annrheumdis-2016-210571
8. Shiboski SC, Shiboski CH, Criswell LA, et al. American college of rheumatology classification criteria for sjögren’s syndrome: a data-driven, expert consensus approach in the sjögren’s international collaborative clinical alliance cohort. Arthritis Care & Research. 2012;64(4):475–487. doi:10.1002/acr.21591
9. Thorne I, Sutcliffe N. Sjögren’s syndrome. Br J Hosp Med. 2017;78(8):438–442. doi:10.12968/hmed.2017.78.8.438
10. Fisher BA, Jonsson R, Daniels T, et al. Standardisation of labial salivary gland histopathology in clinical trials in primary sjögren’s syndrome. Annals of the Rheumatic Diseases. 2017;76(7):1161–1168. doi:10.1136/annrheumdis-2016-210448
11. Chen W, Cao H, Lin J, Olsen N, Zheng SG. Biomarkers for primary sjögren’s syndrome. Genomics Proteomics Bioinf. 2015;13(4):219–223. doi:10.1016/j.gpb.2015.06.002
12. Baldini C, Ferro F, Elefante E, Bombardieri S. Biomarkers for sjögren’s syndrome. Biomarker Med. 2018;12(3):275–286. doi:10.2217/bmm-2017-0297
13. Pijpe J, Kalk WWI, van der Wal JE, et al. Parotid gland biopsy compared with labial biopsy in the diagnosis of patients with primary sjogren’s syndrome. Rheumatology (Oxford, England). 2007;46(2):335–341. doi:10.1093/rheumatology/kel266
14. Costa S, Quintin-Roué I, Lesourd A, et al. Reliability of histopathological salivary gland biopsy assessment in sjögren’s syndrome: a multicentre cohort study. Rheumatology. 2015;54(6):1056–1064. doi:10.1093/rheumatology/keu453
15. Jin Y, Li J, Chen J, et al. Tissue-specific autoantibodies improve diagnosis of primary sjögren’s syndrome in the early stage and indicate localized salivary injury. J Immunol Res. 2019;2019:3642937. doi:10.1155/2019/3642937
16. Granito A, Muratori P, Muratori L, et al. Antibodies to ss-A/ro-52kd and centromere in autoimmune liver disease: a clue to diagnosis and prognosis of primary biliary cirrhosis. Aliment Pharmacol Ther. 2007;26(6):831–838. doi:10.1111/j.1365-2036.2007.03433.x
17. Ferri S, Muratori L, Lenzi M, Granito A, Bianchi FB, Vergani D. Hcv and autoimmunity. Curr Pharm Des. 2008;14(17):1678–1685. doi:10.2174/138161208784746824
18. Hsieh S, Yu H, Lin W, et al. Anti-ssb/la is one of the antineutrophil autoantibodies responsible for neutropenia and functional impairment of polymorphonuclear neutrophils in patients with systemic lupus erythematosus. Clinical and Experimental Immunology. 2003;131(3):506–516. doi:10.1046/j.1365-2249.2003.02084.x
19. He J, Ding Y, Feng M, et al. Characteristics of sjögren’s syndrome in rheumatoid arthritis. Rheumatology. 2013;52(6):1084–1089. doi:10.1093/rheumatology/kes374
20. Gilboe IM, Kvien TK, Uhlig T, Husby G. Sicca symptoms and secondary sjögren’s syndrome in systemic lupus erythematosus: comparison with rheumatoid arthritis and correlation with disease variables. Annals of the Rheumatic Diseases. 2001;60(12):1103–1109. doi:10.1136/ard.60.12.1103
21. Seror R, Nocturne G, Mariette X. Current and future therapies for primary sjögren syndrome. Nat Rev Rheumatol. 2021;17(8):475–486. doi:10.1038/s41584-021-00634-x
22. Baselli GA, Dongiovanni P, Rametta R, et al. Liver transcriptomics highlights interleukin-32 as novel nafld-related cytokine and candidate biomarker. Gut. 2020;69(10):1855–1866. doi:10.1136/gutjnl-2019-319226
23. Huang Y, Guo J, Chen W, et al. A scoping review of fair machine learning techniques when using real-world data. J Biomed Inform. 2024;151:104622. doi:10.1016/j.jbi.2024.104622
24. Wei B, Wang A, Liu W, et al. Identification of immunological characteristics and cuproptosis-related molecular clusters in primary sjögren’s syndrome. Int Immunopharmacol. 2024;126:111251. doi:10.1016/j.intimp.2023.111251
25. Engebretsen S, Bohlin J. Statistical predictions with glmnet. Clin Clin Epigenet. 2019;11(1):123. doi:10.1186/s13148-019-0730-1
26. Garge NR, Bobashev G, Eggleston B. Random forest methodology for model-based recursive partitioning: the mobforest package for r. BMC Bioinf. 2013;14:125. doi:10.1186/1471-2105-14-125
27. Zhao E, Xie H, Zhang Y. Predicting diagnostic gene biomarkers associated with immune infiltration in patients with acute myocardial infarction. Front Cardiovasc Med. 2020;7:586871. doi:10.3389/fcvm.2020.586871
28. Sundermann B, Bode J, Lueken U, et al. Support vector machine analysis of functional magnetic resonance imaging of interoception does not reliably predict individual outcomes of cognitive behavioral therapy in panic disorder with agoraphobia. Front Psychiatry. 2017;8:99. doi:10.3389/fpsyt.2017.00099
29. Robin X, Turck N, Hainard A, et al. Proc: an open-source package for r and s+ to analyze and compare roc curves. BMC Bioinf. 2011;12(1):77. doi:10.1186/1471-2105-12-77
30. Vitali C, Bombardieri S, Jonsson R, et al. Classification criteria for sjögren’s syndrome: a revised version of the European criteria proposed by the American-European consensus group. Annals of the Rheumatic Diseases. 2002;61(6):554–558. doi:10.1136/ard.61.6.554
31. Voulgarelis M, Ziakas PD, Papageorgiou A, Baimpa E, Tzioufas AG, Moutsopoulos HM. Prognosis and outcome of non-hodgkin lymphoma in primary sjögren syndrome. Medicine. 2012;91(1):1–9. doi:10.1097/MD.0b013e31824125e4
32. Li N, Li L, Wu M, et al. Integrated bioinformatics and validation reveal potential biomarkers associated with progression of primary sjögren’s syndrome. Front Immunol. 2021;12:697157. doi:10.3389/fimmu.2021.697157
33. Zhong Y, Zhang W, Liu D, et al. Screening biomarkers for sjogren’s syndrome by computer analysis and evaluating the expression correlations with the levels of immune cells. Front Immunol. 2023;14:1023248. doi:10.3389/fimmu.2023.1023248
34. Xu H, Chen J, Wang Y, Wu Y, Liang Y. Sell and ifi44 as potential biomarkers of sjögren’s syndrome and their correlation with immune cell infiltration. Genes Genet Syst. 2021;96(2):71–80. doi:10.1266/ggs.20-00053
35. Maria NI, Brkic Z, Waris M, et al. Mxa as a clinically applicable biomarker for identifying systemic interferon type i in primary sjogren’s syndrome. Ann Rheum Dis. 2014;73(6):1052–1059. doi:10.1136/annrheumdis-2012-202552
36. Brkic Z, Maria NI, van Helden-Meeuwsen CG, et al. Prevalence of interferon type i signature in cd14 monocytes of patients with sjogren’s syndrome and association with disease activity and baff gene expression. Ann Rheum Dis. 2013;72(5):728–735. doi:10.1136/annrheumdis-2012-201381
37. Yao Q, Song Z, Wang B, Qin Q, Zhang J. Identifying key genes and functionally enriched pathways in sjögren’s syndrome by weighted gene co-expression network analysis. Front Genet. 2019;10:1142. doi:10.3389/fgene.2019.01142
38. Kimoto O, Sawada J, Shimoyama K, et al. Activation of the interferon pathway in peripheral blood of patients with sjogren’s syndrome. J Rheumatol. 2011;38(2):310–316. doi:10.3899/jrheum.100486
39. Wildenberg ME, van Helden-Meeuwsen CG, van de Merwe JP, Drexhage HA, Versnel MA. Systemic increase in type i interferon activity in sjögren’s syndrome: a putative role for plasmacytoid dendritic cells. Eur J Immunol. 2008;38(7):2024–2033. doi:10.1002/eji.200738008
40. Del PN, Minniti A, Lorini M, et al. The role of interferons in the pathogenesis of sjögren’s syndrome and future therapeutic perspectives. Biomolecules. 2021;11(2):251. doi:10.3390/biom11020251
41. Lee AJ, Ashkar AA. The dual nature of type i and type ii interferons. Front Immunol. 2018;9:2061. doi:10.3389/fimmu.2018.02061
42. Zhang K, Luo Z, Zhu X, et al. Identification of key genes for pyroptosis-induced salivary gland inflammation in sjogren’s syndrome based on microarray data and immunohistochemistry analysis. J Inflamm Res. 2023;16:5865–5879. doi:10.2147/JIR.S435008
43. Villarroya-Beltri C, Guerra S, Sánchez-Madrid F. Isgylation - A key to lock the cell gates for preventing the spread of threats. J Cell Sci. 2017;130(18):2961–2969. doi:10.1242/jcs.205468
44. Katsifis GE, Rekka S, Moutsopoulos NM, Pillemer S, Wahl SM. Systemic and local interleukin-17 and linked cytokines associated with sjögren’s syndrome immunopathogenesis. Am J Pathol. 2009;175(3):1167–1177. doi:10.2353/ajpath.2009.090319
45. Ittah M, Miceli-Richard C, Eric Gottenberg J, et al. B cell-activating factor of the tumor necrosis factor family (baff) is expressed under stimulation by interferon in salivary gland epithelial cells in primary sjögren’s syndrome. Arthritis Res Ther. 2006;8(2):R51. doi:10.1186/ar1912
46. Liu X, Wang H, Wang X, et al. Identification and verification of inflammatory biomarkers for primary sjögren’s syndrome. Clin Rheumatol. 2024;43(4):1335–1352. doi:10.1007/s10067-024-06901-y
47. Nocturne G, Mariette X. Advances in understanding the pathogenesis of primary sjogren’s syndrome. Nat Rev Rheumatol. 2013;9(9):544–556. doi:10.1038/nrrheum.2013.110
48. Mandl T, Bredberg A, Jacobsson LTH, Manthorpe R, Henriksson G. Cd4+ t-lymphocytopenia--A frequent finding in anti-ssa antibody seropositive patients with primary sjögren’s syndrome. J Rheumatol. 2004;31(4):726–728.
49. Mingueneau M, Boudaoud S, Haskett S, et al. Cytometry by time-of-flight immunophenotyping identifies a blood sjögren’s signature correlating with disease activity and glandular inflammation. J Allergy Clin Immunol. 2016;137(6):1809–1821. doi:10.1016/j.jaci.2016.01.024
50. Maehara T, Moriyama M, Hayashida J, et al. Selective localization of t helper subsets in labial salivary glands from primary sjögren’s syndrome patients. Clin Exp Immunol. 2012;169(2):89–99. doi:10.1111/j.1365-2249.2012.04606.x
51. Nocturne G, Mariette X. Sjögren syndrome-associated lymphomas: an update on pathogenesis and management. Br J Haematol. 2015;168(3):317–327. doi:10.1111/bjh.13192
52. Bodewes I, Versnel MA. Interferon activation in primary sjögren’s syndrome: recent insights and future perspective as novel treatment target. Expert Rev Clin Immunol. 2018;14(10):817–829. doi:10.1080/1744666X.2018.1519396
53. Luo S, Wu R, Li Q, Zhang G, Cui D. Epigenetic regulation of ifi44l expression in monocytes affects the functions of monocyte-derived dendritic cells in systemic lupus erythematosus. J Immunol Res. 2022;2022:4053038. doi:10.1155/2022/4053038
54. Nocturne G, Mariette X. B cells in the pathogenesis of primary sjögren syndrome. Nat Rev Rheumatol. 2018;14(3):133–145. doi:10.1038/nrrheum.2018.1
55. Kiefer K, Oropallo MA, Cancro MP, Marshak-Rothstein A. Role of type i interferons in the activation of autoreactive b cells. Immunol Cell Biol. 2012;90(5):498–504. doi:10.1038/icb.2012.10
56. Bron AJ, de Paiva CS, Chauhan SK, et al. Tfos dews ii pathophysiology report. Ocular Surf. 2017;15(3):438–510. doi:10.1016/j.jtos.2017.05.011
57. Fabian MR, Sonenberg N. The mechanics of mirna-mediated gene silencing: a look under the hood of mirisc. Nat Struct Mol Biol. 2012;19(6):586–593. doi:10.1038/nsmb.2296
58. Chen S, Zhang Y, Ding X, Li W. Identification of lncrna/circrna-mirna-mrna cerna network as biomarkers for hepatocellular carcinoma. Front Genet. 2022;13:838869. doi:10.3389/fgene.2022.838869
59. Yuan L, Chen W, Xiang J, Deng Q, Hu Y, Li J. Advances of circrna-mirna-mrna regulatory network in cerebral ischemia/reperfusion injury. Exp Cell Res. 2022;419(2):113302. doi:10.1016/j.yexcr.2022.113302
60. Nishita-Hiresha V, Varsha R, Jayasuriya R, Ramkumar KM. The role of circrna-mirna-mrna interaction network in endothelial dysfunction. Gene. 2023;851:146950. doi:10.1016/j.gene.2022.146950
61. Zheng F, Tan L, Zhang F, et al. The circrna-mirna-mrna regulatory network in plasma and peripheral blood mononuclear cells and the potential associations with the pathogenesis of systemic lupus erythematosus. Clin Rheumatol. 2023;42(7):1885–1896. doi:10.1007/s10067-023-06560-5
62. Park S, Kim J, Eom K, et al. Microrna-944 overexpression is a biomarker for poor prognosis of advanced cervical cancer. Bmc Cancer. 2019;19(1):419. doi:10.1186/s12885-019-5620-6
63. Shen J, Wang Q, Liang C, et al. Novel insights into mir-944 in cancer. Cancers. 2022;14(17):4232. doi:10.3390/cancers14174232
64. Ji Q, Ji Y, Peng J, et al. Increased brain-specific mir-9 and mir-124 in the serum exosomes of acute ischemic stroke patients. PLoS One. 2016;11(9):e0163645. doi:10.1371/journal.pone.0163645
65. Bache S, Rasmussen R, Wolcott Z, et al. Elevated mir-9 in cerebrospinal fluid is associated with poor functional outcome after subarachnoid hemorrhage. Transl Stroke Res. 2020;11(6):1243–1252. doi:10.1007/s12975-020-00793-1
66. Abdelaleem OO, Shaker OG, Mohamed MM, et al. Differential expression of serum tug1, linc00657, mir-9, and mir-106a in diabetic patients with and without ischemic stroke. Front Mol Biosci. 2021;8:758742. doi:10.3389/fmolb.2021.758742
67. Chu F, Hu Y, Zhou Y, et al. Microrna-126 deficiency enhanced the activation and function of cd4(+) t cells by elevating irs-1 pathway. Clin Exp Immunol. 2018;191(2):166–179. doi:10.1111/cei.13067
68. Du X, Zhu M, Zhang T, et al. The recombinant eg.p29-mediated mir-126a-5p promotes the differentiation of mouse naive cd4(+) t cells via dlk1-mediated notch1 signal pathway. Front Immunol. 2022;13:773276. doi:10.3389/fimmu.2022.773276
69. Yang D, Lutter D, Burtscher I, Uetzmann L, Theis FJ, Lickert H. Mir-335 promotes mesendodermal lineage segregation and shapes a transcription factor gradient in the endoderm. Development. 2014;141(3):514–525. doi:10.1242/dev.104232
70. Kay M, Soltani BM, Aghdaei FH, Ansari H, Baharvand H. Hsa-mir-335 regulates cardiac mesoderm and progenitor cell differentiation. Stem Cell Res Ther. 2019;10(1):191. doi:10.1186/s13287-019-1249-2
 © 2024 The Author(s). This work is published and licensed by Dove Medical Press Limited. The
full terms of this license are available at https://www.dovepress.com/terms.php
and incorporate the Creative Commons Attribution
- Non Commercial (unported, 3.0) License.
By accessing the work you hereby accept the Terms. Non-commercial uses of the work are permitted
without any further permission from Dove Medical Press Limited, provided the work is properly
attributed. For permission for commercial use of this work, please see paragraphs 4.2 and 5 of our Terms.
© 2024 The Author(s). This work is published and licensed by Dove Medical Press Limited. The
full terms of this license are available at https://www.dovepress.com/terms.php
and incorporate the Creative Commons Attribution
- Non Commercial (unported, 3.0) License.
By accessing the work you hereby accept the Terms. Non-commercial uses of the work are permitted
without any further permission from Dove Medical Press Limited, provided the work is properly
attributed. For permission for commercial use of this work, please see paragraphs 4.2 and 5 of our Terms.