")
Back to Journals » Journal of Inflammation Research » Volume 18
Identification and Validation of Oxidative Stress-Related Diagnostic Marker Genes and Immune Landscape in Ulcerative Interstitial Cystitis by Integrating Bioinformatics and Machine Learning
Authors Fu C, Zhang Y, Zhao Y, Wang S, Zhou Y, Lv J, Jin S, Liu F, Feng N
Received 5 March 2025
Accepted for publication 28 May 2025
Published 6 June 2025 Volume 2025:18 Pages 7263—7286
DOI https://doi.org/10.2147/JIR.S524653
Checked for plagiarism Yes
Review by Single anonymous peer review
Peer reviewer comments 2
Editor who approved publication: Professor Ning Quan
Chaowei Fu,1,* Yuwei Zhang,2,* Yu Zhao,1,* Shiyu Wang,1,* Yuhua Zhou,1 Jing Lv,1 Shengkai Jin,1 Fengping Liu,1 Ninghan Feng1– 3
1Wuxi School of Medicine, Jiangnan University, Wuxi, Jiangsu, People’s Republic of China; 2Nantong University Medical School, Nantong University, Nantong, Jiangsu, People’s Republic of China; 3Department of Urology, Jiangnan University Medical Center, Wuxi, Jiangsu, People’s Republic of China
*These authors contributed equally to this work
Correspondence: Ninghan Feng, Jiangnan University Medical Center, 68 Zhongshan Road, Wuxi, 214002, People’s Republic of China, Tel +8613861892528, Email [email protected]
Purpose: Interstitial cystitis (IC) is a chronic inflammatory disease with autoimmune associations, particularly in ulcerative IC, a severe and refractory subtype. Oxidative stress plays a crucial role in IC pathogenesis, interacting with inflammation and immune cell infiltration. This study aimed to identify oxidative stress-linked biomarkers and explore their relationship with immune cell infiltration to enhance diagnosis and treatment strategies.
Patients and Methods: The GSE711783 dataset from GEO was analyzed to identify differentially expressed genes in ulcerative IC. Oxidative stress-related genes were sourced from GeneCards, with hub genes identified via WGCNA and protein-protein interaction networks. Diagnostic markers were refined using machine learning, and a nomogram prediction model was developed. Diagnostic biomarkers were validated in vitro and in vivo, immune infiltration was assessed with CIBERSORT, and potential therapeutic drugs were identified through DSigDB.
Results: Four diagnostic biomarkers—BMP2, MMP9, CCK, and NOS3—were identified and found to be associated with immune cells, including CD4+ T cells and eosinophils. Decitabine was identified as a potential therapeutic candidate. Experimental validation confirmed the expression of these biomarkers.
Conclusion: This study identifies BMP2, MMP9, CCK, and NOS3 as key biomarkers, offering valuable insights into the diagnosis and treatment of IC.
Keywords: interstitial cystitis, oxidative stress, diagnostic marker, bioinformatics, machine learning, immune landscape
Introduction
Interstitial cystitis (IC) is a chronic, inflammation-associated condition characterized by bladder pain, urinary frequency, urgency, and difficulty urinating, which significantly diminish patients’ quality of life.1 Research indicates that IC patients face a notably higher risk of suicide, underscoring its profound impact on both physical and mental health.2 Despite extensive studies, the exact pathogenesis of IC remains unclear, posing challenges to the development of effective treatments. Current evidence suggests that urothelial dysfunction, neurogenic inflammation, mast cell activation, and immune dysregulation are key contributors to its pathophysiology.3–5 Among these, inflammation and immune dysregulation play central roles in disease progression. Infiltration of lymphocytes, macrophages, and mast cells is frequently observed in the bladder tissues of IC patients,6 along with elevated levels of inflammatory mediators such as IL-6 and TNF-α in urine.7,8 This immune cell activation and the accompanying inflammatory response exacerbate urothelial damage, perpetuating a vicious cycle of inflammation and tissue injury.9 Furthermore, IC can be divided into ulcerative IC (also known as Hunner-type IC) and non-ulcerative IC (also known as bladder pain syndrome, BPS) based on the presence of Hunner lesions, with a broad consensus that these two forms should be regarded as distinct diseases.10,11 For example, in Japan, IC and BPS are differentiated based on the existence of Hunner lesions.12 Ulcerative IC is a rare and difficult-to-treat chronic inflammatory disease of the bladder with an unclear etiology. Its main characteristics include persistent bladder pain and lower urinary tract symptoms such as frequency and urgency, with visible redness of the bladder mucosa during cystoscopy, known as Hunner lesions.13 Notably, ulcerative IC significantly differs from non-ulcerative IC in terms of demographics, cystoscopic findings, histopathology, treatment responses, and complications.14 The estimated overall prevalence of IC worldwide is approximately 10.6 cases per 100,000 people,15 with a notably higher incidence in females. Ulcerative IC accounts for 3.5% to 50% of all cases10 and is considered one of the most difficult and devastating bladder diseases. Therefore, exploring the mechanisms of inflammation and immune dysregulation in IC patients, especially those with ulcerative IC, holds significant clinical intervention and treatment implications.
Oxidative stress (OS) is a phenomenon characterized by the disruption of the intracellular redox balance, leading to the overproduction of free radicals and oxidized substances that surpass the scavenging capacity of the intracellular antioxidant system, this imbalance triggers cellular damage and abnormal function.16 Recent research suggests that all currently recognized pathogeneses of IC are influenced by OS. This process may further exacerbate bladder inflammation and compromise urethral epithelial integrity, contributing to the development of IC.17 Additionally, it has been reported that elevated levels of ROS markers (such as oxidized guanine,18 8-isoprostane,18 8-hydroxy-2’-deoxyguanosine (8-OHdG),19 and ischemia-modified albumin (IMA)20) have been found in the urine and serum samples of IC/BPS patients, indicating that OS may play an important role in the pathogenesis of the disease. OS impairs bladder contraction by affecting output pathways and interfering with cholinergic receptor signaling systems. Additionally, reactive oxygen species (ROS) produced by OS lead to an increase in peroxynitrite concentration in the uroepithelium and bladder smooth muscle. This elevation may trigger various pathological processes, including lipid peroxidation, protein oxidation, DNA damage, reduced glutathione depletion, oxidative damage, apoptosis, and cell necrosis. Previous animal studies have found that timely intervention with antioxidants can inhibit OS in IC rats and alleviate their pain and inflammatory responses, demonstrating a therapeutic effect.21,22 Earlier research has shown that OS stimulates the production of inflammatory factors in mast cells through an APE/Ref-1-dependent pathway.23 Furthermore, ROS play a role in FcεRI-dependent mast cell activation and degranulation. The use of peroxidase-containing substances can inhibit ROS accumulation and consequently suppress FcεRI-dependent mast cell activation.24,25 Therefore, antioxidant measures are an important direction for the prevention and treatment of IC.
Furthermore, studies have identified genes associated with OS such as BMP2 (bone morphogenetic protein 2), which is part of the transforming growth factor-beta (TGF-β) superfamily and plays a critical role in bone and cartilage development and repair while reducing the production of ROS.26 MMP9 (matrix metalloproteinase-9) is a zinc-dependent enzyme involved in various physiological processes, including embryonic development, tissue remodeling, and wound healing.27 The role of CCK (cholecystokinin), an intestinal hormone, remains unclear in the context of bladder function. NOS3 (nitric oxide synthase 3), also known as endothelial nitric oxide synthase (eNOS), is essential for the production of nitric oxide (NO), a signaling molecule with diverse physiological functions and significant pathophysiological activities.28 Through our bioinformatics analysis, we found that these genes are closely associated with IC. Therefore, investigating these OS-related genes may elucidate the mechanisms underlying ulcerative IC and identify potential therapeutic targets.
In summary, OS plays a crucial role in the pathogenesis of IC and may contribute to the occurrence and progression of the disease through multiple pathways. Therefore, therapeutic strategies targeting OS could become a significant direction for IC treatment. In this study, we conducted a systematic bioinformatics analysis of OS-related genes to identify diagnostic maker genes involved in the occurrence of IC and to analyze their relationship with immune infiltration. The validation of these characterized genes was performed through cell and animal experiments, enhancing the credibility of our findings.
Materials and Methods
Acquisition of Dataset
We obtained RNA sequencing datasets related to IC from the Gene Expression Omnibus (GEO) database (https://www.ncbi.nlm.nih.gov/geo/). Specifically, we utilized the GSE11783 dataset, comprising transcriptomic data from 11 human samples, including 5 IC cases (All of them were patients with ulcerative IC, including 5 ulcerative areas and 5 non-ulcerative areas) and 6 control samples. During data preprocessing, we initially converted probe IDs to specific gene symbols using the platform annotation file, facilitating the mapping of raw data to the gene level. In this process, when multiple probes were associated with the same gene symbol, we opted to use the average value as the representative gene expression value to mitigate the impact of multiple probe mappings on the results. Furthermore, we identified 926 genes associated with OS from the GeneCards database (https://www.genecards.org/) for subsequent analysis. In selecting these genes, we employed a correlation score greater than 7 as the screening criterion (see Additional file 1: Table S1 for details). Detailed information regarding the data is provided in Table 1.
 |
Table 1 Summary of the Data Sets Utilized in This Research and Their Features |
Identification of DEGs
To identify the differentially expressed genes (DEGs) in the GSE11783 dataset, we first normalized the raw expression matrix using R software (version 4.3.3). Subsequently, we employed the “limma (version 3.56.2)” package to conduct a comprehensive analysis of gene expression between IC and controls. In this process, we utilized the Benjamini-Hochberg False Discovery Rate (FDR) method to address the issue of multiple testing while maintaining statistical significance. We established two primary screening criteria: adj.P < 0.05 and |logFoldChange (FC)| > 1. Here, a logFC > 1 denoted up-regulated genes, while a logFC < −1 indicated down-regulated genes. We utilized the “ggplot2 (version 3.5.0)” and “pheatmap (version 1.0.12)” packages to visually represent the expression patterns of DEGs through volcano plots and heatmaps, respectively.
Construction of the Co-Expression Network and Identifies Key Gene Modules by WGCNA
Weighted gene co-expression network analysis (WGCNA) is a method commonly used to identify co-expressed gene modules and to explore the association relationship between gene networks and specific phenotypes. In our study, we constructed such a network using the “WGCNA (version 1.0.12)” package. First, we used hierarchical clustering with the “hclust” function to detect significant outliers. We used “pickSoftThreshold” to select the soft threshold power β, then converted the gene expression similarity matrix to a neighbor-joining matrix with “adjacency” and subsequently to a topological overlap matrix (TOM). Modules were detected using dynamic tree cutting approach. Pearson correlation analysis identified the modules most correlated with our phenotypes, designating them as key gene modules.
Acquisition of Intersecting Genes
Intersections between gene sets are obtained using the R package “ggVennDiagram (version 1.5.2)”. Common intersections between DEGs and WGCNA modules are referred to as key DEGs, and intersections between key DEGs and OS-related genes are identified as OS-related differentially expressed genes (OSDEGs).
Functional Enrichment Analysis of Key DEGs
To gain insight into the pathogenesis of IC and the biological pathways that may be involved, we performed Kyoto Encyclopedia of Genes and Genomes (KEGG)29 and Gene Ontology (GO)30 analyses of key DEGs using the “clusterProfiler (version 4.8.3)” package in R. GO analyses included the study of biological processes (BP), cellular components (CC), and molecular functions (MF). In this step, we set adj.P < 0.05 as the threshold for significant differences.
Protein Interaction Network Analysis
To analyze protein interactions and their roles in biosignaling and metabolic responses, we generated a protein-protein interaction (PPI) network using OS-related differentially expressed genes (OSDEGs) in the STRING database31 (version 12.0, https://cn.string-db.org/) with a confidence threshold of 0.4. Genes without interactions were removed to enhance network reliability. Hub genes were identified using “CytoHubba32” (a Cytoscape plugin) with four methods: Maximal Clique Centrality (MCC), Degree, Maximum Neighborhood Component (MNC), and Closeness, each providing the top 20 genes. We visualized these hub genes in Cytoscape (version 3.10.1), with circle size and color indicating the interaction degree. Overlapping hub genes from all methods were used to construct co-expression networks in GeneMANIA33 (http://www.genemania.org/). The correlation matrix was visualized using the “corrplot” package (version 0.92) to understand gene interactions and regulation.
Construction of TF-Gene and miRNA-Gene Regulatory Networks
We conducted comprehensive analyses to uncover transcriptional regulatory networks and key transcription factors (TFs) controlling hub genes. Gene expression profiling was performed using NetworkAnalyst34 (https://www.networkanalyst.ca/), integrating TF-gene and miRNA-gene interaction data from the JASPAR35 and MiRTarBase databases,36 respectively. This provided insights into TF and miRNA interactions with hub genes. The results were visualized using Cytoscape (version 3.10.1) to clearly depict the regulatory network and key TFs and sorted by the degree of correlation, the top 10 with the closest interactions were selected. Additionally, GraphPad software (version 9.0.0) was used to compare TFs expression levels between the IC and control groups.
Gene-Disease Association Analysis
Utilize the NetworkAnalyst platform to access the DisGeNET database37 and establish relationships between genes and diseases. DisGeNET is a discovery platform containing one of the largest publicly available collections of genes and variants associated with human diseases. A comprehensive understanding of the molecular details of associated diseases can help identify comorbidities and advance our understanding of these diseases.
Screening of Candidate Diagnostic Markers by Machine Learning
We employed the Least Absolute Shrinkage and Selection Operator (LASSO), Support Vector Machine Recursive Feature Elimination (SVM-RFE), and Random Forest (RF) algorithms to identify key genes. Using ten-fold cross-validation, we determined the optimal value of the parameter λ in LASSO by selecting the minimum standard value. For Random Forest, we evaluated error rates for tree numbers ranging from 1 to 500, selecting the tree number that yielded the lowest error rate while considering genes with importance values greater than 0. We conducted LASSO regression, RF analysis, and SVM-RFE using the R packages “glmnet (version 4.1.8)”, “randomForest (version 4.7.1.1)”, “e1071 (version 1.7.14)”, and “caret (version 6.0.94)”. Finally, we identified the intersection of genes from the three algorithms as key hub genes. Subsequently, we constructed an Artificial Neural Network (ANN) model using the “neuralnet (version 1.44.2)” and “NeuralNetTools (version 1.5.3)” packages to achieve a high-accuracy diagnosis.38
Nomogram Construction and Evaluation Using ROC Curve
We assessed the predictive performance of individual genes using a receiver operating characteristic (ROC) curve analysis to calculate the area under the curves (AUC) with the “pROC (version 1.18.5)” package. Genes were categorized based on AUC values: average diagnostic predictive value for AUC > 0.5, high for AUC > 0.7, and excellent for AUC > 0.9. We then constructed a nomogram model based on these genes using the “rms (version 6.8.0)” package, vital for clinical diagnosis.39 Finally, we evaluated the nomogram’s predictive ability and clinical utility through calibration curve and decision curve analysis (DCA).40
Single-Gene Gene Set Enrichment Analysis
Single-Gene Set Enrichment Analysis (GSEA)41 is a bioinformatics approach that leverages expression profiling to investigate the functions and signaling pathways associated with diagnostic markers in specific biological processes and diseases. In our study, we initially categorized the samples in the dataset into high and low expression groups based on the median expression levels of individual genes. Subsequently, we utilized the “clusterProfiler” package to conduct GSEA, aiming to elucidate the pathways implicated by the diagnostic marker genes. The gene set employed for this analysis was the KEGG (“c2.cp.kegg.v7.4.symbols.gmt”) gene set. We set the criteria for enrichment analysis as follows: P < 0.05, q < 0.25, and an absolute value of Normalized Enrichment Score (NES) > 1. Based on the enrichment score ranking, we visually represented the top 5 pathways for visualization purposes.
Immune Landscape and Correlation Analysis with Genes
CIBERSORT (Cell-type Identification By Estimating Relative Subsets Of RNA Transcripts) is an advanced bioinformatics tool that employs machine learning techniques to analyze gene expression data, inferring the relative abundance of various cell types in mixed samples. This algorithm leverages known cell-type-specific gene expression profiles to estimate the proportions of different cell types by minimizing discrepancies between the mixed sample and reference expression profiles.42 In our study, we first utilized the CIBERSORT algorithm to analyze the proportions of 22 immune cell subpopulations in both the control and IC groups. This analysis enabled us to understand the distribution and functional alterations of different immune cells in the pathological context of IC. Subsequently, Subsequently, we employed Spearman correlation coefficients to evaluate the relationships between the marker genes and immune cells, aiming to elucidate the potential roles of these marker genes in immune responses and provide valuable insights into the immune mechanisms underlying IC.
Evaluation of Applicant Drugs
Leveraging the Drug Signatures Database (DSigDB)43 to pinpoint small molecule compounds that target hub genes represents a promising avenue of research. DSigDB encompasses a vast collection of 22,527 genes, capturing the effects of diverse drugs on gene expression. Accessible through the Enrichr platform,44 DSigDB offers a convenient resource for identifying drug entities based on acquired diagnostic marker genes. Employing a systematic approach, we can uncover potential pharmacological molecules capable of modulating gene expression. This approach enables targeted therapeutic interventions, presenting novel opportunities for disease treatment.
Cell Culture and IC in vitro Model Construction
Two cell lines were used in this experiment. Human urothelial cells T24 (HTB-4, ATCC, Manassas, VA, USA) were cultured in McCoy’s 5A medium supplemented with 10% fetal bovine serum (FBS) and 1% penicillin/streptomycin. Prior to all experiments, cells grew to 80–90% confluence and washed three times with PBS. In all experiments, cells were cultured in 6-well plates at a density of 1×10^5 cells/well and incubated in standard medium 24 hours before processing. Human normal urothelial cells SV-HUC-1 (CRL-9520, ATCC, Manassas, VA, USA) were cultured in F12K medium supplemented with 10% fetal bovine serum (FBS) and 1% penicillin/streptomycin. Prior to all experiments, cells grew to 80–90% confluence and washed three times with PBS. In all experiments, cells were cultured in 6-well plates at a density of 2×10^5 cells/well and incubated in standard medium 24 hours before treatment. TNF-α is a pro-inflammatory cytokine that plays a crucial role in the pathogenesis of IC. TNF-α released by mast cells acts on the urinary tract epithelium, causing inflammation.45 Furthermore, TNF-α expression is significantly increased in the urine of patients with IC compared to healthy controls.7,8 A recent comprehensive study by Kuret et al employed transcriptome analysis to investigate the effects of TNF-α on urothelial cells. The study revealed a significant upregulation of inflammatory mediators, including IL1α, ILβ, and IL8, further confirming that TNF-α is a potent inducer of urothelial inflammation and plays a crucial role in the progression of IC.46 Therefore, in vitro models of bladder uroepithelial cells often use TNF-α to mimic the inflammatory and OS environment characteristic of IC. To mimic a classical inflammatory environment, cells were treated with 10 ng/mL TNF-α (Sigma-Aldrich, Arklow, Ireland) for 24 hours, according to previous studies.47–50
Experimental Animals and IC Animal Model Construction
For the animal experiments, 12 female Sprague-Dawley (SD) rats (8 weeks old, approximately 180 g) were used. The rats were randomly assigned to two groups: a normal group (n = 6) and a cyclophosphamide (CYP)-induced IC model group (n = 6). The IC rat model was induced by intraperitoneal injection of cyclophosphamide (Sigma-Aldrich, USA) at a dose of 75 mg/kg every three days for a total of three injections. This model, which closely mimics human ulcerative IC, exhibits symptoms such as frequent urination and bladder pain-like behavior, with histological signs including inflammatory cell infiltration, edema, and capillary congestion in the subepithelial bladder layer.51,52 One week after the third injection of CYP, all rats were euthanized (intraperitoneal injection pentobarbital sodium), and bladder tissues were collected for subsequent analyses. All animal experiments were conducted in accordance with the regulations of the Laboratory Animal Management and Animal Welfare Ethics Committee of Jiangnan University. Ethical approval was obtained from the Ethics Committee of Jiangnan University (Approval No. 20220930S0481025).
RNA Isolation and Reverse Transcription-Quantitative PCR (RT-qPCR)
Total RNA was extracted using the FastRure® Cell/Tissue Total RNA Isolation Kit (Vazyme, Nanjing, China) and reverse transcribed using the HiScript IV All-in-One Ultra RT SuperMix (Vazyme, Nanjing, China). RT-qPCR analysis was performed on the QuantStudio™ Design & Analysis SE Software using ChamQ Universal SYBR qPCR Master Mix (Vazyme, Nanjing, China) in three independent replicates. The relative expression of target genes was calculated using the 2^−ΔΔCt method, with GAPDH as the housekeeping gene. The sequences of the primers were as follows: CCK (human, forward, 5’-GTGCCTGTGCGTGCTGATG-3’ and reverse, 5’-GCCATCCGTTCTCTGCGATAC-3’), MMP9 (human, forward, 5’-GGCACCACCACCACAACATCACC-3’ and reverse, 5′-GGGCAAAGGCGTCGTCAATC-3’), BMP2 (human, forward, 5’-TCCCGACAGAACTCAGTGCTATC-3’ and reverse, 5’-ACCCACAACCCTCCACAACC-3’), NOS3 (human, forward, 5’-TCTCACCTTCTTCCTGGACATCAC-3’ and reverse, 5’-AACCACTTCCACTCCTCGTAGC-3’) and GAPDH (human, forward, 5’-GAAGGTGAAGGTCGGGAGTC-3’ and reverse, 5’-GAAGATGGTGATGGGGATTTC-3’), CCK (rat, forward, 5′-TGCCGCCTGCCCTCAAC-3’ and reverse, 5’-ACACGCCGCACTTCATATCTTC-3’), MMP9 (rat, forward, 5’-CAAACCCTGCGTATTTCCATTCATC-3’ and reverse, 5’- GATAACCATCCGAGCGACCTTTAG-3’), BMP2 (rat, forward, 5’-CTTGCCGCCGCCTCCAG-3’ and reverse, 5’-TGCCTTTCTTCACCTCCTCCTTC-3’), NOS3 (rat, forward, 5’-CTCACTTACTTCCTGGACATCACTTC-3’ and reverse, 5’-TGCTGTTCGCTGGACTCCTC-3’), GAPDH (rat, forward, 5’-GCAAATTCAACGGCACAG-3’ and reverse, 5’-CTCGCTCCTGGAAGATGG-3’).
Western Blot (WB) Analysis
The collected cells and cryogenically ground bladder tissue were added to a protein lysis buffer containing protease and phosphatase inhibitors and incubated on ice for 10 minutes to facilitate lysis, followed by ultrasonic disruption. The samples were then centrifuged at 12000 rpm for 10 minutes at 4°C, and the supernatant was collected. Protein concentration was determined using the BCA Protein Assay Kit (P0011, Beyotime). Protein samples were resolved on 10% or 12% sodium dodecyl sulfate polyacrylamide gel electrophoresis (SDS-PAGE) and transferred to polyvinylidene fluoride (PVDF) membranes. The PVDF membranes were blocked with 5% skim milk powder for 2 hours, followed by overnight incubation at 4°C with the corresponding primary antibodies. The primary antibodies used included rabbit anti-NOS3 (27,120-1-AP, 1:500 dilution, Proteintech), MMP9 (10,375-2-AP, 1:1500 dilution, Proteintech), BMP2 (66,383-1-1g, 1:2000 dilution, Proteintech), and CCK (DF8515, 1:2000 dilution, Affinity). After washing with tris-buffered saline tween-20 (TBST), the membranes were incubated for 2 hours at 37°C with the following secondary antibodies: goat anti-mouse IgG-HRP (SA00001-2, 1:5000 dilution, Proteintech) and goat anti-rabbit IgG-HRP (SA00001, 1:10,000 dilution, Proteintech). Finally, the blots were developed using an ECL chemiluminescent reagent (P0018S, Beyotime) with high sensitivity.
Statistical Analysis
All results are presented as the mean ± SEM. GraphPad (version 9.0.0) and R (version 4.3.3) were employed for statistical analysis. Unpaired t test was used to compare the data between the two groups if the data were normally distributed, otherwise the Mann–Whitney test was used Spearman correlation analysis was utilized to investigate relationships between infiltrating immune cells and marker genes, as well as among hub genes. The significance level of P < 0.05 was considered statistically significant.
Results
Identification of the DEGs of IC
A flowchart outlining the study process is depicted in Figure 1. Following the normalization of gene expression levels from the GSE11783 dataset, the results pre- and post-normalization are illustrated in Figure S1. By applying statistical criteria (adj.P < 0.05 and |logFC| > 1), a total of 1893 DEGs were identified, comprising 823 up-regulated genes and 1070 down-regulated genes (Additional file 1: Table S2). Subsequently, we visually presented the DEGs between the IC patient group and control group through volcano plot (Figure 2A) and heat map (Figure 2B). These findings underscore significant differences in gene expression between IC patients and controls, offering novel insights and targets for diagnosis and treatment.
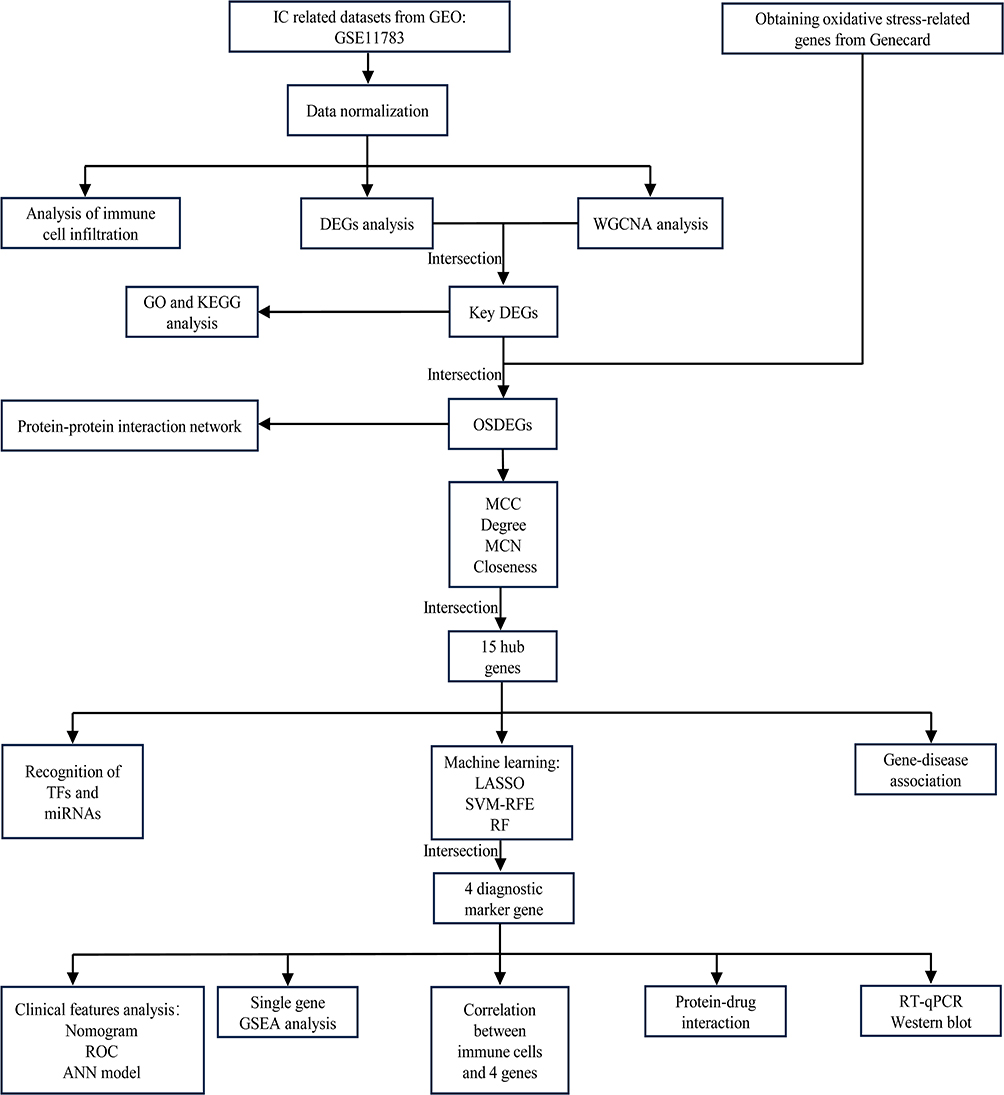 |
Figure 1 Flow diagram of this research. |
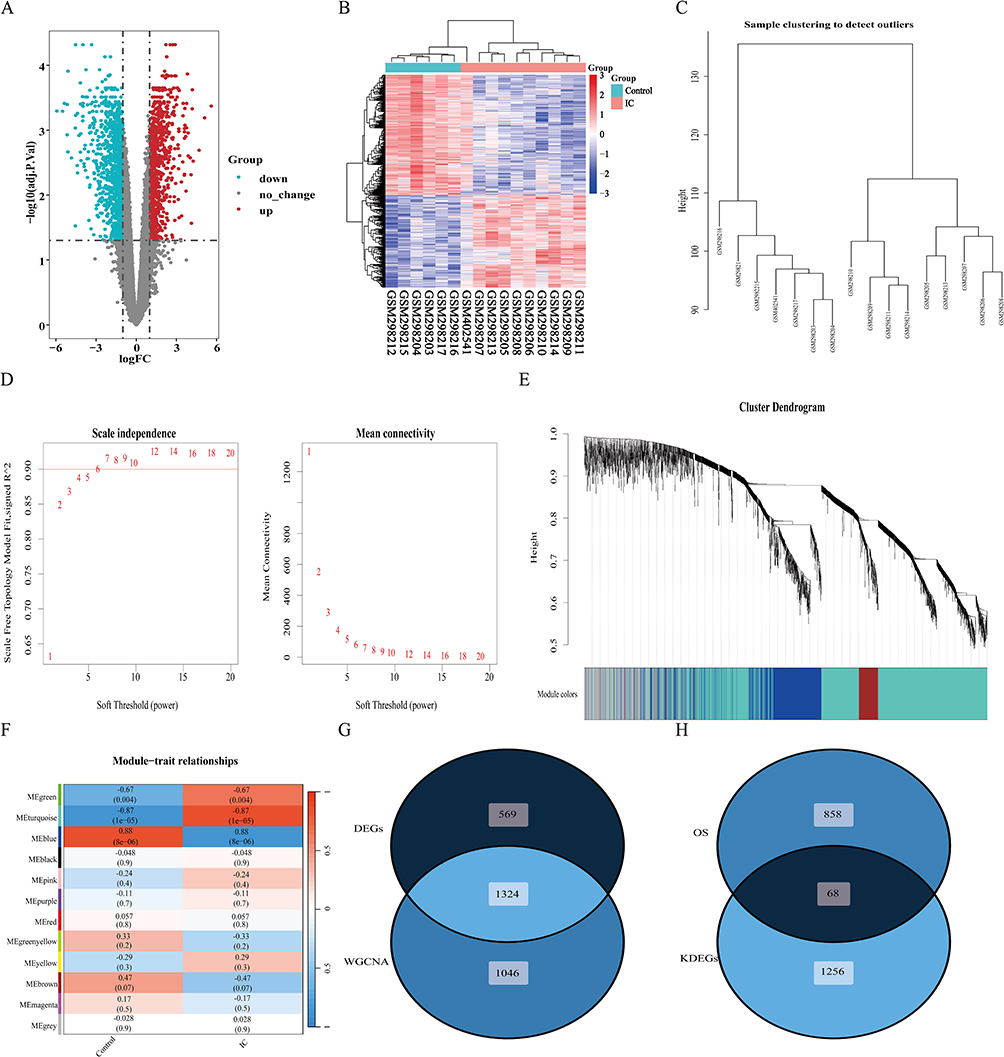 |
Figure 2 DEGs analysis and WGCNA analysis. (A) The volcano plot of genes; (B) The gene heatmap of DEGs; (C) Cluster tree of 16 samples; (D) Choosing the best soft-threshold power, the red line indicates the minimum soft threshold of 6 for constructing the scale-free network; (E) Gene dendrogram for all DEGs; (F) Heatmap illustrating the relationships between modules and traits; (G) The Venn diagram of DEGs and WGCNA genes; (H) The Venn diagram of OS-related genes and key DEGs. Abbreviations: DEGs, differentially expressed genes; WGCNA, Weighted gene co-expression network analysis; OS, oxidative stress. |
Construction of WGCNA in IC and Identification of Key Modules
To delve deeper into the key genes associated with IC, we employed WGCNA to pinpoint the most pertinent gene modules in the IC group. We visualized a clustering dendrogram of the modules, revealing no outliers in the included samples (Figure 2C). After conducting the scale independence and mean connectivity evaluation, we selected a soft threshold power of 6 (Figure 2D). Utilizing this power, we generated a total of 12 modules and elucidated the gene clustering outcomes (Figure 2E). Furthermore, this analysis probed the correlation between IC and gene modules (Figure 2F). Notably, the turquoise module exhibited a positive correlation with IC, encompassing 1701 genes (r = 0.87, P = 1e-05), while the blue module displayed a negative correlation with IC, encompassing 669 genes (r = −0.88, P = 8e-06). Consequently, we designated the turquoise and blue modules as the focal points for subsequent analysis. Within these modules, we identified 2370 key genes significantly associated with IC (Additional file 1: Table S3).
We proceeded to intersect the DEGs with the key module genes identified through WGCNA to pinpoint the key DEGs, yielding a total of 1324 key DEGs (Figure 2G). These key DEGs were subsequently subjected to further enrichment analysis. Additionally, we intersected the key DEGs with OS-related genes, resulting in a total of 68 OSDEGs (Figure 2H). These OSDEGs were subjected to further screening to identify hub genes.
KEGG and GO Analysis
GO analysis and KEGG analysis provided insights into the biological traits and enrichment pathways of the key DEGs. Bubble plots illustrate the top 10 elements of GO terms for each category. In the BP subgroup, these key DEGs were significantly enriched in signaling pathways such as cell differentiation, cellular developmental processes, and regulation of cellular processes. In the CC subgroup, these key DEGs were involved in the extracellular region and vesicle. Furthermore, in the MF subgroup, these key DEGs were associated with identical protein binding and signaling receptor binding (Figure 3A). KEGG enrichment analysis revealed that key DEGs associated with cytokine-cytokine receptor interaction, chemokine signaling pathway, viral protein interaction with cytokine and cytokine receptor, NF-κB signaling pathway, Th17 cell differentiation, B cell receptor signaling pathway, IL-17 signaling pathway, and immunological and metabolic pathways (Figure 3B). Detailed information regarding the enrichment results can be found in the Additional file 1: Table S4.
 |
Figure 3 Enrichment analysis of key DEGs. (A) The GO enrichment analysis plot; (B) The KEGG enrichment analysis plot. Abbreviations: BP, biological process; CC, cellular component; MF, molecular function. |
Construction of PPI and Acquisition of Hub Genes
We utilized the online analysis tool STRING to construct a PPI network based on OSDEGs, revealing their interconnections. The resulting network consisted of 64 nodes and 249 edges (Figure S2A; Additional file 1: Table S5). Subsequently, hub genes were identified using the “CytoHubba” plugin in Cytoscape. The MCC method, known for its high accuracy in detecting key proteins, identified the top 20 most influential genes. Additionally, the Degree, MCN, and Closeness algorithms were employed to identify the top 20 hub genes, respectively (Additional file 1: Table S6). Fifteen common hub genes were identified across these four gene sets, including TNF, MMP9, CXCL8, IFNG, LEP, PPARG, SELE, HMOX1, LCN2, NOS3, DPP4, CCK, MMP1, CCR7, and BMP2, which are considered hub genes of IC (Figure S2B), their interactions with other genes are shown in Figure S2C. Furthermore, these hub genes were annotated using the GeneMANIA database, revealing associations with leukocyte migration, positive regulation of cell-cell adhesion, neutrophil migration, regulation of neutrophil chemotaxis, regulation of leukocyte migration, granulocyte chemotaxis, and neutrophil chemotaxis (Figure S2D). Figure S2E illustrates the correlation between hub genes.
Construction of the Regulatory Network
Figure 4A shows regulatory interactions between miRNAs and genes, with the inner circle representing miRNAs and the outer circle indicating hub genes. Significant miRNAs include hsa-mir-27a-5p, hsa-mir-129-2-3p, hsa-mir-27a-3p, hsa-mir-210-3p, hsa-mir-7-5p, hsa-mir-155-5p, hsa-mir-146a-5p, and hsa-mir-34a-5p. Detailed miRNA regulatory networks are provided in Additional file 1: Table S7. Figure 4B depicts the interactions between TFs and hub genes, with the inner circle representing TFs and the outer circle representing hub genes. Significant TFs include FOXC1, GATA2, E2F1, YY1, FOXL1, NFKB1, FOS, JUN, TP53, and GATA3. Detailed data are provided in Additional file 1: Table S8. These networks play a crucial role in understanding the intricate layers of gene regulation within the cell, elucidating the mechanisms by which genes are activated or suppressed, how miRNAs finely tune this regulation, and the delicate balance that maintains normal cellular function or leads to disease when dysregulated. Additionally, we validated the expression of TFs in the GSE11783 dataset and found that four TFs were significantly differentially expressed. Specifically, E2F1 was upregulated in the IC group compared to controls, while GATA2, GATA3, and TP53 were downregulated in the IC group (Figure 4C).
 |
Figure 4 Network of regulatory interactions and associations. (A), (B) The network of gene-TF and gene-miRNA regulatory interactions. (C) Expression of TFs in GSE11783 datasets. (D) The gene-disease association network. ****, **, * represent P<0.0001, P<0.01, P<0.05. Abbreviations: TFs, transcription factors; miRNAs, microRNAs. |
Identification of Disease Associations
Connections are established through hub genes, and various diseases may exhibit interrelationships. Gene-disease association studies conducted on the NetworkAnalyst platform reveal intriguing connections. We observed that major depressive disorder, mental depression, proteinuria, schizophrenia, depressive disorder, nerve degeneration, and inflammation are strongly linked to hub genes (Figure 4D). Detailed data can be found in Additional file 1: Table S9. Remarkably, most of these diseases are closely associated with inflammatory or immune responses in the organism. Interestingly, we found that these hub genes are closely associated with psychiatric symptoms, which is consistent with the previously reported presence of anxiety and depression in IC patients.53–55 Hence, these hub genes might also contribute to the development of anxiety and depressive symptoms in patients with IC.
Screening of Candidate Diagnostic Markers by Machine Learning
To further identify diagnostic marker genes for IC, we employed three machine learning algorithms: LASSO, SVM-RFE, and RF. Using LASSO logistic regression analysis, we extracted 6 genes from the hub genes (Figure 5A). RF analysis identified 7 genes (Figure 5B), while SVM-RFE analysis identified 7 genes (Figure 5C). By overlapping the results from all three algorithms using a Venn diagram, we finally obtained 4 genes: BMP2, MMP9, CCK, and NOS3 (Figure 5D; Additional file 1: Table S10). Among them, MMP9, CCK, and NOS3 exhibited higher expression in the IC group, while BMP2 had lower expression compared to the control group (Figure 6A). Next, an ANN model was constructed using these four genes, which demonstrated high proficiency in distinguishing between IC and control samples (Figure 6B; Additional file 1: Table S11). The diagnostic performance of these four genes was evaluated using ROC curves based on the expression data, with the AUC values for all four genes exceeding 0.9 (Figure 6C). Corresponding nomogram models were constructed to demonstrate the diagnostic value of these genes, with the nomogram score used to predict the likelihood of having IC (Figure 6D). Furthermore, DCA results indicated that the model had high clinical application value (Figure 6E), and calibration curves showed that the nomogram model predicted IC very well (Figure 6F). Overall, these findings suggest that these four genes have a strong ability to recognize IC, providing a feasible approach to diagnose and intervening in patients with IC.
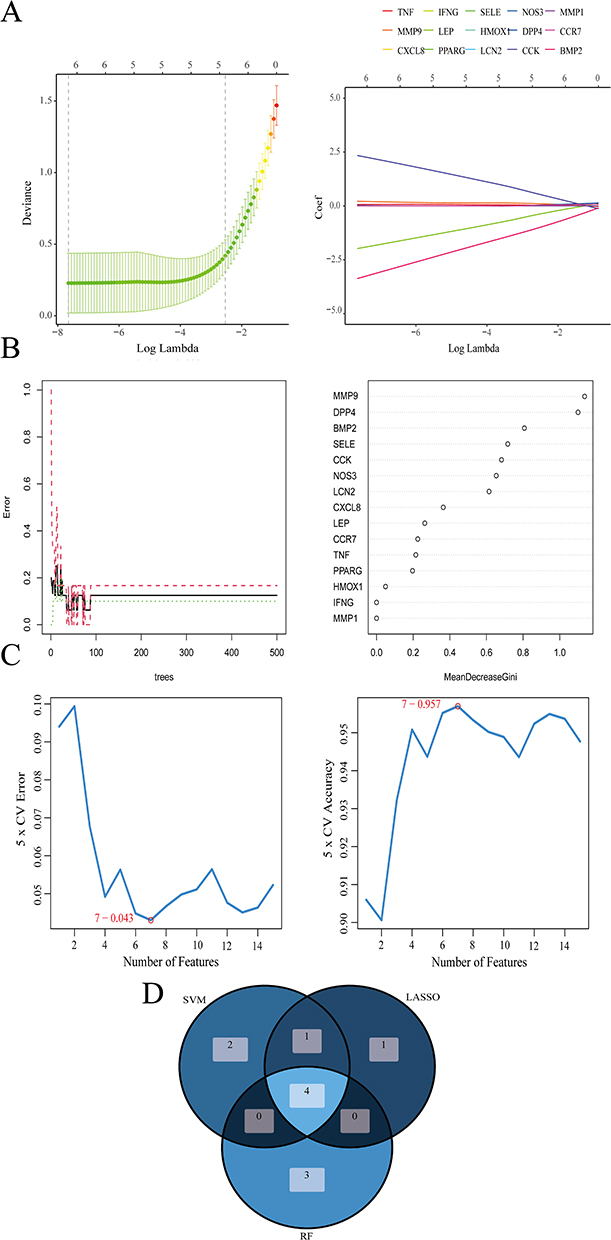 |
Figure 5 Screening diagnostic marker genes using machine learning. (A) LASSO logistic regression analysis. (B) RF analysis. (C) SVM-RFE analysis. (D) Venn diagrams for three analysis method results. Abbreviations: LASSO, Least Absolute Shrinkage and Selection Operator; SVM-RFE, Support Vector Machine-Recursive Feature Elimination; RF, Random Forest. |
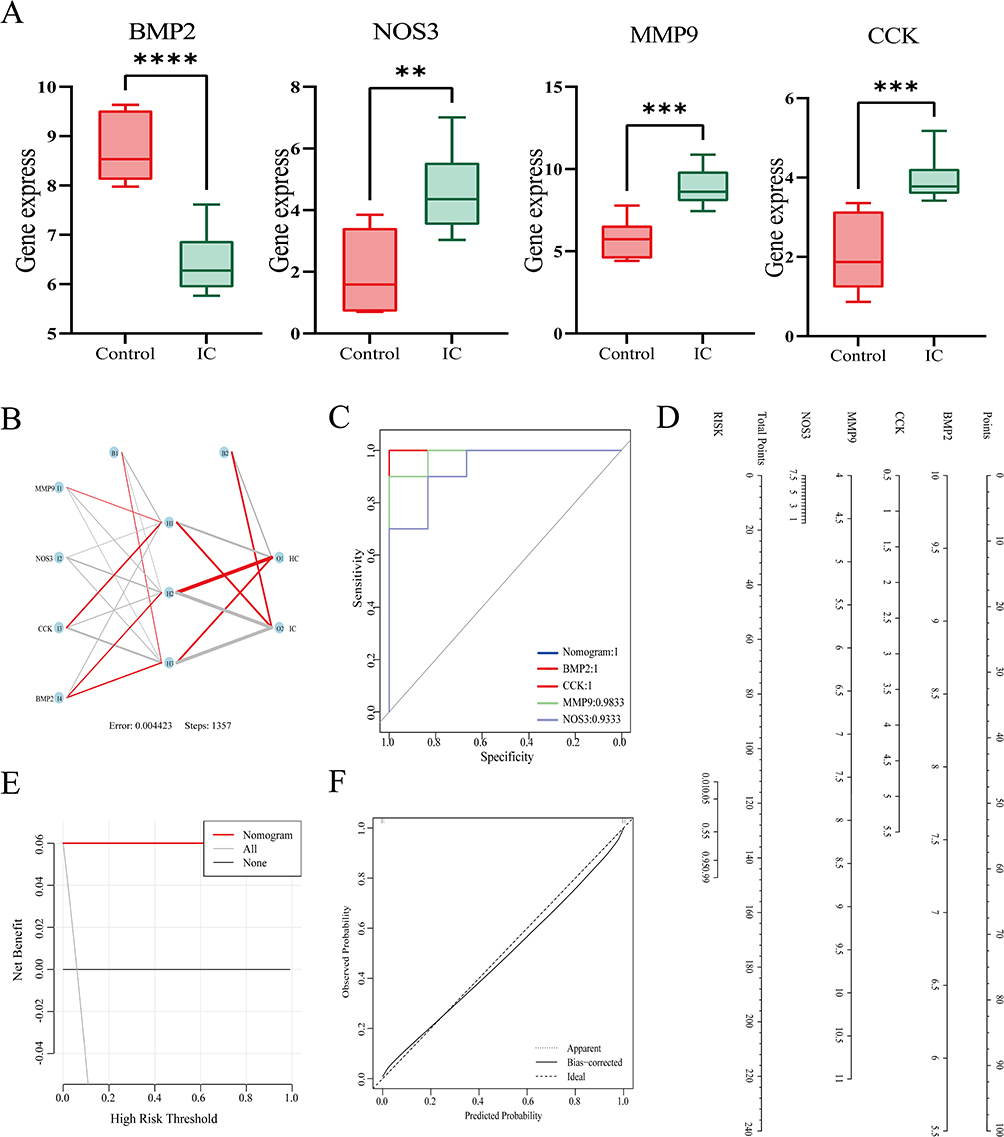 |
Figure 6 Nomogram model construction for IC diagnosis. (A) Expression of diagnostic marker genes in the GSE11783 dataset. (B) ANN model plot. Positive weights are connected by red lines, negative weights are connected by gray lines, and the thickness of the lines reflects the size of the weights. (C) ROC curves of the four genes and Nomogram model. (D) Nomogram to predict IC risk. (E) DCA curve to assess the practical efficacy of the nomogram. (F) Calibration curve evaluation for the diagnostic potential of the nomogram model. ****, ***, **, represent P<0.0001, P<0.001, P<0.01. Abbreviations: DCA, decision curve analysis; ROC, receiver operating characteristic; AUC, area under the ROC curve; ANN, artificial neural network. |
Single-GSEA Analysis
The KEGG pathway involving the four genes in IC was assessed using GSEA. Gene expression levels were categorized as high and low based on the median expression levels to explore the potential pathways these genes are involved in during IC occurrence (Figure S3A–D; Additional file 1: Table S12). The top 10 significant terms for each gene are shown. The BMP2 high-expression group was predominantly enriched in the PPAR signaling pathway and basal cell carcinoma pathways, while the low-expression group was predominantly enriched with immune-related pathways. Conversely, the MMP9, CCK, and NOS3 low-expression groups were all predominantly enriched in metabolic pathways. These findings suggest that the high-expression groups were mainly associated with immune-related pathways, while the low-expression groups were more linked to metabolic pathways. Notably, all genes were associated with primary immunodeficiency and the PPAR signaling pathway. Therefore, we suggest that these four genes are strongly associated with inflammation as well as immune responses during IC.
Immune Landscape and Correlation with Diagnostic Marker Genes
The immune landscape plays a crucial role in understanding the composition and activity of immune cells, offering valuable insights into disease progression prediction and therapy effectiveness. Based on the results of the previously described functional enrichment analysis, the immune pathway emerged as a key factor in the occurrence of IC. The immune landscape in IC disease was revealed using the CIBERSORT algorithm, which identified 22 immune cell subclasses. Figure 7A shows the proportions of 22 immune cell types. We observed significant differences between the IC group and control group in several immune cell types, including B cells memory, plasma cells, T cells CD4+ naive, T cells CD4+ memory resting, T cells CD4+ memory activated, T cells follicular helper, macrophages M0, macrophages M2, mast cells resting, eosinophils, and neutrophils (Figure 7B; Additional file 1: Table S13). Furthermore, we analyzed the relationship between the level of infiltration of the 22 immune cells and the four genes of interest (Additional file 1: Table S14). Correlation analysis revealed that all four genes were associated with T cells CD4+memory resting, T cells CD4+ memory activated, and Eosinophils. MMP9, CCK, and NOS3 were positively correlated with T cells CD4+ memory activated and Eosinophils, whereas they were positively and negatively correlated with T cells CD4+ memory resting, respectively. The correlation results for BMP2 were opposite to the other three genes (Figure 7C and D). These findings suggest a change in the immune environment in IC patients and imply that these four genes may simultaneously influence an immune component of IC under the influence of OS.
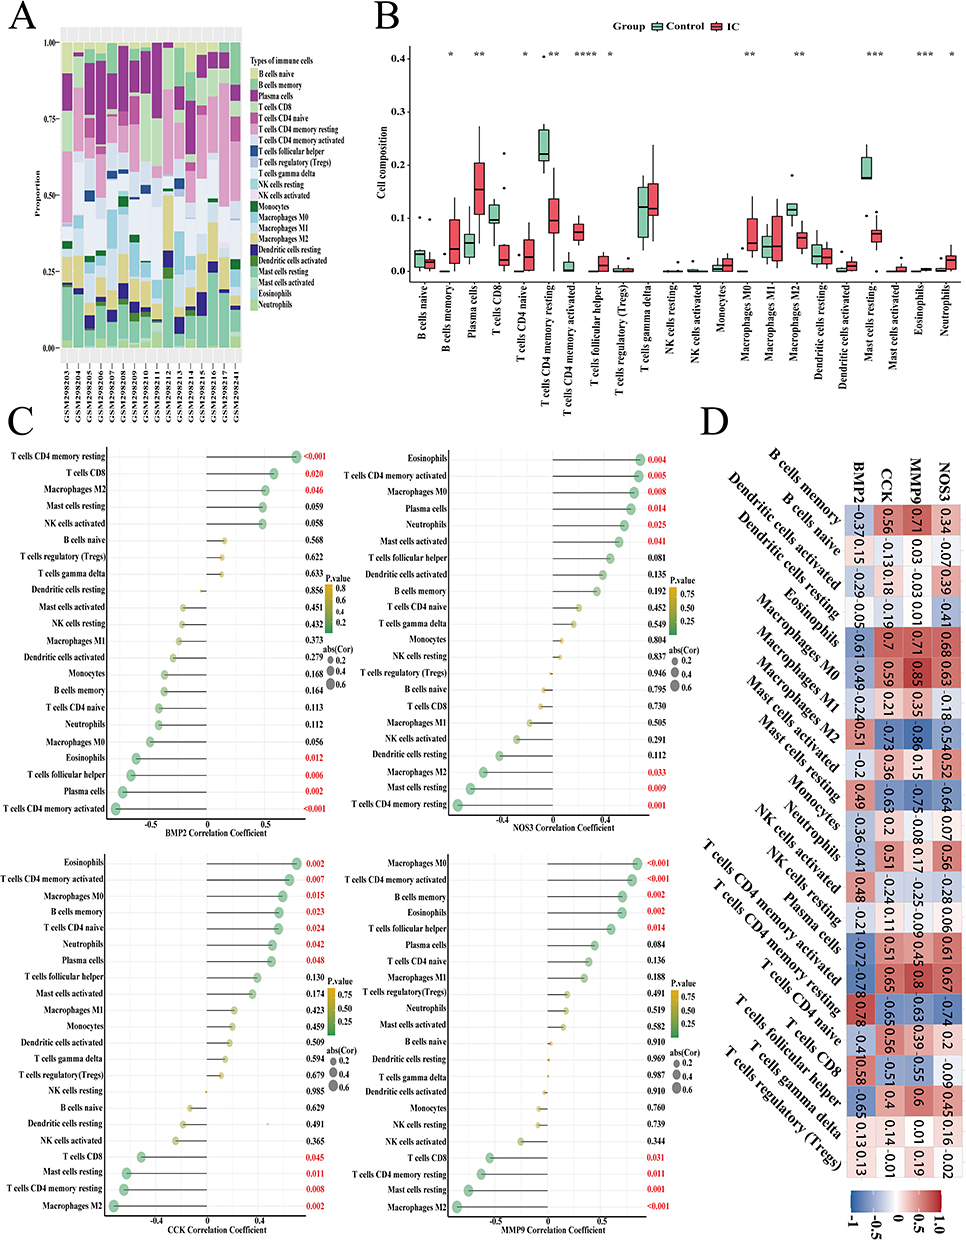 |
Figure 7 Infiltration pattern of immune cell subtypes. (A) A stacked plot of the expression of 22 types of immune cells in each sample; (B) The expression of 22 types of immune cells. (C), (D) The correlation analysis plot between 4 genes and 22 types of immune cells; ****, ***, **, * represent P<0.0001, P<0.001, P<0.01, P<0.05. The red numerical text indicates a p-value less than 0.05. |
Exploration of Potential Drugs
Using the DSigDB module in the EnrichR database, we identified potential drug candidates targeting the 4 genes of interest. By evaluating adj.P and combined score, we identified the most relevant drugs with promise in targeting potential therapeutic pathways for IC, deserving further exploration. The top 10 relevant drugs are listed in Table 2: Decitabine, Roxarsone, DL-Mevalonic acid, Octreotide, ACMC-20mvek, 2,4-Diisocyanato-1-methylbenzene, TIRON, Phenylarsine oxide, and Diallyl disulfide. Particularly noteworthy is Decitabine, which was associated with all four genes.
 |
Table 2 Top 10 Gene-Targeted Drugs for IC |
External Validation of Maker Genes
The experimental results demonstrated that following TNF-α induction, mRNA expression of MMP9 and NOS3 significantly increased, whereas BMP2 mRNA and protein expression notably decreased in SV-HUC-1 cells, consistent with our bioinformatics predictions (Figure 8A and C). Similar trends were observed for MMP9, NOS3, and BMP2 mRNA and protein expression in T24 cells (Figure 8B and C). Importantly, CCK mRNA expression was found to be very low in both T24 and SV-HUC-1 cells. These experimental findings validate and reinforce the predictive value of bioinformatics analysis, thereby further supporting the involvement of MMP9, NOS3, and BMP2 in the pathogenesis of IC.
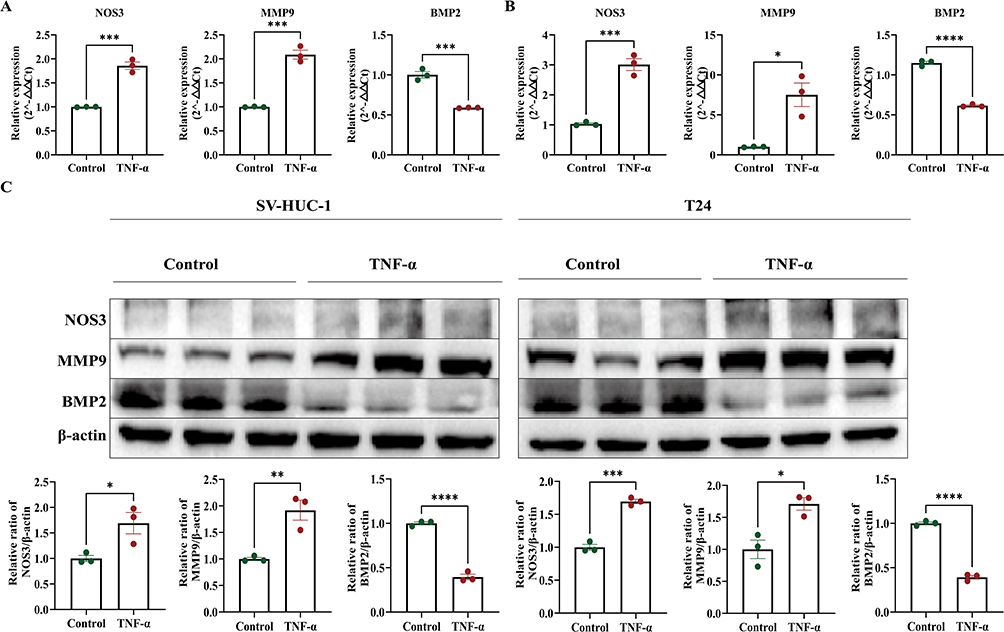 |
Figure 8 Validation of hub genes expression in cell experiments. (A) The mRNA expression levels of three genes in the SV-HUC-1 cell line. (B) The mRNA expression levels of three genes in the T24 cell line. (C) The mRNA and protein expression levels of three genes in the SV-HUC-1 cell line and T24 cell line. ****, ***, **, * represent P<0.0001, P<0.001, P<0.01, P<0.05. Experiments were performed with 3 independent trials and 3 repetitions per trial. |
In vivo experiments further validated our bioinformatics analysis results. In the CYP-induced IC rat model, we observed significantly higher mRNA and protein expression levels of MMP9, NOS3, and CCK in IC rats compared to healthy rats, while the mRNA and protein expression levels of BMP2 were significantly lower. (Figure 9A and B) These results suggest that MMP9, NOS3, CCK, and BMP2 may play important roles in the onset and progression of IC.
 |
Figure 9 Validation of hub genes expression in v animal experiments. (A) The mRNA expression levels of four genes in the IC rat model. (B) The protein expression levels of four genes in the IC rat model. ****, ***, **, * represent P<0.0001, P<0.001, P<0.01, P<0.05. |
Discussion
IC is a troubling disease characterized by a complex pathogenesis involving numerous associated conditions. A majority of patients experience anxiety, depression, and other obstacles, which contribute to the complexity and chronicity of treatment. Moreover, misdiagnosis of IC as urinary tract infection, urethral syndrome, pelvic inflammatory disease, or overactive bladder56 can lead to inappropriate treatment, worsening the patient’s state. Enhancing the diagnostic precision of IC is crucial, necessitating the development of more sensitive and specific markers. Increased ROS production in IC patients is well documented. Jiang et al19,57 showed elevated levels of urinary OS biomarkers (8-OHdG, 8-isoprostane), while Ener et al20 found that the total antioxidant capacity of serum samples from IC patients was significantly lower than that of controls. Recently, a study assessed serum and urine samples from IC/BPS patients and found a significant elevation in the OS marker 8-isoprostane in both serum and urine.18 These findings, along with the complex interactions between OS, inflammation, and immunity, suggest a new research direction. Therefore, the quest for novel diagnostic markers linked to OS is paramount. These markers not only offer fresh insights for early IC detection but also lay the groundwork for tailored treatment strategies.
Through KEGG enrichment analysis, we found that the DEGs are predominantly enriched in inflammation and immune-related pathways, with several pathways also associated with oxidative stress. For instance, ROS can indirectly inhibit nitric oxide (NO) production by uncoupling endothelial nitric oxide synthase (eNOS), which serves as a negative regulator of nuclear factor kappaB (NF-κB). Consequently, this process activates the NF-κB signaling pathway, leading to inflammation.58,59 TH17 cells, a distinct subset of CD4+ T cells, have been implicated as causal agents in various autoimmune diseases like psoriasis,60 multiple sclerosis,61 rheumatoid arthritis,62 and inflammatory bowel disease.63 IL-17, primarily secreted by TH17 cells, plays a pivotal role in inducing a wide array of cytokines, chemokines, inflammatory factors, and antimicrobial proteins.64,65 These molecules target genes involved in autoimmunity and chronic inflammation.66 Notably, recent research by Wang et al67 demonstrated a correlation between the level of OS and Th17 activation in trichloroethylene-induced autoimmune diseases. Given these findings, therapeutic strategies targeting OS hold particular importance and promise in managing such conditions.
TFs serve as major orchestrators of biological processes, exerting control over the expression of multiple gene targets and forming intricate feedback loops. During the early stages of diseases like IC, numerous genes, including many TFs, undergo significant alterations. Previous research has highlighted the involvement of several TFs, such as E2F1, JUN, and TP53,68,69 in the occurrence process of IC, aligning with our findings. In our study, the TFs associated with hub genes, as predicted, hold promise as novel candidate genes for investigating the regulation of IC pathophysiological processes in future studies. Meanwhile, miRNA research represents a burgeoning area of interest across various scientific disciplines. A wealth of evidence now underscores the critical role of miRNAs in immune system development, as well as their contributions to innate and adaptive responses. miRNAs such as mir-155, mir-181a, mir-146a, mir-150, mir-223, and mir-17-92 have been demonstrated to play regulatory roles in immune cell development, differentiation, and function.70,71 Moreover, in a mouse model of cyclophosphamide-induced cystitis, miRNAs like mir-34c-5p, mir-34b-3p, mir-212-3p, mir-449a-5p, and mir-21a-3p, as well as mir-376b-3p, mir-376b-5p, and mir-409-5p, have shown involvement in inflammation and smooth muscle function over the medium term.72 However, the specific mechanisms by which the miRNAs identified in our study exert their effects on IC remain incompletely elucidated, warranting further investigation into their roles in IC pathology.
In our experiments, both cell and animal model results consistently suggest that MMP9, NOS3, and CCK may play crucial roles in the development and progression of IC. Specifically, mRNA expression of MMP9 and NOS3 was significantly increased in SV-HUC-1 and T24 cells following TNF-α induction, while BMP2 expression was notably decreased, which aligns with our bioinformatics predictions. In the CYP-induced IC rat model, expression levels of MMP9, NOS3, and CCK were significantly elevated in IC rats, whereas BMP2 expression was significantly reduced. These findings support our hypothesis that these genes are key contributors to IC pathogenesis. However, we observed that both T24 and SV-HUC-1 cells expressed very low levels of CCK. We hypothesize that these uroepithelial cell lines, T24 and SV-HUC-1, do not express CCK, unlike neuroendocrine cells which are capable of CCK expression. Neuroendocrine cells present in bladder tissues within the uroepithelium can respond to certain chemicals, such as those produced by infecting bacteria, thereby influencing bladder activity.73,74 This likely explains why CCK can be detected in bladder biopsies but not in T24 and SV-HUC-1 cells.
In this study, we identified four diagnostic marker genes (BMP2, MMP9, CCK, and NOS3) significantly associated with IC using a combination of DEGs analysis, WGCNA, PPI networks, and machine learning. The ANN model, ROC analysis, and nomogram diagnostic model demonstrated that these markers have excellent discriminatory ability in distinguishing the IC group from controls. These results suggest that BMP2, MMP9, CCK, and NOS3 are significantly involved in the pathological processes of IC and have potential as diagnostic markers and therapeutic targets for this disease. Recent research indicates that BMP2 overexpression in osteoblasts (specifically MC3T3-E1) inhibits apoptosis, diminishes ROS production, and lowers the secretion of TNF-α, IL-6, and macrophage colony-stimulating factor (M-CSF).75 Consequently, BMP2 is deemed beneficial, aligning with our observation of reduced BMP2 expression in the IC patient group. While BMP2 has been extensively studied in orthopedic diseases, its role in IC remains uncertain. Subsequent investigations ought to delve into the precise mechanisms and therapeutic potential of BMP2 in IC, offering novel insights and treatment modalities. MMP9 not only contributes to tissue remodeling and inflammation but is also implicated in various autoimmune disorders such as systemic lupus erythematosus, Sjogren’s syndrome, systemic sclerosis, rheumatoid arthritis, multiple sclerosis, polymyositis, and atherosclerosis.76 Recent literature reports a significant elevation in MMP9 expression in a cyclophosphamide-induced rat model of IC,77,78 correlating with processes such as inflammatory response, cell migration, and tissue damage. This aligns with our discovery of elevated MMP9 expression in the IC patient group. Additionally, a recent study reported elevated urinary and serum levels of MMP9 in IC/BPS patients, with serum MMP9 levels correlating with disease pain and distinguishing patients with or without Hunner’s lesions (AUC = 0.836).18 This significant finding further reinforces the role of MMP9 in the pathogenesis of IC/BPS and aligns with our results. Furthermore, MMPs are integral to the extracellular matrix proteasome and influence the remodeling and degradation of tight junctions (TJs). For instance, certain MMPs family genes, including MMP9, MMP7, and MMP2, have been shown to decrease the expression of TJ proteins,79,80 implicating MMP-9 in diverse pathogenic mechanisms of IC and suggesting its potential as a therapeutic target. CCK (Cholecystokinin) functions as both a neuropeptide and gut hormone, regulating pancreatic enzyme secretion, gastrointestinal motility, and satiety signaling. It is released by endocrine cells of the small intestine and various neurons in the gastrointestinal tract and central nervous system following ingestion.81 A significant portion of current research has focused on its regulatory functions within the digestive, nervous, and endocrine systems. While bladder diseases remain poorly understood, our analysis suggests that CCK may contribute to IC occurrence through its impact on OS and immune responses. Consequently, conducting a comprehensive investigation into the mechanisms underlying CCK’s involvement in bladder diseases, particularly its modulation of OS in bladder tissues, holds promise for identifying novel therapeutic targets. NOS3 exhibits significantly higher levels in Hunner type IC bladder samples compared to non-Hunner IC bladder samples, indicating potential involvement of eNOS in the divergent pathogenesis of these IC subtypes.82 eNOS, an enzyme crucial for NO production. NO serves as a signaling molecule with diverse physiological functions and extensive implications in both physiological and pathophysiological contexts. Its roles encompass the regulation of vascular tone, promotion of angiogenesis in wound healing, modulation of inflammatory responses, and involvement in pathologies such as ischemic cardiovascular disease and malignancies.83 Under normal conditions, eNOS synthesizes substantial quantities of NO, contributing to the maintenance of homeostasis between the endothelium and adjacent tissues.28 Similar to endothelial tissue, the urothelial epithelium of the lower urinary tract possesses NOS and produces NO. Inflammation resulting from chronic irritation or infection leads to increased NO production, and the upregulation of NOS in response to chronic inflammation may serve as an adaptive mechanism to enhance spinal nociceptive or reflexive responses triggered by nociceptive inputs from the bladder.84 This phenomenon has been verified in a study by M V Souza-Fiho et al.85
Previous studies have established that IC development involves the infiltration of various immune cells, including T cells, B cells, plasma cells, macrophages, neutrophils, and mast cell.6,86 Our study conducted a comprehensive analysis of the infiltration extent of 22 immune cell types using the CIBERSORT algorithm. We observed differences in immune cell infiltration levels between the IC and control groups, consistent with previous findings. Furthermore, we discovered associations between the four genes and T cell CD4+memory resting, T cell CD4+ memory activated, and eosinophils. CD4+ T cells play multifaceted roles in regulating immune responses, naive CD4+ T cells can differentiate into various subpopulations, including Th1, Th2, Th17, Th22, Tfh and CTLs, each with distinct phenotypes and protective functions. These subpopulations are crucial in pathogen response, immune regulation, and maintaining immune homeostasis.87 CD4+ T cells play a critical immunoregulatory role in the occurrence and progression of IC,6 they recruit and activate other immune cells through the secretion of various cytokines and chemokines, thereby contributing significantly to the immune response in IC and research has indicated a significant increase in dysfunctional CD4+ T cells in IC patients.88 Eosinophilic primarily maintain the tissue microenvironment during normal development and regulate host innate and adaptive immune responses.89 Eosinophils express and release epithelial-mesenchymal transition mediators, including TGF-β, basic fibroblast growth factor, platelet-derived growth factor, matrix metalloproteinases, and vascular endothelial growth factor. They also release other repair/remodeling factors, such as nerve growth factor, neuropeptides, and cytokines like IL-1β and IL-6.90 Despite extensive study, the specific role of eosinophils in IC remains unclear. The existing research suggests that eosinophils may play a role in the pathological process of IC, particularly through allergy-related mechanisms. Some scholars91,92 speculate that allergic reactions could potentially trigger IC, with eosinophils playing a significant role in this response. They found significantly elevated levels of eosinophilic protein X in the morning urine of interstitial cystitis patients compared to controls, along with occasional eosinophil infiltration in the submucosal layer upon bladder tissue biopsy. Additionally, researchers82 have observed more severe or moderate eosinophilic infiltration in Hunner IC bladder specimens compared to non-Hunner IC specimens. Therefore, increased eosinophils may contribute to the progression of IC. Further studies are necessary to elucidate the specific functions of eosinophils in IC disease progression and symptom presentation. To investigate the potential biological functions of the four genes in IC, we found, using GSEA, that they are associated with primary immunodeficiency and the peroxisome proliferator-activated receptor (PPAR) signaling pathway. PPARs are ligand-dependent transcription factors belonging to the nuclear hormone receptor superfamily. PPARα is one of its subtypes. PPARα is expressed in macrophages, dendritic cells (DCs), B cells, and T cells, actively participating in various aspects of immune regulation by modulating cytokine production in DCs and T cells, as well as lymphocyte proliferation.93 Furthermore, research has confirmed that PPARα exhibits anti-inflammatory effects by inhibiting the NF-κB signaling pathway and reducing the expression of inducible NOS, cyclooxygenase-2, and TNF-α.94 Kuret et al95 found that Cannabidiol significantly reduces the mRNA and protein levels of inflammatory factors (such as IL1α, IL8, etc) by modulating the PPARγ/Nrf2/NF-κB signaling pathway. It also inhibits NFκB phosphorylation, reduces the production of reactive oxygen species, and promotes the expression of antioxidant enzymes. These findings further demonstrate the association between OS, inflammation, and immunity. Additionally, the PPAR signaling pathway is considered a viable therapeutic target for treating chronic pain and its stress-related psychiatric complications.96 Therefore, further investigation into the role of these four genes in the PPAR signaling pathway in IC is crucial.
Through screening, we identified Decitabine as the most promising drug candidate for the treatment of IC. Decitabine (5-aza-2’-deoxycytidine) is a DNA methyltransferase inhibitor with a wide range of antimetabolic and anticancer activities. Recent studies have found that Decitabine alleviates symptoms of acute respiratory distress syndrome through its anti-inflammatory and antioxidant properties and by inhibiting the mitogen-activated protein kinase (MAPK) pathway.97 Additionally, Chang Su et al98 found that Decitabine increased the release of the inhibitory factor IL-10, decreased the pro-inflammatory factor IL-17, activated CD4+ Foxp3+ T cells, and elevated levels of zonula occludens 1 and occludin, thereby reducing symptoms of ulcerative colitis. Therefore, Decitabine has potential therapeutic value for the treatment of IC.
In this study, we first identified the intersection between differentially expressed genes in IC patients and oxidative stress gene sets, uncovering four OS-related biomarkers (CCK, MMP9, NOS3, BMP2) with significant clinical application potential. Firstly, these genes can serve as tools for the early diagnosis of IC, assisting physicians in identifying patients before symptoms become apparent, thereby improving diagnostic accuracy. Secondly, personalized treatment plans can be developed based on the expression levels of these genes, particularly targeting the regulation of oxidative stress and immune responses to enhance treatment outcomes. Additionally, Decitabine, identified as a potential therapeutic molecule for IC, offers a new direction for drug development, demonstrating promising clinical application prospects. Monitoring these biomarkers could also be utilized to assess disease progression and treatment response, providing strong support for clinical decision-making. In summary, our research offers new targets for future clinical and basic research, advancing the understanding of the pathogenesis of IC.
There are several limitations to our study. First, it involved secondary data mining and analysis of a previously published dataset, where differences in dataset selection and analysis methods could influence outcomes. Second, due to the lack of clinical samples, validation was limited to the cellular and animal level. Third, the impact of these oxidative stress-related markers on inflammatory and immune responses, contributing to IC occurrence, remains unclear. Therefore, future studies should include diverse populations and larger sample sizes, employing both in vitro and in vivo experiments for validation.
Conclusion
Through comprehensive bioinformatics analysis, we demonstrated differences in oxidative stress-related genes and immune cell infiltration between IC patients and controls, revealing for the first time the correlation between OS and immune infiltration in IC. We used machine learning algorithms to identify four mitochondria-related candidate core genes (BMP2, MMP9, CCK, and NOS3) and developed a nomogram for early diagnosis and monitoring of IC patients. This study also identified TFs, miRNAs, and drug molecules that may regulate the hub genes. These findings may offer new perspectives on potential therapeutic targets for IC, enhance understanding of IC mechanisms, and suggest new approaches for IC diagnosis.
Abbreviations
IC, Interstitial cystitis; OS, Oxidative stress; ROS, Reactive oxygen species; BMP2, Bone morphogenetic protein 2; MMP9, Matrix metalloproteinase-9; CCK, Cholecystokinin; NOS3, Nitric oxide synthase 3; NO, Nitric oxide; GEO, Gene expression omnibus; DEGs, Differentially expressed genes; WGCNA, Weighted gene co-expression network analysis; GO, Gene ontology; KEGG, Kyoto encyclopedia of genes and genomes; BP, Biological processes; CC, Cellular components; MF, Molecular functions; TFs, Transcription factors; LASSO, Least absolute shrinkage and selection operato; SVM-RFE, Support vector machine recursive feature elimination; RF, Random forest; ROC, Receiver operating characteristic; AUC, Area under the curves; GSEA, Single-gene set enrichment analysis; TJs, Tight junctions; PPAR, Peroxisome proliferator-activated receptor.
Data Sharing Statement
The data that support the findings of this study are available from the corresponding author, [NF], upon reasonable request.
Ethics Approval
Ethical approval was obtained from the Ethics Committee of Jiangnan University (Approval No. 20220930S0481025). All experiments were performed following the guidelines and regulations set by the relevant institutional and national ethical committees.
Funding
This work was supported by the National Natural Science Foundation of China (Grant No. 82370777).
Disclosure
The author(s) report no conflicts of interest in this work. This paper has been uploaded to Research Square as a preprint: https://www.researchsquare.com/article/rs-4642942/v1.pdf.
References
1. van de Merwe JP, Nordling J, Bouchelouche P, et al. Diagnostic criteria, classification, and nomenclature for painful bladder syndrome/interstitial cystitis: an ESSIC proposal. Europ Urol. 2008;53:60–67. doi:10.1016/j.eururo.2007.09.019
2. Tripp DA, Dueck J, Holden RR, et al. Biopsychosocial predictors of suicide risk in patients with interstitial cystitis/bladder pain syndrome. Can Urol Assoc J. 2021;15(12):E630–E636. doi:10.5489/cuaj.7337
3. Humphrey L, Arbuckle R, Moldwin R, et al. The bladder pain/interstitial cystitis symptom score: development, validation, and identification of a cut score. Europ Urol. 2012;61(2):271–279. doi:10.1016/j.eururo.2011.10.004
4. Dasgupta J, Tincello DG. Interstitial cystitis/bladder pain syndrome: an update. Maturitas. 2009;64:212–217. doi:10.1016/j.maturitas.2009.09.016
5. Nasrin S, Masuda E, Kugaya H, et al. Improvement by phytotherapeutic agent of detrusor overactivity, down-regulation of pharmacological receptors and urinary cytokines in rats with cyclophosphamide induced cystitis. J Urol. 2013;189:1123–1129. doi:10.1016/j.juro.2012.09.054
6. Peng L, Jin X, Li B, et al. Integrating single-cell RNA sequencing with spatial transcriptomics reveals immune landscape for interstitial cystitis. Sig Transduct Target Ther. 2022;7:161. doi:10.1038/s41392-022-00962-8
7. Yu W-R, Jiang Y-H, Jhang J-F, et al. Use of urinary biomarkers in discriminating interstitial cystitis/bladder pain syndrome from male lower urinary tract dysfunctions. IJMS. 2023;24:12055. doi:10.3390/ijms241512055
8. Erickson DR, Xie SX, Bhavanandan VP, et al. A comparison of multiple urine markers for interstitial cystitis. J Urol. 2002;167:2461–2469. doi:10.1016/S0022-5347(05)65005-7
9. Moldwin RM, Nursey V, Yaskiv O, et al. Immune cell profiles of patients with interstitial cystitis/bladder pain syndrome. J Transl Med. 2022;20:97. doi:10.1186/s12967-022-03236-7
10. Fall M, Nordling J, Cervigni M, et al. Hunner lesion disease differs in diagnosis, treatment and outcome from bladder pain syndrome: an ESSIC working group report. Scand J Urol. 2020;54:91–98. doi:10.1080/21681805.2020.1730948
11. Akiyama Y, Homma Y, Maeda D. Pathology and terminology of interstitial cystitis/bladder pain syndrome: a review. Histol Histopathol. 2018;34:25–32. doi:10.14670/HH-18-028
12. Inoue T, Tsukada M, Tsunokawa Y, et al. The Japanese herbal medicine yokukansan exerted antioxidant and analgesic effects in an experimental rat model of hunner-type interstitial cystitis. Medicina. 2022;58(6):810. doi:10.3390/medicina58060810
13. Homma Y, Akiyama Y, Tomoe H, et al. Clinical guidelines for interstitial cystitis/bladder pain syndrome. Int J Urol. 2020;27:578–589. doi:10.1111/iju.14234
14. Lai HH, Pickersgill NA, Vetter JM. Hunner lesion phenotype in interstitial cystitis/bladder pain syndrome: a systematic review and meta-analysis. J Urol. 2020;204:518–523. doi:10.1097/JU.0000000000001031
15. Patnaik SS, Laganà AS, Vitale SG, et al. Etiology, pathophysiology and biomarkers of interstitial cystitis/painful bladder syndrome. Arch Gynecol Obstet. 2017;295:1341–1359. doi:10.1007/s00404-017-4364-2
16. A VDP, Van Gilst WH, Voors AA, et al. Treating oxidative stress in heart failure: past, present and future. European J of Heart Fail. 2019;21:425–435. doi:10.1002/ejhf.1320
17. Mohammad A, Laboulaye MA, Shenhar C, et al. Mechanisms of oxidative stress in interstitial cystitis/bladder pain syndrome. Nat Rev Urol. 2024;21:433–449. doi:10.1038/s41585-023-00850-y
18. Kuret T, Sterle I, Romih R, et al. Matched serum- and urine-derived biomarkers of interstitial cystitis/bladder pain syndrome. PLoS One. 2024;19:e0309815. doi:10.1371/journal.pone.0309815
19. Jiang Y-H, Jhang J-F, Ho H-C, et al. Urine oxidative stress biomarkers as novel biomarkers in interstitial cystitis/bladder pain syndrome. Biomedicines. 2022;10(7):1701. doi:10.3390/biomedicines10071701
20. Ener K, Keske M, Aldemir M, et al. Evaluation of oxidative stress status and antioxidant capacity in patients with painful bladder syndrome/interstitial cystitis: preliminary results of a randomised study. Int Urol Nephrol. 2015;47:1297–1302. doi:10.1007/s11255-015-1021-1
21. Gao Q, Zhao Y, Luo R, et al. Intrathecal umbilical cord mesenchymal stem cells injection alleviates neuroinflammation and oxidative stress in the cyclophosphamide-induced interstitial cystitis rats through the Sirt1/Nrf2/HO-1 pathway. Life Sci. 2023;331:122045. doi:10.1016/j.lfs.2023.122045
22. He Y-Q, Zhang W-T, Shi C-H, et al. Phloroglucinol protects the urinary bladder via inhibition of oxidative stress and inflammation in a rat model of cyclophosphamide-induced interstitial cystitis. Chin Med J. 2015;128(7):956–962. doi:10.4103/0366-6999.154316
23. Frossi B, De Carli M, Daniel KC, et al. Oxidative stress stimulates IL‐4 and IL‐6 production in mast cells by an APE/Ref‐1‐dependent pathway. Eur J Immunol. 2003;33:2168–2177. doi:10.1002/eji.200323995
24. Chelombitko MA, Fedorov AV, Ilyinskaya OP, et al. Role of reactive oxygen species in mast cell degranulation. Biochem Moscow. 2016;81:1564–1577. doi:10.1134/S000629791612018X
25. Suzuki Y, Yoshimaru T, Inoue T, et al. Role of oxidants in mast cell activation. Chem Immunol Allergy. 2005;87:32–42.
26. Salazar VS, Gamer LW, Rosen V. BMP signalling in skeletal development, disease and repair. Nat Rev Endocrinol. 2016;12:203–221. doi:10.1038/nrendo.2016.12
27. Takino T, Koshikawa N, Miyamori H, et al. Cleavage of metastasis suppressor gene product KiSS-1 protein/metastin by matrix metalloproteinases. Oncogene. 2003;22:4617–4626. doi:10.1038/sj.onc.1206542
28. Cirino G, Fiorucci S, Sessa WC. Endothelial nitric oxide synthase: the Cinderella of inflammation? Trends Pharmacol Sci. 2003;24:91–95. doi:10.1016/S0165-6147(02)00049-4
29. Kanehisa M, Tanabe M, Furumichi M, et al. KEGG: new perspectives on genomes, pathways, diseases and drugs. Nucleic Acids Res. 2017;45:D353–D361. doi:10.1093/nar/gkw1092
30. Ashburner M, Ball CA, Blake JA, et al. Gene Ontology: tool for the unification of biology. Nat Genet. 2000;25:25–29. doi:10.1038/75556
31. Mering CV. STRING: a database of predicted functional associations between proteins. Nucleic Acids Res. 2003;31:258–261. doi:10.1093/nar/gkg034
32. Shannon P, Markiel A, Ozier O, et al. Cytoscape: a software environment for integrated models of biomolecular interaction networks. Genome Res. 2003;13:2498–2504. doi:10.1101/gr.1239303
33. Warde-Farley D, Donaldson SL, Comes O, et al. The GeneMANIA prediction server: biological network integration for gene prioritization and predicting gene function. Nucleic Acids Res. 2010;38:W214–W220. doi:10.1093/nar/gkq537
34. Xia J, Gill EE, Hancock REW. NetworkAnalyst for statistical, visual and network-based meta-analysis of gene expression data. Nat Protoc. 2015;10:823–844. doi:10.1038/nprot.2015.052
35. Castro-Mondragon JA, Riudavets-Puig R, Rauluseviciute I, et al. JASPAR 2022: the 9th release of the open-access database of transcription factor binding profiles. Nucleic Acids Res. 2022;50:D165–D173. doi:10.1093/nar/gkab1113
36. Chou C-H, Shrestha S, Yang C-D, et al. miRTarBase update 2018: a resource for experimentally validated microRNA-target interactions. Nucleic Acids Res. 2018;46(D1):D296–D302. doi:10.1093/nar/gkx1067
37. Piñero J, Bravo À, Queralt-Rosinach N, et al. DisGeNET: a comprehensive platform integrating information on human disease-associated genes and variants. Nucleic Acids Res. 2017;45:D833–D839. doi:10.1093/nar/gkw943
38. Shi Y, Ying X, Yang J. Deep unsupervised domain adaptation with time series sensor data: a survey. Sensors. 2022;22:5507. doi:10.3390/s22155507
39. Park SY. Nomogram: an analogue tool to deliver digital knowledge. J Thoracic Cardiovasc Surg. 2018;155:1793. doi:10.1016/j.jtcvs.2017.12.107
40. Van Calster B, Wynants L, Verbeek JFM, et al. Reporting and interpreting decision curve analysis: a guide for investigators. Europ Urol. 2018;74:796–804. doi:10.1016/j.eururo.2018.08.038
41. Subramanian A, Tamayo P, Mootha VK, et al. Gene set enrichment analysis: a knowledge-based approach for interpreting genome-wide expression profiles. Proc Natl Acad Sci USA. 2005;102:15545–15550. doi:10.1073/pnas.0506580102
42. Newman AM, Liu CL, Green MR, et al. Robust enumeration of cell subsets from tissue expression profiles. Nat Methods. 2015;12(5):453–457. doi:10.1038/nmeth.3337
43. Yoo M, Shin J, Kim J, et al. DSigDB: drug signatures database for gene set analysis. Bioinformatics. 2015;31:3069–3071. doi:10.1093/bioinformatics/btv313
44. Kuleshov MV, Jones MR, Rouillard AD, et al. Enrichr: a comprehensive gene set enrichment analysis web server 2016 update. Nucleic Acids Res. 2016;44:W90–W97. doi:10.1093/nar/gkw377
45. Batler RA, Sengupta S, Forrestal SG, et al. Mast cell activation triggers a urothelial inflammatory response mediated by tumor necrosis factor-alpha. J Urol. 2002;168:819–825. doi:10.1016/S0022-5347(05)64750-7
46. Kuret T, Peskar D, Kreft ME, et al. Comprehensive transcriptome profiling of urothelial cells following TNFα stimulation in an in vitro interstitial cystitis/bladder pain syndrome model. Front Immunol. 2022;13:960667. doi:10.3389/fimmu.2022.960667
47. Rooney P, Srivastava A, Watson L, et al. Hyaluronic acid decreases IL-6 and IL-8 secretion and permeability in an inflammatory model of interstitial cystitis. Acta Biomater. 2015;19:66–75. doi:10.1016/j.actbio.2015.02.030
48. Rooney P, Ryan C, McDermott BJ, et al. Effect of glycosaminoglycan replacement on markers of interstitial cystitis in vitro. Front Pharmacol. 2020;11:575043. doi:10.3389/fphar.2020.575043
49. Wang X, Fan L, Yin H, et al. Protective effect of Aster tataricus extract on NLRP3‐mediated pyroptosis of bladder urothelial cells. J Cell Mol Med. 2020;24:13336–13345. doi:10.1111/jcmm.15952
50. Jin X-W, Wang Q-Z, Zhao Y, et al. An experimental model of the epithelial to mesenchymal transition and pro-fibrogenesis in urothelial cells related to bladder pain syndrome/interstitial cystitis. Transl Androl Urol. 2021;10:4120–4131. doi:10.21037/tau-21-392
51. Augé C, Gamé X, Vergnolle N, et al. Characterization and validation of a chronic model of cyclophosphamide-induced interstitial cystitis/bladder pain syndrome in rats. Front Pharmacol. 2020;11:1305. doi:10.3389/fphar.2020.01305
52. Tay C, Grundy L. Animal models of interstitial cystitis/bladder pain syndrome. Front Physiol. 2023;14:1232017. doi:10.3389/fphys.2023.1232017
53. Goldstein HB, Safaeian P, Garrod K, et al. Depression, abuse and its relationship to interstitial cystitis. Int Urogynecol J. 2008;19:1683–1686. doi:10.1007/s00192-008-0712-x
54. Watkins KE, Eberhart N, Hilton L, et al. Depressive disorders and panic attacks in women with bladder pain syndrome/interstitial cystitis: a population-based sample. General Hospital Psychiatry. 2011;33:143–149. doi:10.1016/j.genhosppsych.2011.01.004
55. Keller JJ, Liu S, Lin H. Increased risk of depressive disorder following diagnosis with bladder pain syndrome/interstitial cystitis. Neurourol Urodynamics. 2013;32:467–471. doi:10.1002/nau.22316
56. Parsons CL. The role of a leaky epithelium and potassium in the generation of bladder symptoms in interstitial cystitis/overactive bladder, urethral syndrome, prostatitis and gynaecological chronic pelvic pain. BJU Int. 2011;107:370–375. doi:10.1111/j.1464-410X.2010.09843.x
57. Jiang Y-H, Jhang J-F, Hsu Y-H, et al. Usefulness of urinary biomarkers for assessing bladder condition and histopathology in patients with interstitial cystitis/bladder pain syndrome. IJMS. 2022;23:12044. doi:10.3390/ijms231912044
58. Cosentino F, Hurlimann D, Delli Gatti C, et al. Chronic treatment with tetrahydrobiopterin reverses endothelial dysfunction and oxidative stress in hypercholesterolaemia. Heart. 2007;94:487–492. doi:10.1136/hrt.2007.122184
59. Pierce GL, Lesniewski LA, Lawson BR, et al. Nuclear factor-{kappa}B activation contributes to vascular endothelial dysfunction via oxidative stress in overweight/obese middle-aged and older humans. Circulation. 2009;119:1284–1292. doi:10.1161/CIRCULATIONAHA.108.804294
60. Lin AM, Rubin CJ, Khandpur R, et al. Mast cells and neutrophils release IL-17 through extracellular trap formation in psoriasis. J Immunol. 2011;187:490–500. doi:10.4049/jimmunol.1100123
61. Lock C, Hermans G, Pedotti R, et al. Gene-microarray analysis of multiple sclerosis lesions yields new targets validated in autoimmune encephalomyelitis. Nat Med. 2002;8:500–508. doi:10.1038/nm0502-500
62. Hueber AJ, Asquith DL, Miller AM, et al. Mast cells express IL-17A in rheumatoid arthritis synovium. J Immunol. 2010;184:3336–3340. doi:10.4049/jimmunol.0903566
63. Kobayashi T, Okamoto S, Hisamatsu T, et al. IL23 differentially regulates the Th1/Th17 balance in ulcerative colitis and Crohn’s disease. Gut. 2008;57:1682–1689. doi:10.1136/gut.2007.135053
64. Kolls JK, McCray PB, Chan YR. Cytokine-mediated regulation of antimicrobial proteins. Nat Rev Immunol. 2008;8:829–835. doi:10.1038/nri2433
65. Fossiez F, Djossou O, Chomarat P, et al. T cell interleukin-17 induces stromal cells to produce proinflammatory and hematopoietic cytokines. J Exp Med. 1996;183:2593–2603. doi:10.1084/jem.183.6.2593
66. Miossec P, Kolls JK. Targeting IL-17 and TH17 cells in chronic inflammation. Nat Rev Drug Discov. 2012;11:763–776.
67. Wang G, Wang J, Fan X, et al. Protein adducts of malondialdehyde and 4-hydroxynonenal contribute to trichloroethene-mediated autoimmunity via activating Th17 cells: dose– and time–response studies in female MRL+/+ mice. Toxicology. 2012;292:113–122.
68. Arai T, Fuse M, Goto Y, et al. Molecular pathogenesis of interstitial cystitis based on microRNA expression signature: miR-320 family-regulated molecular pathways and targets. J Hum Genet. 2018;63:543–554.
69. Wang L, Yuan L. Analysis of ginseng in the treatment of interstitial cystitis/bladder pain syndrome based on network pharmacology. Eur Rev Med Pharmacol Sci. 2022;26:4709–4720.
70. Dai R, Ahmed SA. MicroRNA, a new paradigm for understanding immunoregulation, inflammation, and autoimmune diseases. Transl Res. 2011;157:163–179.
71. Tomankova T, Petrek M, Gallo J, et al. MicroRNAs: emerging regulators of immune‐mediated diseases. Scand J Immunol. 2012;75:129–141. doi:10.1111/j.1365-3083.2011.02650.x
72. Mandal M, Rakib A, Kiran S, et al. Inhibition of microRNA-34c reduces detrusor ROCK2 expression and urinary bladder inflammation in experimental cystitis. Life Sci. 2024;336:122317. doi:10.1016/j.lfs.2023.122317
73. Deckmann K, Filipski K, Krasteva-Christ G, et al. Bitter triggers acetylcholine release from polymodal urethral chemosensory cells and bladder reflexes. Proc Natl Acad Sci USA. 2014;111:8287–8292. doi:10.1073/pnas.1402436111
74. Kullmann FA, Chang HH, Gauthier C, et al. Serotonergic paraneurones in the female mouse urethral epithelium and their potential role in peripheral sensory information processing. Acta Physiol. 2018;222:e12919.
75. Ding L-Z, Teng X, Zhang Z-B, et al. Mangiferin inhibits apoptosis and oxidative stress via BMP2/Smad-1 signaling in dexamethasone-induced MC3T3-E1 cells. Int J Mol Med. 2018;41:2517–2526. doi:10.3892/ijmm.2018.3506
76. Ram M, Sherer Y, Shoenfeld Y. Matrix metalloproteinase-9 and autoimmune diseases. J Clin Immunol. 2006;26:299–307. doi:10.1007/s10875-006-9022-6
77. Chen Y-T, Yang -C-C, Sun C-K, et al. Extracorporeal shock wave therapy ameliorates cyclophosphamide-induced rat acute interstitial cystitis though inhibiting inflammation and oxidative stress-in vitro and in vivo experiment studies. Am J Transl Res. 2014;6:631–648.
78. Chen Y, Chiang H, Chen C, et al. Melatonin treatment further improves adipose‐derived mesenchymal stem cell therapy for acute interstitial cystitis in rat. J Pineal Res. 2014;57:248–261.
79. Xiao Y, Lian H, Zhong XS, et al. Matrix metalloproteinase 7 contributes to intestinal barrier dysfunction by degrading tight junction protein Claudin-7. Front Immunol. 2022;13:1020902. doi:10.3389/fimmu.2022.1020902
80. Liu X, Su P, Meng S, et al. Role of matrix metalloproteinase-2/9 (MMP2/9) in lead-induced changes in an in vitro blood-brain barrier model. Int J Biol Sci. 2017;13:1351–1360. doi:10.7150/ijbs.20670
81. Liddle RA. Cholecystokinin cells. Annu Rev Physiol. 1997;59(1):221–242. doi:10.1146/annurev.physiol.59.1.221
82. Jhang J-F, Hsu Y-H, Kuo H-C. Urothelial functional protein and sensory receptors in patients with interstitial cystitis/bladder pain syndrome with and without hunner’s lesion. Urology. 2016;98:44–49. doi:10.1016/j.urology.2016.08.029
83. Duda DG, Fukumura D, Jain RK. Role of eNOS in neovascularization: NO for endothelial progenitor cells. Trends Mol Med. 2004;10:143–145. doi:10.1016/j.molmed.2004.02.001
84. Mumtaz FH, Khan MA, Thompson CS, et al. Nitric oxide in the lower urinary tract: physiological and pathological implications. BJU Int. 2000;85:567–578. doi:10.1046/j.1464-410x.2000.00459.x
85. Souza-Fiho MV, Lima MV, Pompeu MM, et al. Involvement of nitric oxide in the pathogenesis of cyclophosphamide-induced hemorrhagic cystitis. Am J Pathol. 1997;150:247–256.
86. MacDermott JP, Miller CH, Levy N, et al. Cellular immunity in interstitial cystitis. J Urol. 1991;145(2):274–278. doi:10.1016/S0022-5347(17)38313-1
87. Sun L, Su Y, Jiao A, et al. T cells in health and disease. Sig Transduct Target Ther. 2023;8:235.
88. Su F, Zhang W, Meng L, et al. Multimodal single‐cell analyses outline the immune microenvironment and therapeutic effectors of interstitial cystitis/bladder pain syndrome. Adv Sci. 2022;9:2106063. doi:10.1002/advs.202106063
89. Klion AD, Ackerman SJ, Bochner BS. Contributions of eosinophils to human health and disease. Annu Rev Pathol Mech Dis. 2020;15:179–209. doi:10.1146/annurev-pathmechdis-012419-032756
90. Jacobsen EA, Helmers RA, Lee JJ, et al. The expanding role(s) of eosinophils in health and disease. Blood. 2012;120:3882–3890. doi:10.1182/blood-2012-06-330845
91. Yamada T, Murayama T, Mita H, et al. Alternate occurrence of allergic disease and an unusual form of interstitial cystitis. Int J Urol. 1998;5:329–336. doi:10.1111/j.1442-2042.1998.tb00360.x
92. Bouchelouche K, Kristensen B, Nordling J, et al. Increased urinary leukotriene E4 and eosinophil protein X excretion in patients with interstitial cystitis. J Urol. 2001;166:2121–2125. doi:10.1016/S0022-5347(05)65518-8
93. Daynes RA, Jones DC. Emerging roles of PPARS in inflammation and immunity. Nat Rev Immunol. 2002;2:748–759. doi:10.1038/nri912
94. Kauppinen A, Suuronen T, Ojala J, et al. Antagonistic crosstalk between NF-κB and SIRT1 in the regulation of inflammation and metabolic disorders. Cell Signalling. 2013;25:1939–1948. doi:10.1016/j.cellsig.2013.06.007
95. Kuret T, Kreft ME, Romih R, et al. Cannabidiol as a promising therapeutic option in IC/BPS: in vitro evaluation of its protective effects against inflammation and oxidative stress. IJMS. 2023;24:5055. doi:10.3390/ijms24055055
96. Okine BN, Gaspar JC, Finn DP. PPARs and pain. Br J Pharmacol. 2019;176:1421–1442. doi:10.1111/bph.14339
97. Huang X, Kong G, Li Y, et al. Decitabine and 5-azacitidine both alleviate LPS induced ARDS through anti-inflammatory/antioxidant activity and protection of glycocalyx and inhibition of MAPK pathways in mice. Biomed Pharmacother. 2016;84:447–453. doi:10.1016/j.biopha.2016.09.072
98. Su C, Liu S, Ma X, et al. Decitabine attenuates dextran sodium sulfate‑induced ulcerative colitis through regulation of immune regulatory cells and intestinal barrier. Int J Mol Med. 2020;46:583–594. doi:10.3892/ijmm.2020.4605
 © 2025 The Author(s). This work is published and licensed by Dove Medical Press Limited. The
full terms of this license are available at https://www.dovepress.com/terms.php
and incorporate the Creative Commons Attribution
- Non Commercial (unported, 4.0) License.
By accessing the work you hereby accept the Terms. Non-commercial uses of the work are permitted
without any further permission from Dove Medical Press Limited, provided the work is properly
attributed. For permission for commercial use of this work, please see paragraphs 4.2 and 5 of our Terms.
© 2025 The Author(s). This work is published and licensed by Dove Medical Press Limited. The
full terms of this license are available at https://www.dovepress.com/terms.php
and incorporate the Creative Commons Attribution
- Non Commercial (unported, 4.0) License.
By accessing the work you hereby accept the Terms. Non-commercial uses of the work are permitted
without any further permission from Dove Medical Press Limited, provided the work is properly
attributed. For permission for commercial use of this work, please see paragraphs 4.2 and 5 of our Terms.