")
Back to Journals » Journal of Inflammation Research » Volume 17
Identification and Validation of Senescence-Related Signature by Combining Single Cell and Bulk Transcriptome Data Analysis to Predict the Prognosis and Identify the Key Gene CAV1 in Pancreatic Cancer
Authors Chen L, Ying X, Wang H, Xie J, Tang Q, Liu W
Received 3 August 2024
Accepted for publication 15 November 2024
Published 22 November 2024 Volume 2024:17 Pages 9391—9406
DOI https://doi.org/10.2147/JIR.S489985
Checked for plagiarism Yes
Review by Single anonymous peer review
Peer reviewer comments 2
Editor who approved publication: Professor Ning Quan
Liang Chen,1,* Xiaomei Ying,2,* Haohao Wang,1,* Jiaheng Xie,3,* Qikai Tang,4 Wen Liu1
1Department of Hepatobiliary and Pancreatic Surgery, Conversion Therapy Center for Hepatobiliary and Pancreatic Tumors, First Hospital of Jiaxing, Affiliated Hospital of Jiaxing University, Jiaxing, Zhejiang, People’s Republic of China; 2Department of General Surgery, Suzhou Hospital of Anhui Medical University, Suzhou, Anhui, People’s Republic of China; 3Department of Plastic and Cosmetic Surgery, Xiangya Hospital, Central South University, Changsha, Hunan Province, 410008, People’s Republic of China; 4Nanjing Jinling Hospital, Affiliated Hospital of Medical School, Nanjing University, Nanjing, Jiangsu, People’s Republic of China
*These authors contributed equally to this work
Correspondence: Wen Liu, Department of Hepatobiliary and Pancreatic Surgery, Conversion therapy center for Hepatobiliary and Pancreatic Tumors, First Hospital of Jiaxing, Affiliated Hospital of Jiaxing University, Jiaxing, Zhejiang, People’s Republic of China, Email [email protected]
Background: The role of cellular senescence in the tumor microenvironment of pancreatic cancer (PC) remains unclear, particularly regarding its impact on prognosis and immunotherapy outcomes.
Methods: We utilized single-cell sequencing datasets (GSE155698 and GSE154778) for pancreatic cancer from the Gene Expression Omnibus (GEO) database and bulk RNA-seq data from the University of California, Santa Cruz (UCSC) and International Cancer Genome Consortium (ICGC) repositories, creating three patient cohorts: The Cancer Genome Atlas (TCGA) cohort, PAAD-AU cohort, and PAAD-CA cohort. Dimensionality reduction cluster analysis processed the single-cell data, while weighted gene co-expression network analysis (WGCNA) and differential expression gene analysis were applied to bulk RNA-seq data. Prognostic models were developed using Cox proportional hazards (COX) and least absolute shrinkage and selection operator (LASSO) regression, with validation through survival analysis, decision curve analysis, and principal component analysis (PCA). Tumor mutation data were analyzed using the “maftools” package, and the immune microenvironment was assessed with TIMER2 data.
Results: We developed a senescence-related (SENR) six-gene prognostic signature for PC, which stratifies patients by risk, with high-risk groups showing poorer prognoses. This model also offers predictive insights into tumor mutations and immune microenvironment characteristics. Caveolin-1 (CAV1) emerged as a significant prognostic biomarker, with functional validation showing its role in promoting cancer cell proliferation and migration, highlighting its potential as a therapeutic target.
Conclusion: This study provides a novel senescence-related prognostic tool for PC, enhancing patient stratification for prognosis and immunotherapy, and identifies CAV1 as a key gene with clinical significance for targeted interventions.
Keywords: pancreatic cancer, cellular senescence, prognosis, biomarker, immunotherapy
Introduction
Pancreatic cancer poses a significant challenge within the field of oncology.1 Due to its subtle onset, aggressive behavior, and frequent late-stage detection, it becomes a formidable adversary, causing patients and healthcare providers to grapple with its complexities.2–5 Although pancreatic cancer is relatively uncommon, it exhibits a high mortality rate, ranking 12th among global cancer cases, with approximately 495,000 new instances and 466,000 annual fatalities.6 Predominantly affecting older adults, the majority of diagnoses occur in individuals aged 65 and older.7 Regional variations in incidence are notable, with elevated rates in North America and Europe.
The diagnostic process for pancreatic cancer typically encompasses a combination of imaging tests, including CT scans, MRI, and endoscopic ultrasound (EUS), to visualize the pancreas and evaluate tumor size and location.8–10 Blood tests, like CA 19–9, may serve as tumor markers.10 Ultimately, confirmation of the diagnosis often necessitates a biopsy, obtainable through endoscopic or surgical procedures.11 Treatment modalities for pancreatic cancer hinge on the disease’s stage.12 Surgery stands as the primary curative option for localized tumors, yet many cases receive diagnoses at advanced stages when surgery is unviable.13 In such scenarios, treatment options encompass chemotherapy, radiation therapy, targeted therapy, and immunotherapy.14 Palliative care frequently enters the picture to manage symptoms and enhance the quality of life for patients with advanced-stage disease.15 Therefore, addressing the treatment quandary of pancreatic cancer underscores the need to devise novel prognostic stratification strategies and explore potential biomarkers within its tumor microenvironment.
Cell senescence denotes a condition characterized by a stable and irreversible halt in the cell cycle, resulting in a loss of the cell’s capacity for division and replication.16 Dr. Leonard Hayflick initially elucidated this phenomenon during the 1960s, and it has since become a pivotal concept in the realm of biology, particularly in the context of senescence and cancer.17 In the context of tumors, cell senescence carries a dual significance. On one hand, it operates as an initial defense mechanism, effectively arresting the proliferation of impaired cells and erecting a barrier against cancer development.18 This process, known as oncogene-induced senescence (OIS), thwarts the transformation of normal cells into malignant counterparts.19 Conversely, senescent cells present within a tumor can stimulate tumor progression by releasing a pro-inflammatory mixture termed the senescence-associated secretory phenotype (SASP). This secretion can foster an environment conducive to tumor expansion, angiogenesis, tissue remodeling, and evasion of the immune system.20 Consequently, the role of cell senescence within tumors manifests as intricate and context-dependent, exerting influence on both tumor suppression and promotion.
In our research, we integrated single-cell sequencing data with bulk transcriptome sequencing data to investigate the diversity and expression patterns of genes associated with cell senescence in pancreatic cancer. Additionally, we developed a prognostic model that is pertinent to assess the outlook for individuals diagnosed with pancreatic cancer. Our study offers valuable insights that can serve as a reference point for early detection and prognosis evaluation in pancreatic cancer cases.
Materials and Methods
Single Cell Sequencing Data Download and Processing
The GEO database houses numerous single-cell sequencing datasets. Specifically, we downloaded the single cell sequencing datasets GSE155698 and GSE154778, which are related to pancreatic cancer.21,22 GSE155698 comprises 17 tumor samples and 3 normal tissue samples, while GSE154778 encompasses 16 tumor samples (Supplemental Table 1).21,22 For processing and analyzing these single-cell data, we utilized the “Seurat” package, version 4.3.0.1. Quality control measures were implemented as follows:Genes expressed in fewer than 3 cells were excluded; Cells with less than 200 gene expressions and those with over 9000 gene expressions were removed; Cells with mitochondrial gene expression exceeding 15% were excluded; Cells with a total gene expression surpassing 200,000 were removed; Samples with fewer than 200 cells were excluded.
To standardize the data, the “NormalizeData” function was employed. Highly variable genes, set at 3000, were identified using the “vst” method. The “SCT” method was utilized to integrate samples and eliminate mitochondrial genes and cell cycle effects. To reduce data dimensionality, PCA analysis was initially conducted. Subsequently, we employed the “tSNE” method with a dimensionality reduction setting of 20. For cell clustering, the “KNN” method was employed, setting dimensions to 20, resolution to 0.4, and random. seed to 2023. Cell annotations were based on marker genes obtained from previously published pancreatic cancer single-cell sequencing articles. Results of single cell analysis were visualized using a “tsne” chart. Additionally, the “Seurat” package’s “FindMarkers” function was used to analyze differences between the two groups. In this study, the “PercentageFeatureSet” function was utilized to calculate the cell senescence score based on the expression of cell senescence phenotype genes in cells.
Bulk Transcriptome Data Download and Processing
Three cohorts related to pancreatic cancer were acquired, encompassing not only transcriptome data but also clinical data. The TCGA transcriptome data was sourced from the UCSC Xena website (https://xenabrowser.net/).23 Meanwhile, the PAAD-AU and PAAD-CA transcriptome data were retrieved from the ICGC website (https://dcc.icgc.org/) (Supplemental Tables 2 and 3). To ensure uniformity, all data underwent standardization. Samples that included both transcriptome data and clinical information were retained by aligning transcriptome data with clinical data.
Acquisition of Cell Senescence-Related Gene Sets
The 125 cell senescence-related genes were collected in the published article titled “a new gene set identifies senescent cells and predicts senescence-associated pathways across tissues”.24
Single Sample Gene Set Enrichment Analysis (ssGSEA)
Based on the difference values obtained through the GSEA R package analysis, the order, arranged from large to small, was utilized to depict the fold change pattern of gene set expression between the two groups. Typically, when a gene set is enriched towards the top, it indicates up-regulation, while enrichment towards the bottom suggests down-regulation. For this analysis, the “clusterProfiler” package was employed, and it utilized the reference gene set “H.ARI.v7.0.entrez.GMT” to perform these assessments.
Weighted Co-Expression Network Analysis (WGCNA)
In this research, WGCNA (Weighted Gene Co-Expression Network Analysis) was employed to investigate gene sets closely associated with cell senescence phenotypes in pancreatic cancer. The soft threshold was explored across a range, specifically from 1 to 10 with a step size of 1, as well as from 12 to 20 with a step size of 2. To determine the appropriate soft threshold, the “WGCNA” package’s “pickSoftThreshold” function was utilized. Several parameters were set for the analysis: a minimum of 200 genes per module, “deepSplit” was set to 2 for enhanced clustering, and genes were organized into modules. To consolidate modules that exhibited similarity, this study applied a cut-off value of 0.3 and correlated them with cell senescence phenotypes.
Unsupervised Consistent Cluster Analysis
The “ConsensusClusterPlus” package was used to perform cluster analysis based on the expression pattern of cell senescence genes. The maximum cluster number was set to 7, clusterAlg = “hc”, innerLinkage = “average”, finalLinkage = “average”.
Construction of the Prognostic Signature
Within the TCGA cohort, the initial step involved utilizing Univariate COX regression to perform an initial screening of prognostic genes, with a significance threshold of p<0.05. Following this, LASSO regression was employed to further filter variables and construct a prognostic signature. The “glmnet” R package was utilized for this purpose, and the “maxit” parameter was set to 1000. Patients were subsequently categorized into two groups based on the median senescence signature risk score (SENRs) values, resulting in a high SENRs group and a low SENRs group. Prognostic analysis, decision curve analysis, and PCA (Principal Component Analysis) were then conducted separately for these two groups to explore their prognostic implications and assess the decision-making utility of the model.
Validation of the Prognostic Signature
PAAD-AU and PAAD-CA cohorts as validation cohort. Patients were also divided into high SENRs group and low SENRs group based on the median SENRs value. In the validation cohort, prognostic analysis, decision curve analysis and PCA analysis of high and low SENRs groups were explored.
Tumor Mutation Analysis
The “maftools” package was used to download mutation data for pancreatic cancer. By matching, samples containing both transcriptome and mutation data are retained, and a waterfall map is used to show the mutant landscape.
Immunomicroenvironment Correlation Analysis
We got through TIMER2 website (http://timer.cistrome.org/) to download a variety of methods based on the TCGA data to calculate the immune cells infiltrating data, and use the waterfall figure to show results. The expression of immune checkpoint genes, tumor necrosis genes, and leukocyte antigen genes was investigated among model groups. The “estimate” package was used to calculate the sample immunity score. In this study, the TIDE website was used to predict the immunotherapy effect of the sample as well as the TIDE score.
Pseudo-Time Series Analysis
Pseudo-time series analysis is the use of specific algorithms to analyze changes in gene expression during cell differentiation state transitions, which in turn place each cell in the appropriate position in the trajectory. In this study, the “monocle2” package was used to perform pseudo-time series analysis and explore the changes in the expression of specific genes during this differentiation process.
Clinical Correlation Analysis
The “meta” package was used for the integrated analysis. The “rpart” package was used to perform decision curve analysis based on patient clinical data and models, and was divided into different groups. In this study, the “regplot” package was used to plot nomogram based on patient data. The STRING web site (https://cn.string-db.org/) was used for protein interaction analysis.
Cell Lines, Culture Conditions and Cell Transfection
Capan-1 and PANC-1 cells were procured from the Shanghai Institute of Biological Sciences in Shanghai, China. These cells were cultured in DMEM (Dulbecco’s Modified Eagle Medium) supplemented with 10% fetal bovine serum (FBS) and 1% penicillin-streptomycin solution. All cell cultures were maintained at a temperature of 37°C and in an environment containing 5% CO2. For transfection, Lipofectamine 3000 from Thermo Fisher Scientific in Waltham, MA, USA was employed. Cells were transfected with siRNA (RiboBio, Guangzhou, China) following the manufacturer’s instructions. Three target siRNAs were used for CAV1, which included:siCAV1-1: 5’-CCACCTTCACTGTGACGAA-3’; siCAV1-2: 5’-GCACATCTGGGCAGTTGTA-3’ siCAV1-3: 5’-GCGACCCTAAACACCCAA-3’. These siRNAs were utilized for gene knockdown experiments.
CCK-8 Assay, Colony Formation Analysis, Migration Assays
These experimental methods have been reported in our previous studies.25
PCR Tests of CAV1 in Clinical Samples
For this study, 8 pancreatic cancer tissues and corresponding adjacent control tissues were obtained. Total RNA extraction from cell lines followed the manufacturer’s protocol, employing TRIzol reagents (Invitrogen, CA, USA). Subsequently, cDNA synthesis was conducted with the PrimeScript RT Reagent Kit (Takara, Nanjing, China). Real-time quantitative PCR (qRT-PCR) was carried out using AceQ Universal SYBR qPCR Master Mix (Vazyme, Nanjing, China). The primers utilized in this investigation are detailed below:
Forward primerGGGTGTGGAAACCTCGTCTT
Reverse primerGGTGTAGAGATGTCCCTGCG
Statistical Analysis
The initial step in the prognostic gene screening involved conducting univariate COX analysis. To compare gene expression between the two groups of the model, a rank sum test was employed. Prognostic analysis between these two groups was executed using the KM (Kaplan-Meier) survival curve method. To analyze the correlation between model values, specifically SENRs, and TIDE values, the “spearman” method was applied. The analysis was conducted using R software version 4.0.5, with a defined p-value as the significance threshold. A p-value less than 0.05 was considered statistically significant.
Results
Cell Senescence Analysis at the Single-Cell Level
The research process is shown in Figure 1.
 |
Figure 1 The flow chart. |
Cell senescence phenotypes were investigated at the single-cell level in pancreatic cancer. As shown in Figure 2A–B, through quality control and sample integration, a total of 29 tumor and 3 normal samples were retained, and there was heterogeneity between tumor and normal samples. As shown in Figure 2C–E, tumor samples were clustered into 19 clusters, and a total of 11 cell types were annotated according to the expression of cell type marker genes. Subsequently, the cell senescence phenotype fraction was quantified in each cell, and this group was divided into High-Senescence group and Low-Senescence group according to the median value, as shown in Figure 2F. The High-Senescence group was mainly distributed in Monocytes, Macrophages, Granulocytes and Fibroblastes. As shown in Figure 2G, the 10 genes closely related to cell senescence are RPS8, RPL11, RPL22, UQCRH, TACSTD2, CAPZB, NFRSR1B,C1QA, MXRA8 and C1QC. As shown in Figure 2H–L, activation pathways associated with cell senescence in pancreatic cancer include Apoptosis, Epithelial Mesenchymal Transition, Hypoxia, Inflammatory Response and TGF Beta. We compared the expression of senescence related genes in pancreatic cancer with normal tissues at the single-cell level, and the results are shown in Figure S1.
 |
Figure 2 Single cell sequencing analysis. (A and B) Quality control and sample integration. (C) All cells were clustered into 19 clusters. (D) Markers for cell clustering. (E) Annotation on cell types. (F) All cells were divided into high and low groups according to senescence score. (G) Analysis of differentially expressed genes between high - and low-senescence groups, in the form of volcano map. (H–L)GSEA between high and low groups showed that activation pathways associated with cell senescence in pancreatic cancer include Apoptosis, Epithelial Mesenchymal Transition, Hypoxia, Inflammatory Response and TGF Beta. |
To Search for Genes Closely Related to Cell Senescence
In pancreatic cancer, a variety of methods were used in this study to obtain genes associated with cellular senescence. First, WGCNA was conducted in the TCGA cohort. As shown in Figure 3A, when the optimal soft threshold is 7, the data conforms to the power-law distribution, and Mean connectivity tends to be stable with the increase of the soft threshold. As shown in Figure 3B–C, the genes were clustered into 9 non-gray modules, of which the green module was most associated with the cell senescence phenotype (cor = 0.53 and p <0.05). We further explored the inter-gene correlation in the green module, as shown in Figure 3D. There was a positive correlation between Module membership in green module and Gene significance for body weight (cor = 0.64 and p <0.05). As shown in Figure 3E–F, patients are divided into two clusters according to cell senescence genes, and Cluster2 patients have poor prognosis (p<0.05), as shown in Figure 3G. Differential expressed gene analysis was carried out through package DEseq2 and screening criteria were set |LogFC| >1 and adjust p-value<0.05. A total of 6300 genes were obtained. As shown in Figure 3H, the intersection of 6295 genes related to cell senescence obtained by single-cell analysis, 1441 genes obtained by WGCNA analysis, and 6300 genes obtained by differential expressed gene analysis yielded 303 genes closely related to cell senescence.
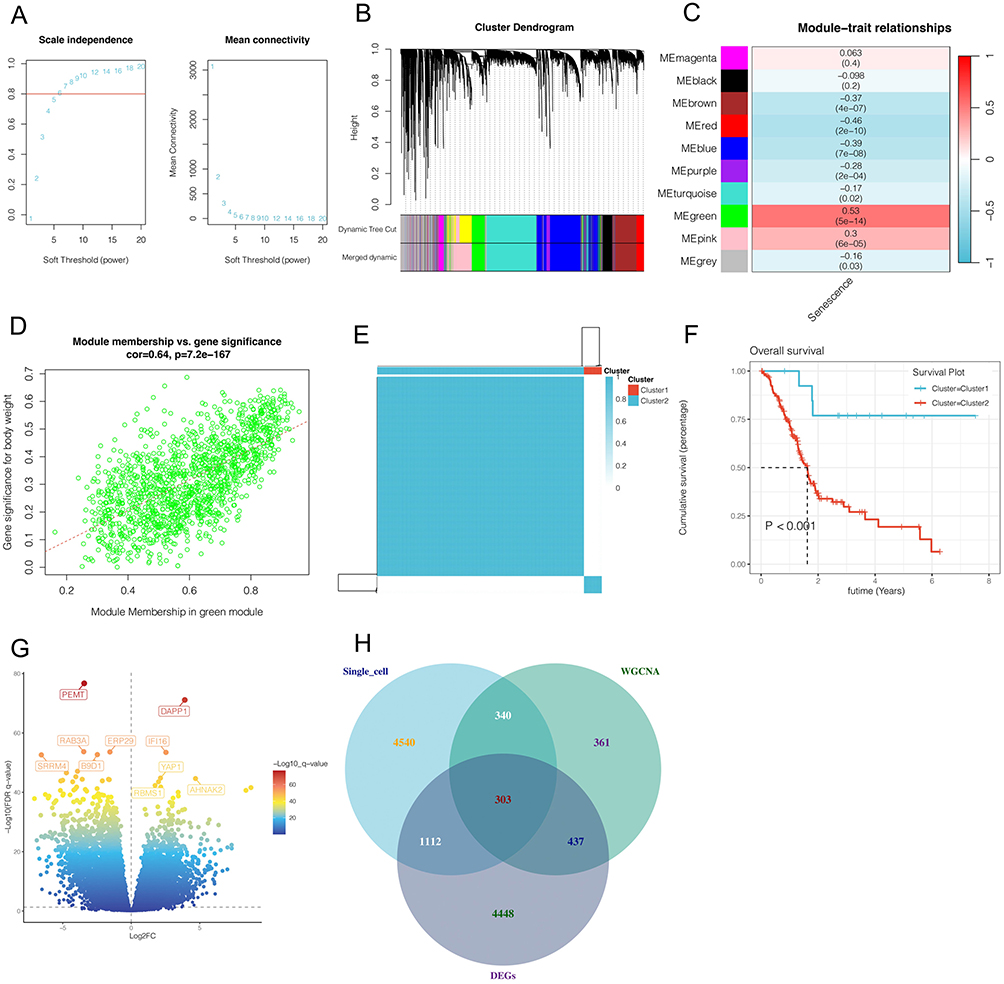 |
Figure 3 Bulk RNA sequencing analysis. (A–D) Weighted coexpression network analysis(WGCNA). The green module was found to be most significantly associated with senescence phenotypes in pancreatic cancer. (E–F) Unsupervised clustering according to cell senescence genes showed that cluster2 had significantly worse prognosis. (G)Differential expressed gene analysis. A total of 6300 genes were obtained. (H) The intersection of 6295 genes related to cell senescence obtained by single-cell analysis, 1441 genes obtained by WGCNA analysis, and 6300 genes obtained by differential expressed gene analysis. |
The Construction and Validation of the Prognostic Model
Starting with the 303 genes identified through the intersection of single-cell analysis, Weighted Gene Co-expression Network Analysis (WGCNA), and differential expression analysis, we aimed to narrow down this gene set to those most relevant for prognosis. To achieve this, we first conducted univariate Cox regression analysis on the TCGA cohort, setting a significance threshold of p < 0.05. This step enabled the selection of genes significantly associated with patient survival, thereby refining our set to 21 prognostic genes with a strong correlation to patient outcomes(Figure 4A).
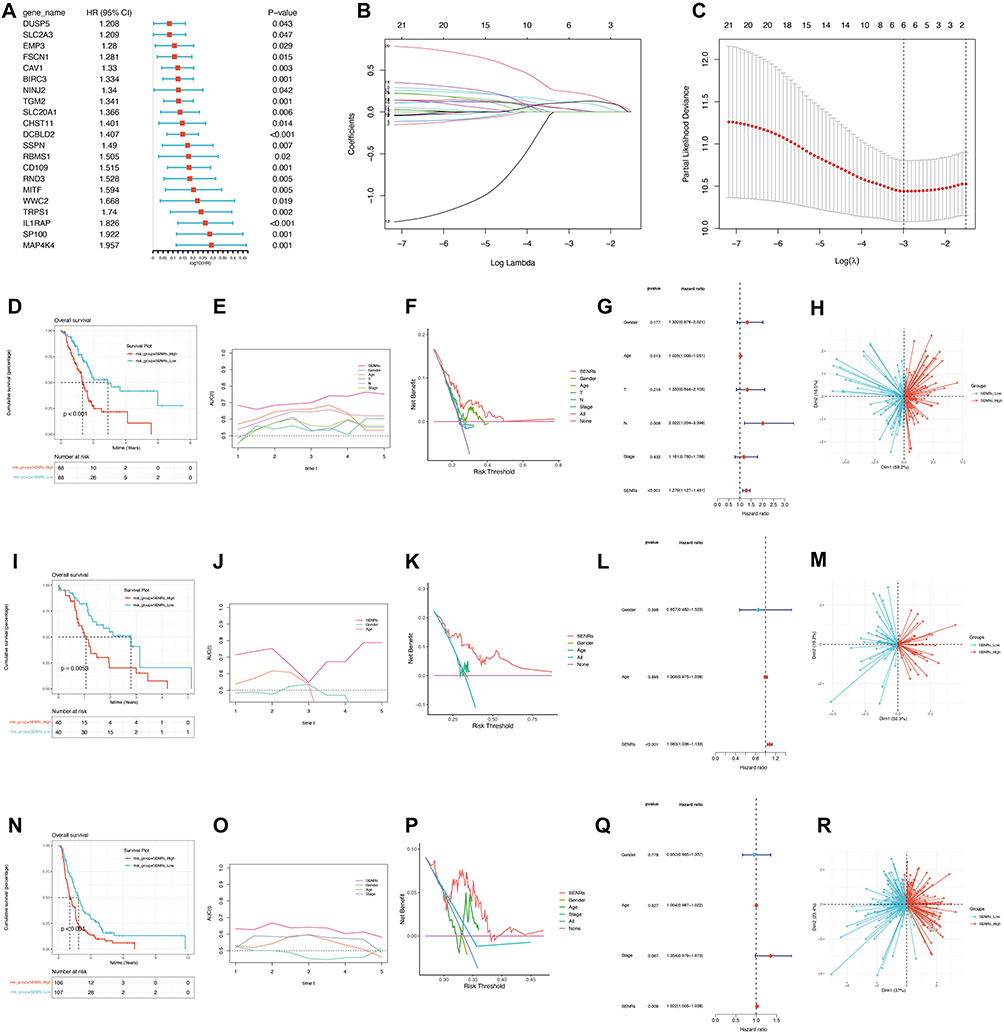 |
Figure 4 Construction and validation of the prognostic model. (A) Univariate COX analysis. A total of 21 prognostic genes in the TCGA cohort and PAAD-AU cohort were obtained. (B and C)LASSO regression analysis. (D–H)Prognosis validation in the TCGA cohort. The prognosis of patients in SENRs_High group was poor (p<0.05). The prediction effect of the model was better than that of other clinical indicators, and patients could benefit more than other clinical indicators by taking appropriate clinical measures according to the model. SENRs is a risk factor for patient prognosis (p<0.05). This model can distinguish patients well. (I–M)Prognosis validation in the PAAD-AU cohort. (N–R)Prognosis validation in the PAAD-CA cohort. |
To further ensure the robustness and specificity of our prognostic model, we applied Least Absolute Shrinkage and Selection Operator (LASSO) regression on these 21 genes(Figure 4B–C). LASSO regression is particularly useful for managing high-dimensional data by reducing the number of variables, effectively eliminating weaker predictors. After tuning the regularization parameter (lambda) to an optimal value of 0.05, we obtained a final prognostic model comprising six genes: CAV1, BIRC3, DCBLD2, CD109, IL1RAP, and SP100. These six genes were each assigned a coefficient, allowing us to construct a risk score that quantifies the patient’s prognosis.
This refined selection process ensured that the model retained only the most predictive genes from the initial 303-gene set, improving its predictive accuracy and clinical relevance. As shown in Figure 4D–H, patients with high-risk scores based on this model had significantly poorer prognoses (p < 0.05), indicating the model’s potential clinical utility. The prediction effect of the model was better than that of other clinical indicators, and patients could benefit more than other clinical indicators by taking appropriate clinical measures according to the model. SENRs is a risk factor for patient prognosis (p<0.05). This model can distinguish patients well. In order to further verify the accuracy of the model, we also conducted analysis in the AU and CA cohort, as shown in Figure 4I–R, SENRs_High group had poor prognosis (p<0.05), and the prediction effect of the model was better than that of other clinical indicators. Moreover, patients who took appropriate clinical measures according to the model benefited more than other clinical indicators. SENRs were all risk factors for patient prognosis (p<0.05), and the model could distinguish patients well.
Mutation and Immune Correlation Analysis
This study further explored the differences in mutation and immune infiltration between the model groups in order to better identify patients who are more suitable for immunotherapy. As shown in Figure 5A–B, in the SENRs_Low group, the mutation incidence was 74.39%, and the top 5 most mutated genes were KRAS, TP53, SMAD4, CDKN2A and MUC16. In the SENRs_High group, the mutation incidence was 90.12%, and the top 5 most mutated genes were KRAS, TP53,CDKN2A and TTN. As shown in Figure 5C, patients in SENRs_High group had a higher degree of immune infiltration, such as B cells and T cells. As shown in Figure 5D–F, most of the leukocyte antigen genes, immune checkpoint genes, and tumor necrosis genes were highly expressed in the SENRs_High group, such as HLA-E, HLA-A, CTLA4,CD86, CXCL10,EIF2A, etc. As shown in Figure 5G–J, the immune score(p<0.05), stromal score(p<0.001) and total score(p<0.01) of SENRs_High group were higher, while the tumor purity was lower (p<0.01). This may be related to the higher degree of immune cell infiltration but also the higher degree of immune escape in the high SENRs group. As shown in Figure 5K, in patients who responded to immunotherapy, the model value SENRs was lower(p<0.001). And the TIDE score was higher (p<0.001)was higher in SENR_high group, and SENRs was significantly positively correlated with TIDE (cor 0.35 and p< 0.001)(Figure 5L–M). This study further explored the activation of the pathway in the SENRs_High group and found that the TGF beta pathway and Epithelial Mesenchymal Transition pathway were significantly activated as shown in Figure 5N–O.
 |
Figure 5 Analysis of tumor microenvironment. (A and B) Mutant landscape of SENR_low group and SENR_high group. (C)Different landscape of immune cell infiltration between the two groups. (D–F)Differences in the expression of leukocyte antigen genes, immune checkpoint genes, and tumor necrosis genes between the two groups. (G–J) the immune score, stromal score and total score of SENRs_High group were higher, while the tumor purity was lower. (K–M)Prediction of response to immunotherapy in two groups. (N and O)GSEA in SENRs_High group.(*p<0.05, **p<0.01, ***p<0.001). |
Gene Expression Mapping and Pseudo-Time Series Analysis
Subsequently, the expression of the six genes in the model was analyzed in the cell type. As shown in Figure 6A–F, BIRC3 is mainly expressed in T cells, CAV1 is mainly expressed in Epithelial cells, Fibroblast cells and Pericyte cells, and CD109 and DCBLD2 are mainly expressed in Epithelial cells. IL1RAP is mainly expressed in monocyte and macrophage cells, while SP100 is highly expressed in different cells. In this study, the immune cells were screened out and simulated time sequence analysis was performed. As shown in Figure 6G–L, cells gradually differentiated from dark blue to light blue, with a total of three differentiation states. cluster1 is the main cluster in differentiation state 1, cluster11 and cluster14 are the main cluster in differentiation state 2, cluster4 and cluster6 are the main cluster in differentiation state 3. Moreover, monocytes and macrophage are early differentiated, Mast cells and plasma cells are in the middle state, and NK cells, T cells and Dendritic cells are late differentiated. The model value SENRs in each cell was calculated according to the model calculation formula. As shown in Figure 6K, SENRs_Low was mainly in the early and middle differentiation state, while SENRs_High group was mainly in the late differentiation state. As shown in Figure 6L, with the differentiation of immune cells, the expressions of BIRC3, CAV1 and DCBLD2 showed a trend of first increasing and then decreasing, SP100 mainly showed an increasing trend, while CD109 and IL1RAP mainly showed a decreasing trend.
 |
Figure 6 Gene expression mapping and pseudo-time series analysis. (A–F) The expression and localization of 6 genes in different cells. (G–L) pseudo-time series analysis of immune cells and quasi-temporal analysis of 6 model genes. |
Clinical Correlation Analysis
For clinical guidance, we conducted clinical relevance analysis. As shown in Figure 7A, we found that model values were prognostic risk factors in both the three cohorts and the combined data (p<0.05). As shown in Figure 7B–D, patients were divided into 3 groups according to the median SENRs value and N stage of the model. Group1 and Group2 corresponded to SENRs_Low group, while Group3 corresponded to SENRs_High group. Survival curve analysis suggested that Group3 had a worse prognosis than Group1. As shown in Figure 7E, by combining the model values of the patient’s TCGA-FB-A5VM and clinical data, the 1, 3 and 5-year mortality of the patient was predicted to be 0.226, 0.676 and 0.787 in the nomogram. In order to further verify the accuracy of the prediction results of Nomograph, continuous prognostic ROC curve analysis was performed in this study. As shown in Figure 7F, Nomogram predicted the prognosis of patients with AUC fluctuation of 0.75, which was higher than other clinical indicators. In order to further find the core genes among the 6 genes in the model, CAV1 interacts with CD109, DCBLD2 and BIRC3, as shown in Figure 7G. Therefore, this study further verified the gene by experiment.
 |
Figure 7 Clinical correlation analysis. (A) The model values were prognostic risk factors in both the three cohorts and the combined data (p<0.05). (B–D)Clinical decision analysis. (E and F) Construction and validation of the nomogram. (G)Interaction networks between proteins encoded by model genes. |
The Function of CAV1 in Pancreatic Cancer Cell Lines Was Verified by Cell Experiments
Because CAV1 plays a pivotal role in the protein-protein interaction network of six model genes, we conducted further cell line experiments to verify the function of CAV1. Firstly, CAV1 was knockdown with 3 siRNA in pancreatic cancer Capan-1 cell lines and PANC-1 cell lines. The results show that the knockdown efficiency of si-CAV1-2 is higher(Figure 8A). Then CCK-8 experiment was performed(Figure 8B). The results showed that the activity of Capan-1 and PANC-1 cell lines decreased significantly after CAV1 gene knockdown. And Colony formation assay showed that the proliferation activity of Capan-1 and PANC-1 cell lines decreased significantly after CAV1 gene knockdown(Figure 8C). Transwell assay showed that the migration ability of Capan-1 and PANC-1 cell lines decreased significantly after CAV1 gene knockdown(Figure 8D).
 |
Figure 8 The function of CAV1 gene in pancreatic cancer cell line was verified by cell function assay. (A) CAV1 knockdown with 3 siRNA in pancreatic cancer Capan-1 cell lines and PANC-1 cell lines. The results show that the knockdown efficiency of si-CAV1-2 is higher. (B) CCK-8 experiment. The results showed that the activity of Capan-1 and PANC-1 cell lines decreased significantly after CAV1 gene knockdown. (C) Cloning experiments. The results showed that the proliferation activity of Capan-1 and PANC-1 cell lines decreased significantly after CAV1 gene knockdown. (D) Transwell experiment. The results showed that the migration ability of Capan-1 and PANC-1 cell lines decreased significantly after CAV1 gene knockdown.(*p<0.05, **p<0.01, ***p<0.001). |
PCR Tests of CAV1 in Clinical Samples
PCR experiments showed that CAV1 was significantly up-regulated in pancreatic cancer tissues compared with adjacent normal tissues (Figure 9).
 |
Figure 9 PCR test. PCR experiments showed that CAV1 was significantly up-regulated in pancreatic cancer tissues compared with adjacent normal tissues. (***p<0.001). |
Discussion
Our study is the first to explore the significance of cellular senescence through single-cell sequencing analysis and bulk transcriptome analysis in pancreatic cancer. Through single-cell sequencing analysis, we can intuitively identify the heterogeneity of cell senescence distribution in pancreatic cancer cells. The pathways associated with cell senescence such as Apoptosis, Epithelial Mesenchymal Transition, Hypoxia, Inflammatory Response and TGF Beta were also found. At the same time, WGCNA was used to explore the gene modules most associated with cellular senescence in pancreatic cancer. The green module was found to be highly correlated with cellular senescence. This is not only a way to identify gene sets, but also a means to stratify the prognosis of pancreatic cancer patients. With unsupervised clustering, patients could be divided into two clusters based on the module genes obtained from WGCNA, with cluster2 having a significantly worse prognosis. This also provides a reference for us to evaluate the prognosis of pancreatic cancer patients.
The further construction and validation of the prognostic model is more clinical significance. The initial screening of these model genes was obtained by the intersection of genes obtained by single-cell sequencing analysis and genes obtained by WGCNA, with a total of 303 genes. These genes were double-screened, so their relevance to cellular senescence was more pronounced. Further COX and LASSO regression analyses narrowed the gene range further and assigned coefficients to each model gene so that the patient’s risk profile could be quantified by the amount of these genes expressed. Each group of patients could be divided into a high risk group and a low risk group by median risk value, and the high risk group had a significantly worse prognosis. This provides a better method for stratifying the prognosis of pancreatic cancer. The subsequent immune correlation analysis and mutation analysis showed the immune landscape and mutation landscape of pancreatic cancer, and analyzed the correlation between risk score and immunity and mutation, which could provide references for immunotherapy of pancreatic cancer. Overall, the results of our study can provide reference for the prognosis assessment and immunotherapy of pancreatic cancer.
At present, some bioinformatics studies have initially revealed the significance of senescence in the tumor microenvironment. Lv et al identified three molecular subgroups of osteosarcoma through differentially expressed age-related genes in prognosis. These subgroups have differences in immune invasion, signaling pathway activation, prognosis, and drug sensitivity, which can provide considerable references for the diagnosis and treatment of osteosarcoma.26 Yue et al constructed senescence-related risk profiles in colorectal cancer, where the high risk score was associated with poorer prognosis and positively correlated with the abundance of immune cell infiltration in the tumor microenvironment.27 Hua et al constructed a 5-gene senescence-related prognosis signature from high-throughput sequencing data to assess patient prognosis in pancreatic cancer.28 However, compared to their results, we used single-cell sequencing data to explore the heterogeneity of senescence in pancreatic cancer cells, adding confidence to the data. Moreover, we also used weighted coexpression network analysis, which further increased the correlation of the data. Moreover, the prognostic model we constructed has a higher AUC value and is more accurate. We also used cell experiments to verify the function of the key gene CAV1 in pancreatic cancer cells.
In the realm of molecular biology and cancer research, the caveolin-1 gene, often abbreviated as CAV1, has emerged as a key player with profound implications in tumorigenesis and cancer progression.29 CAV1 is a gene that encodes a critical structural protein known as caveolin-1, which is primarily associated with the formation and maintenance of caveolae, small invaginations of the cell membrane.30 Beyond its structural role, CAV1 has been recognized as a multifunctional molecule involved in various cellular processes, including signal transduction, lipid homeostasis, and cellular trafficking. In recent years, an increasing body of evidence has underscored the pivotal role of the CAV1 gene in cancer biology, making it a subject of intense investigation and a promising target for cancer therapy. The significance of CAV1 in pancreatic cancer has been preliminarily elucidated by many studies. Hu et al found that cav-1 in pancreatic cancer cells stimulates IGF1R/IR and glycolysis in cancer cells and triggers a malignant state in tumor carriers.31 Yamao et al found that in pancreatic cancer, down-regulation of CAV1 in cancer-associated fibroblasts (CAFs) reduced the invasiveness of PC cells.32 Therefore, CAV1 of CAF may be a new target for the treatment of PC. Our study revealed the correlation between CAV1 and senescence in pancreatic cancer, and verified the function of CAV1 through cell experiments, providing a potential target for pancreatic cancer.
A limitation of our study is that our single-cell sequencing data and bulk transcriptome data were obtained from public databases, and we lacked sequencing data from the real world. Moreover, our experiments were carried out in cell lines, lacking corresponding patient tissues and animal models for verification. We will explore that in the future.
Data Sharing Statement
All the data can be found in the manuscript.
Compliance with Ethical Standards
All procedures performed were in accordance with the declaration of the ethical standards of the institutional research committee and with the 1964 helsinki 387 Declaration and its later amendments. The ethics committee has approved this study of First Hospital of Jiaxing, Affiliated Hospital of Jiaxing University.
Acknowledgments
Liang Chen, Xiaomei Ying, Haohao Wang, Jiaheng Xie are co-first authors for this work. We are very grateful for data provided by databases such as TCGA, GEO.
Author Contributions
All authors made a significant contribution to the work reported, whether that is in the conception, study design, execution, acquisition of data, analysis and interpretation, or in all these areas; took part in drafting, revising or critically reviewing the article; gave final approval of the version to be published; have agreed on the journal to which the article has been submitted; and agree to be accountable for all aspects of the work.
Funding
The work was funded by grants from the Key Discipline of Hepatobiliary and Pancreatic Surgery of Jiaxing City [2023-ZC-005], Translational therapy center for hepatobiliary pancreatic cancer [2021-YJZX-04], and the pancreatic cancer project [2022-QMX-009][2023-YB-006] and National Clinical Key Specialty Construction Project [2023-GJZK-001].
Disclosure
All authors declare that no conflict of interest exists.
References
1. Vincent A, Herman J, Schulick R, Hruban RH, Goggins M. Pancreatic cancer. Lancet. 2011;378(9791):607–620. PMID: 21620466; PMCID: PMC3062508.doi:10.1016/S0140-6736(10)62307-0
2. Cai J, Chen H, Lu M, et al. Advances in the epidemiology of pancreatic cancer: trends, risk factors, screening, and prognosis. Cancer Lett. 2021;520:1–11. PMID: 34216688. doi:10.1016/j.canlet.2021.06.027
3. Wood LD, Canto MI, Jaffee EM, Simeone DM. Pancreatic cancer: pathogenesis, screening, diagnosis, and treatment. Gastroenterology. 2022;163(2):386–402.e1. PMID: 35398344; PMCID: PMC9516440.doi:10.1053/j.gastro.2022.03.056
4. Kolbeinsson HM, Chandana S, Wright GP, Chung M. Pancreatic cancer: a review of current treatment and novel therapies. J Invest Surg. 2023;36(1):2129884. PMID: 36191926.doi:10.1080/08941939.2022.2129884
5. Halbrook CJ, Lyssiotis CA, Pasca Di Magliano M, Maitra A. Pancreatic cancer: advances and challenges. Cell. 2023;186(8):1729–1754. PMID: 37059070; PMCID: PMC10182830.doi:10.1016/j.cell.2023.02.014
6. Torphy RJ, Fujiwara Y, Schulick RD. Pancreatic cancer treatment: better, but a long way to go. Surg Today. 2020;50(10):1117–1125. PMID: 32474642; PMCID: PMC7837389.doi:10.1007/s00595-020-02028-0
7. Abe K, Kitago M, Kitagawa Y, Hirasawa A. Hereditary pancreatic cancer. Int J Clin Oncol. 2021;26(10):1784–1792. PMID: 34476650; PMCID: PMC8449773.doi:10.1007/s10147-021-02015-6
8. Park W, Chawla A, O’Reilly EM. Pancreatic cancer: a review. JAMA. 2021;326(9):851–862. Erratum in: JAMA. 2021;326(20):2081. PMID: 34547082; PMCID: PMC9363152.doi:10.1001/jama.2021.13027
9. Zhang CY, Liu S, Yang M. Clinical diagnosis and management of pancreatic cancer: markers, molecular mechanisms, and treatment options. World J Gastroenterol. 2022;28(48):6827–6845. PMID: 36632312; PMCID: PMC9827589.doi:10.3748/wjg.v28.i48.6827
10. Al-Shaheri FN, Alhamdani MSS, Bauer AS, et al. Blood biomarkers for differential diagnosis and early detection of pancreatic cancer. Cancer Treat Rev. 2021;96:102193. PMID: 33865174. doi:10.1016/j.ctrv.2021.102193
11. Hou J, Li X, Xie KP. Coupled liquid biopsy and bioinformatics for pancreatic cancer early detection and precision prognostication. Mol Cancer. 2021;20(1):34. PMID: 33593396; PMCID: PMC7888169.doi:10.1186/s12943-021-01309-7
12. Chiorean EG, Coveler AL. Pancreatic cancer: optimizing treatment options, new, and emerging targeted therapies. Drug Des Devel Ther. 2015;9:3529–3545. PMID: 26185420; PMCID: PMC4500614. doi:10.2147/DDDT.S60328
13. Zhu H, Li T, Du Y, Li M. Pancreatic cancer: challenges and opportunities. BMC Med. 2018;16(1):214. PMID: 30463539; PMCID: PMC6249728.doi:10.1186/s12916-018-1215-3
14. Milella M, Bassi C, Boggi U, et al. Evolving pancreatic cancer treatment: from diagnosis to healthcare management. Crit Rev Oncol Hematol. 2022;169:103571. PMID: 34923121. doi:10.1016/j.critrevonc.2021.103571
15. Chung V, Sun V, Ruel N, Smith TJ, Ferrell BR. Improving palliative care and quality of life in pancreatic cancer patients. J Palliat Med. 2022;25(5):720–727. PMID: 34704841; PMCID: PMC9080991.doi:10.1089/jpm.2021.0187
16. Calcinotto A, Kohli J, Zagato E, Pellegrini L, Demaria M, Alimonti A. Cellular senescence: aging, cancer, and injury. Physiol Rev. 2019;99(2):1047–1078. PMID: 30648461.doi:10.1152/physrev.00020.2018
17. Saleh T, Carpenter VJ, Bloukh S, Gewirtz DA. Targeting tumor cell senescence and polyploidy as potential therapeutic strategies. Semin Cancer Biol. 2022;81:37–47. PMID: 33358748; PMCID: PMC8214633. doi:10.1016/j.semcancer.2020.12.010
18. Wang X, Ma L, Pei X, et al. Comprehensive assessment of cellular senescence in the tumor microenvironment. Brief Bioinform. 2022;23(3):bbac118. PMID: 35419596; PMCID: PMC9116224.doi:10.1093/bib/bbac118
19. Wang L, Lankhorst L, Bernards R. Exploiting senescence for the treatment of cancer. Nat Rev Cancer. 2022;22(6):340–355. PMID: 35241831.doi:10.1038/s41568-022-00450-9
20. Schmitt CA, Wang B, Demaria M. Senescence and cancer - role and therapeutic opportunities. Nat Rev Clin Oncol. 2022;19(10):619–636. PMID: 36045302; PMCID: PMC9428886.doi:10.1038/s41571-022-00668-4
21. Steele NG, Carpenter ES, Kemp SB, et al. Multimodal mapping of the tumor and peripheral blood immune landscape in human pancreatic cancer. Nat Cancer. 2020;1(11):1097–1112. [PMID: 34296197]. doi:10.1038/s43018-020-00121-4
22. Lin W, Noel P, Borazanci EH, et al. Single-cell transcriptome analysis of tumor and stromal compartments of pancreatic ductal adenocarcinoma primary tumors and metastatic lesions. Genome Med. 2020;12(1):80. [PMID: 32988401]. doi:10.1186/s13073-020-00776-9
23. Tomczak K, Czerwińska P, Wiznerowicz M. The Cancer Genome Atlas (TCGA): an immeasurable source of knowledge. Contemp Oncol (Pozn). 2015;19(1A):A68–77. PMID: 25691825; PMCID: PMC4322527.doi:10.5114/wo.2014.47136
24. Saul D, Kosinsky RL, Atkinson EJ, et al. A new gene set identifies senescent cells and predicts senescence-associated pathways across tissues. Nat Commun. 2022;13(1):4827. PMID: 35974106; PMCID: PMC9381717.doi:10.1038/s41467-022-32552-1
25. Chen L, Zhang X, Zhang Q, et al. A necroptosis related prognostic model of pancreatic cancer based on single cell sequencing analysis and transcriptome analysis. Front Immunol. 2022;13:1022420. doi:10.3389/fimmu.2022.1022420
26. Lv Y, Wu L, Jian H, et al. Identification and characterization of aging/senescence-induced genes in osteosarcoma and predicting clinical prognosis. Front Immunol. 2022;13:997765. PMID: 36275664; PMCID: PMC9579318. doi:10.3389/fimmu.2022.997765
27. Yue T, Chen S, Zhu J, et al. The aging-related risk signature in colorectal cancer. Aging. 2021;13(5):7330–7349. PMID: 33658390; PMCID: PMC7993742.doi:10.18632/aging.202589
28. Hua H, Zheng C, Fan J, et al. The senescence-related signature predicts prognosis and characterization of tumor microenvironment infiltration in pancreatic cancer. Biomed Res Int. 2022;2022:1916787. PMID: 36518628; PMCID: PMC9744624. doi:10.1155/2022/1916787
29. Nwosu ZC, Ebert MP, Dooley S, Meyer C. Caveolin-1 in the regulation of cell metabolism: a cancer perspective. Mol Cancer. 2016;15(1):71. PMID: 27852311; PMCID: PMC5112640.doi:10.1186/s12943-016-0558-7
30. Gokani S, Bhatt LK. Caveolin-1: a promising therapeutic target for diverse diseases. Curr Mol Pharmacol. 2022;15(5):701–715. PMID: 34847854.doi:10.2174/1874467214666211130155902
31. Hu L, Xu X, Li Q, et al. Caveolin-1 increases glycolysis in pancreatic cancer cells and triggers cachectic states. FASEB J. 2021;35(8):e21826. PMID: 34320244.doi:10.1096/fj.202100121RRR
32. Yamao T, Yamashita YI, Yamamura K, et al. Cellular senescence, represented by expression of caveolin-1, in cancer-associated fibroblasts promotes tumor invasion in pancreatic cancer. Ann Surg Oncol. 2019;26(5):1552–1559. PMID: 30805811.doi:10.1245/s10434-019-07266-2
 © 2024 The Author(s). This work is published and licensed by Dove Medical Press Limited. The
full terms of this license are available at https://www.dovepress.com/terms.php
and incorporate the Creative Commons Attribution
- Non Commercial (unported, 3.0) License.
By accessing the work you hereby accept the Terms. Non-commercial uses of the work are permitted
without any further permission from Dove Medical Press Limited, provided the work is properly
attributed. For permission for commercial use of this work, please see paragraphs 4.2 and 5 of our Terms.
© 2024 The Author(s). This work is published and licensed by Dove Medical Press Limited. The
full terms of this license are available at https://www.dovepress.com/terms.php
and incorporate the Creative Commons Attribution
- Non Commercial (unported, 3.0) License.
By accessing the work you hereby accept the Terms. Non-commercial uses of the work are permitted
without any further permission from Dove Medical Press Limited, provided the work is properly
attributed. For permission for commercial use of this work, please see paragraphs 4.2 and 5 of our Terms.