")
Back to Journals » Journal of Inflammation Research » Volume 17
Identification of Cellular Senescence-Related Critical Genes and Molecular Classification and Revealing the Drug-Resistant Therapeutic Effect of IGFBP2 in Chronic Myeloid Leukemia
Authors Xu Y, Yang W, Yao F, Wang Z , Liu J, Huang B, Li X, Zhong F, Wang X
Received 2 August 2024
Accepted for publication 4 November 2024
Published 6 November 2024 Volume 2024:17 Pages 8313—8324
DOI https://doi.org/10.2147/JIR.S483705
Checked for plagiarism Yes
Review by Single anonymous peer review
Peer reviewer comments 2
Editor who approved publication: Dr Adam Bachstetter
Yanmei Xu, Wentao Yang, Fangyi Yao, Zihao Wang, Jing Liu, Bo Huang, Xiaolin Li, Fangmin Zhong, Xiaozhong Wang
Jiangxi Province Key Laboratory of Immunology and Inflammation, Jiangxi Provincial Clinical Research Center for Laboratory Medicine, Department of Clinical Laboratory, The Second Affiliated Hospital, Jiangxi Medical College, Nanchang University, Nanchang, Jiangxi, People’s Republic of China
Correspondence: Xiaozhong Wang; Fangmin Zhong, Email [email protected]; [email protected]
Background: The occurrence and development of hematologic tumors are closely linked to cellular senescence. However, the molecular characteristics associated with this phenomenon in chronic myeloid leukemia (CML) have not been thoroughly investigated.
Methods: The cellular senescence score was calculated using gene set variation analysis. Consensus clustering algorithm was used to identify the molecular subtypes associated with cellular senescence. Clinical samples were collected for sequencing analysis to verify the expression of critical cellular senescence-related genes (CSRG). The effect of targeted inhibition of IGFBP2 on the malignant phenotype of CML-resistant cells was studied by cell experiments.
Results: The cellular senescence score in CML samples was significantly lower compared to normal samples. Higher expression of immune checkpoint markers correlated with increased cellular senescence scores. We identified two distinct molecular subtypes (C1 and C2) related to cellular senescence. The C1 subtype exhibited enhanced metabolic function and DNA damage repair capacity, while the C2 subtype showed higher infiltration of immune effector cells and activity in immune-related signaling pathways. We also discovered a group of drugs that displayed significant sensitivity differences between these two molecular subtypes, with the C2 subtype showing greater responsiveness to immunotherapy. Four critical cellular senescence-related genes (CSRGs), namely IGFBP2, IL7R, PLAU, and SUN1 demonstrated high diagnostic value for CML. We validated the expression levels of these four genes using clinical samples and confirmed through cell experiments that targeted inhibition of IGFBP2 effectively suppressed proliferation of resistant CML cells, promoted apoptosis, and enhanced therapeutic sensitivity to imatinib.
Conclusion: Our study conducted a comprehensive analysis on CSRG expression characteristics in CML and explored potential correlations between cellular senescence and immune function. The identification of molecular subtypes provides valuable insights into assessing individual patients’ biological characteristics for guiding clinical treatment decisions. Additionally, IGFBP2 has emerged as a promising therapeutic target for therapy-resistant cases of CML.
Keywords: chronic myeloid leukemia, cellular senescence, immune microenvironment, treatment, molecular subtype, diagnosis
Introduction
The pathogenesis of chronic myeloid leukemia (CML) primarily involves the formation of the BCR-ABL fusion gene, which encodes a protein with aberrant tyrosine kinase activity.1 This abnormality triggers multiple downstream signaling pathways and ultimately leads to dysregulated proliferation of hematopoietic stem cells, culminating in the development of leukemia.2
In recent years, with the advancement of medical research, the role of cellular senescence in tumor occurrence and development has gradually garnered attention.3 Cellular senescence refers to a state of cell growth arrest that may be associated with both tumor suppression and progression.4 It is characterized by the accumulation of senescence-associated galactosidase glycosidase (SA-β-gal) and activation of the senescence-associated secretory phenotype (SASP).4,5 Various biological pathways such as oxidative stress and DNA damage are closely linked to cellular senescence.6,7 The p53/p21 and Rb1/p16 pathways have been identified as crucial regulatory mechanisms in cellular senescence.8–10 Despite inhibiting cell growth, aging also manifests as an escape state that reduces energy consumption and enhances resistance against external stimuli.11,12 Furthermore, senescent tumor cells can modulate the tumor microenvironment (TME), releasing diverse cancer-promoting signaling molecules and cytokines while promoting immunosuppressive cell accumulation, thereby exerting anti-tumor immune effects and impeding immunotherapy efficacy.6,13–15
In CML, cellular senescence may function as a protective mechanism that inhibits the proliferation and metastasis of tumor cells.16–18 However, during disease progression, tumor cells can evade senescence through certain mechanisms, leading to continued proliferation and further advancement of the disease.11 Therefore, understanding the regulation and role of CML cell senescence is crucial for comprehending its pathogenesis and developing effective treatments. This study focuses on investigating the expression profile of cellular senescence-related genes (CSRG) in CML and identifying molecular subtypes associated with CSRG to guide precision treatment strategies for CML. Additionally, we conduct an extensive analysis to determine the diagnostic value of critical CSRGs as well as their targeted therapeutic potential in CML. Through these investigations, we aim to uncover the molecular mechanisms and regulatory pathways underlying cellular senescence in CML while exploring novel therapeutic approaches for more efficacious management of this disease. Here, our focus lies on IGFBP2. Previous studies have demonstrated that RhoA-regulated IGFBP2 facilitates the invasion and progression of BCR-ABL1 CML.19 Our study aims to elucidate the targeted therapeutic potential of IGFBP2 in drug-resistant CML, thereby shedding further light on its biological function in this disease.
Method
Data Acquisition and Preprocessing
The CML transcriptome sequencing data from GSE13159 and GSE144119 were obtained from the Gene Expression Omnibus (GEO) database. GSE13159 was utilized as the analysis cohort, comprising 76 CML samples and 74 normal samples. GSE144119 served as the validation cohort, encompassing 48 newly diagnosed CML samples, 32 CML samples in remission from treatment, and 17 normal samples. High-throughput RNA sequencing data were converted to transcripts per million (TPM) values. A total of 307 senescence-related genes were downloaded from the Human Ageing Genomic Resources database (https://genomics.senescence.info/).
Collection and Transcriptome Sequencing of CML Clinical Samples
According to the classification of hematopoietic and lymphoid tissue tumors by the World Health Organization, a total of 10 samples from patients with CML and 5 normal control samples were collected with written consent obtained from patients approved by the Ethics Committee of the Second Affiliated Hospital of Nanchang University (No. review. [2018] No. (092)). These samples were residual after participants underwent relevant examinations. The methods and procedures for sample collection, transcriptome sequencing, and processing have been described in our previous report.20
Analysis of Differential Expression and Pathway Enrichment
The “limma” software package was utilized for the analysis of the differential expression of CSRG,21 and the adjusted p-value below 0.05 was considered significant. The gene set variation analysis (GSVA) algorithm was employed to assess pathway activity via “GSVA” and “GSEABase” packages,22 while gene set enrichment analysis (GSEA) was used to identify signaling pathways exhibiting differential enrichment between different groups (P < 0.05, false discovery rate (FDR) < 0.25),23 the analysis process was performed and visualized by utilizing “clusterProfiler” packages.
Analysis of Immune Cell Infiltration
The “ESTIMATE” algorithm was utilized for the computation of immune and stromal scores, enabling the evaluation of tumor microenvironment characteristics.24 The “CIBERSORT” algorithm was employed to estimate immune cell infiltration, accurately quantifying the proportions of 22 distinct immune cell types based on individual sample’s gene expression profiles.25
The Molecular Subtypes Were Identified Based on the Expression Profile of CSRG
To comprehensively evaluate inter-individual variations in patients with CML, we employed the “ConsensusClusterplus” software package to conduct cluster analysis on CML samples based on CSRG expression profiles, with the aim of identifying distinct molecular subtypes in CML. The robustness and stability of the clustering results were validated through 1000 iterations. Additionally, principal component analysis (PCA) was utilized for classification validation.
Prediction of the Responsiveness of CML Samples Towards Chemotherapeutic Drug Therapy and Immunotherapy
The “pRRophetic” package was utilized to predict the semi-maximum inhibitory concentration (IC50) of chemotherapy agents for different CML samples, based on blood tumor cell expression matrix and drug response data obtained from the Cancer Genome Project (CGP) database. Additionally, the “SubMap” algorithm was employed to forecast the response of distinct molecular subtypes against PD-1 and anti-CTLA4 immune checkpoint inhibitors.
Cell Culture and Transfection
The CML cell line K562 was cultured in a humidified incubator with 5% CO2 saturation at 37°C in RPMI-1640 medium supplemented with 10% fetal bovine serum and 1% penicillin-streptomycin. The utilization of the cell line was granted approval by the Ethics Committee of the Second Affiliated Hospital of Nanchang University. The imatinib-resistant K562 cell line (K562/IR) was established by alternating between an imatinib-containing medium and a normal medium without imatinib every other day, gradually increasing the concentration of imatinib until complete induction of resistant cells. Lentiviruses containing IGFBP2 shRNA were obtained from Genechem (Shanghai, China) for infecting K562/IR cells and screening for puromycin resistance.
Western Blotting
The cells were lysed using RIPA lysis buffer (Applygen, China). Protein concentration was determined using a bicinchoninic acid (BCA) kit (Tiangen, China). For electrophoresis, 40 ng of protein was loaded into each well and separated on an SDS-PAGE gel. Subsequently, the proteins were transferred onto PVDF membranes (Millipore, Germany). The membranes were blocked with 5% nonfat milk and incubated at room temperature for 2 hours. Following this, antibodies against β-tubulin (#2146, Cell Signaling Technology (CST); diluted 1:1000), IGFBP2 (#3922, CST; diluted 1:1000) were added and allowed to incubate overnight at 4 °C. After three washes with appropriate buffers, the secondary antibody (Anti-Rabbit, 7074S, CST; diluted to a concentration of 1:5000) was applied followed by incubation for another 2 hours at room temperature. Finally, the blots were visualized using an enhanced chemiluminescence kit (Thermo, USA) and analyzed using a Bio-Rad Western Blot Imaging System (Bio-Rad, Berkeley, CA, USA).
The Cell Counting Kit 8 (CCK-8 Cell) Proliferation Assay
Cell viability was assessed using the CCK-8 (Hambio, China). In this experiment, 5-e3 cells were inoculated in 96-well plates with each group repeated three times. After the specified culture time, 10 μL of CCK8 solution was added and incubated at 37°C for two hours. Optical density (OD) values at 450 nm were measured using a microplate reader.
Flow Cytometry
The APC Annexin V Apoptosis Detection Kit with PI Kit (Biolegend, USA) was utilized for apoptosis analysis in accordance with the manufacturer’s instructions. Following staining, cell samples were analyzed using a NovoCyte flow cytometer (D3080-3080, Agilent, USA), and data was processed using NovoExpress software Version 1.6.2 (Agilent, USA).
Statistical Analysis
All analysis was performed in the R language environment and corresponding software packages. Differences between two or more groups were analyzed using the Wilcoxon rank sum test and the Kruskal–Wallis test, respectively. The diagnostic value of the gene was determined by receiver operating characteristic (ROC) curve analysis. A bilateral p-value less than 0.05 indicates a statistically significant difference.
Results
Correlation Between Cellular Senescence Scores and Immune Characteristics in CML Samples
To better assess the cellular senescence characteristics of CML, we utilized the GSVA algorithm to calculate the cellular senescence scores of different samples. In comparison to normal samples, CML samples exhibited a significant decrease in cellular senescence score (Figure 1A), indicating resistance to senescence in CML cells, which may be associated with their malignant proliferation. Previous studies have demonstrated a close relationship between cellular senescence and TME. Immune infiltration analysis revealed that higher cell senescence scores were correlated with increased levels of infiltrating activated dendritic cells, resting memory CD4+ T cells, and memory B cells, while showing decreased levels of neutrophil infiltration (Figure 1B). Furthermore, immune checkpoint analysis indicated a significant negative correlation between gene expression levels of PD-1, PD-L1, CTLA4, and cellular senescence scores (Figure 1C). These findings suggest that while senescent cells may activate adaptive immunity, they also mediate immune checkpoint expression to facilitate immune evasion by CML cells.
 |
Figure 1 The characteristics of cellular senescence score and CSRG expression in CML samples. (A) Differences in cellular senescence scores between CML samples and normal samples in the GSE13159 cohort. (B and C) Correlation analysis of cellular senescence score with immune cell infiltration (B) and immune checkpoint expression (C) in CML samples. (D) The volcano map showed differences in CSRG expression between CML and normal samples. (E) The heatmap showed the expression distribution characteristics of the most differentially expressed CSRG between CML and normal samples. *P < 0.05; **P < 0.01. |
Molecular Characteristics of CSRG in CML Samples
We conducted a further analysis of the expression profile of CSRG in CML samples to unveil critical CSRGs in CML cells. The volcano plot demonstrates a higher number of downregulated CSRGs compared to upregulated ones in CML samples. In comparison with normal samples, IGFBP2 and PLAU exhibit significantly increased expression levels in CML samples (logFC > 1), while IL7R, SUN1, and CDK1 show significant reductions (logFC < 1) (Figure 1D). The heatmap illustrates the differential expression distribution of these five genes (Figure 1E). Correlation analysis confirms that the trends in CSRG expression are positively correlated or negatively correlated; conversely, SUN1 and IL7R display the highest degree of positive correlation with CDK1, suggesting their potential role as hub genes inhibiting cellular senescence (Figure 2A). Additionally, we observed significant positive correlations between IL7R expression and infiltration by CD8+ T cells, PLAU expression and eosinophil infiltration, as well as SUN1 expression and infiltration by memory B cells, naive B cells, M2 macrophages, activated NK cells, and resting memory CD4+ T cells (Figure 2B). These findings suggest that these CSRGs may be involved in regulating immune function in CML and could serve as markers for evaluating the immune state within infiltrated areas of CML patients. Subsequently, based on the expression patterns of the five CSRG genes, CML samples can be classified into two distinct molecular subtypes, namely Cluster C1 and Cluster C2 (Figure 2C). PCA analysis revealed a clear differentiation in the distribution of CML samples between these two subtypes, thereby confirming the robustness of the cluster analysis (Figure 2D). The expression levels of PLAU and IGFBP2 were significantly down-regulated in the C2 subtype compared to the C1 subtype, while IL7R and SUN1 exhibited significant down-regulation as well (Figure 2E). Based on their expression characteristics, patients with the C2 subtype demonstrate a closer resemblance to individuals from the normal population and may potentially have a more favorable prognosis.
 |
Figure 2 Identification of cellular senescence-related molecular subtypes and analysis of differences in immune microenvironment between subtypes. (A) Correlation analysis of expression among key CSRGs. (B) Correlation analysis of key CSRG expression and immune cell infiltration. (C) The expression of key CSRG was utilized to perform consensus clustering, resulting in the classification of CML patients into two cellular senescence-related molecular subtypes. (D) The PCA algorithm was employed to examine the distribution disparities of patients between subtypes. (E-G) Differences in CSRG expression (E), TME scores (F), and immune cell infiltration between the two molecular subtypes. *P < 0.05; **P < 0.01; ***P < 0.001. |
Identification of Molecular Subtypes Associated with Cell Senescence and Analysis of Differences in Immune Infiltration and Signaling Pathway Activity Between Subtypes
We focused on the disparities in immune signatures and signaling pathways between the two molecular subtypes. In comparison to the C1 subtype, the C2 subtype exhibited elevated stromal score and immune score, indicating heightened immune activity and reduced tumor purity (Figure 2F). Notably, infiltration levels of CD8+ T cells and resting NK cells were significantly augmented in the C2 subtype, suggesting enhanced immune cytotoxicity which may impede the malignant progression of CML (Figure 2G). GSEA analysis revealed significant enrichment of immune-related pathways such as cytokine-cytokine receptor interaction, natural killer cell mediated cytotoxicity, T cell receptor signaling pathway, Th1 and Th2 cell differentiation, as well as Th17 cell differentiation in the C2 subtype (Figure 3A and B). GSVA analysis further confirmed substantial elevation in activity scores of immune signaling pathways including IL6-JAK-STAT3 signaling, interferon alpha response, interferon gamma response, complement activation cascade, inflammatory response, and coagulation allograft rejection within the C2 subtype (Figure 3C). Collectively these findings indicate a higher level of immune activity within the C2 subtype. Additionally, our analysis revealed that the C1 subtype exhibited significant enrichment in pathways related to DNA damage repair and metabolism, including base excision repair, carbon metabolism, DNA replication, glutathione metabolism, and nucleotide excision repair. These findings suggest that this particular subtype may possess enhanced resistance capabilities and increased proliferative activity.
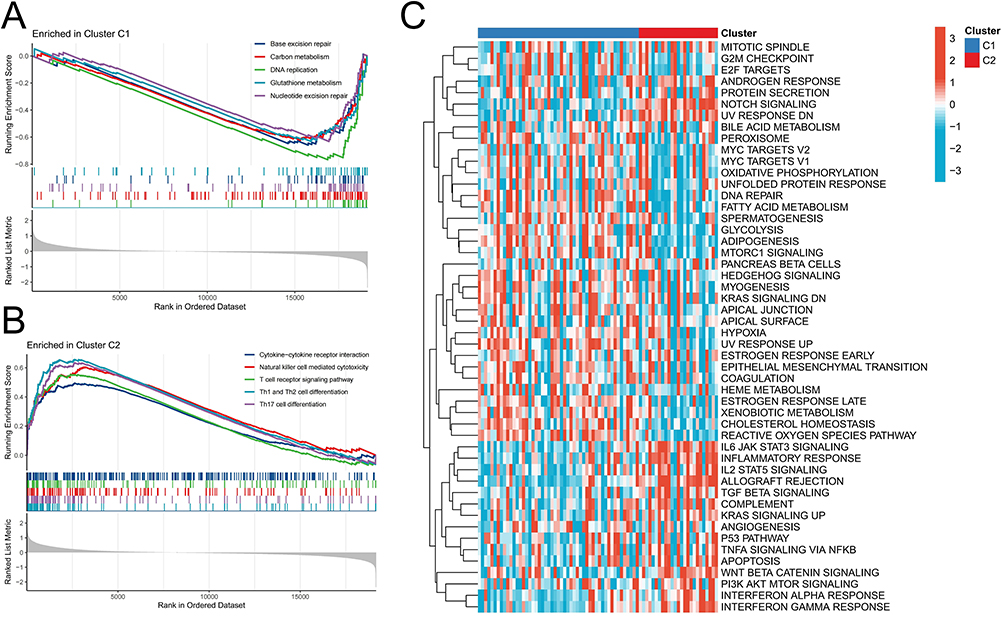 |
Figure 3 Differences in signal pathway enrichment between molecular subtypes. (A and B) GSEA analysis revealed enriched signaling pathways in the C1 (A) and C2 (B) subtypes. (C) GSVA analysis revealed differences in enrichment scores of cancer marker pathways between C1 and C2 subtypes. |
Differences in Chemosensitivity and Immunotherapy Response Between Cellular Senescence-Related Molecular Subtypes
To enhance precision treatment, we conducted a prediction of the therapeutic sensitivity of chemotherapy drugs between the two molecular subtypes, aiming to provide valuable guidance for clinical treatment. The comparative analysis revealed that the C1 subtype exhibited significantly higher sensitivity towards AICAR, ATRA, AUY922, Axitinib, AZD8055, Lenalidomide, and RDEA119 (Figure 4A). On the other hand, the C2 subtypes demonstrated remarkable sensitivity towards Bleomycin, Cytarabine, Dasatinib, and Lapatinib (Figure 4B). The selection of these chemotherapeutic agents could potentially optimize personalized treatment strategies for patients with CML. Subsequently considering the substantial variances in immune cell infiltration between these two subtypes, we employed the SubMap algorithm to predict response probabilities towards immunotherapy among patients with distinct subtypes. Notably, patients with the C2 subtype displayed a higher likelihood of responding positively to immunotherapy interventions such as anti-CTLA4 and anti-PD-1 therapies; particularly exhibiting an enhanced response rate when treated with anti-PD-1 therapy (Figure 4C and D). Furthermore, it was observed that PD-1 expression levels were significantly lower in the C2 subtype compared to the C1 subtype (Figure 4E). These findings suggest that immunotherapy may serve as a viable alternative treatment option for patients classified under the C2 subtype.
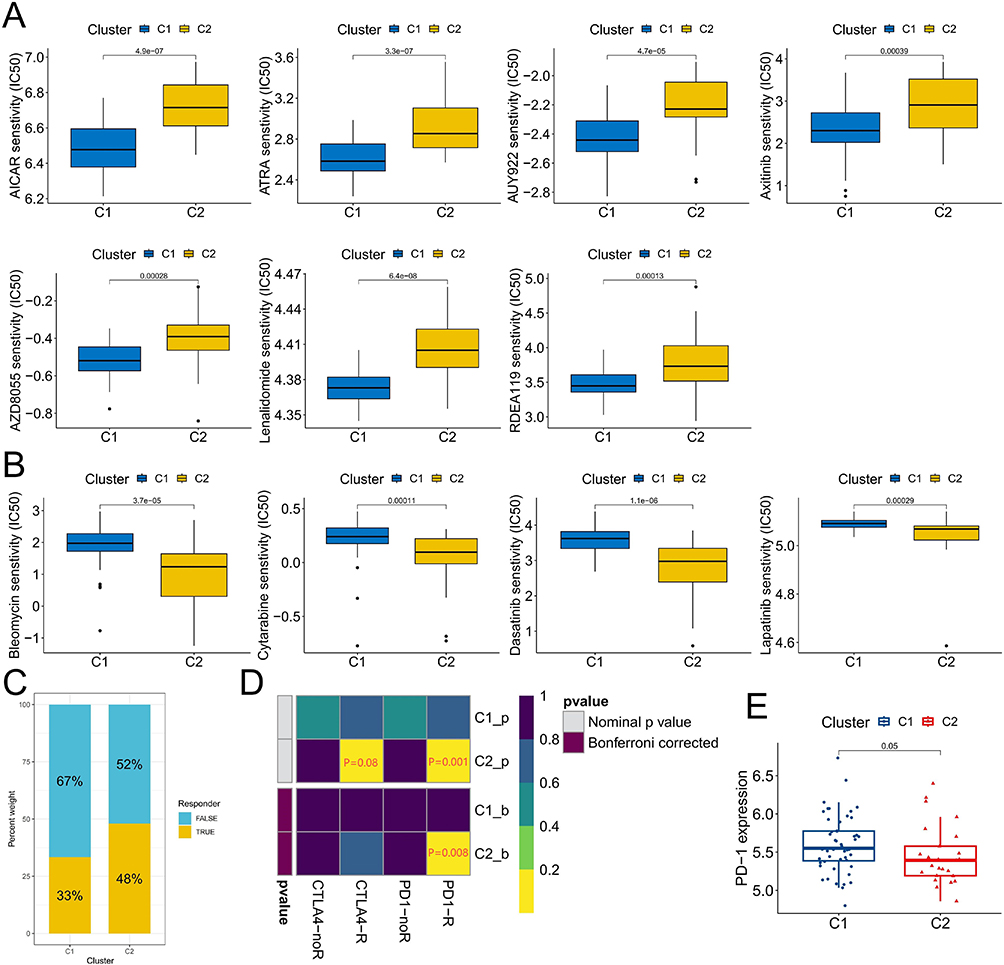 |
Figure 4 Sensitivity difference of chemotherapy and immunotherapy with different molecular subtypes. (A and B) Chemotherapeutic agents with significant sensitivity differences between C1 and C2 subtypes. (C) The proportion of patients responding to immunotherapy differed between C1 and C2 subtypes. (D) Prediction of reactivity to anti-PD-1 and anti-CTLA4 immunotherapy in patients with C1 and C2 subtypes. (E) Differences in PD-1 expression between C1 and C2 subtypes. |
Analysis and Validation of the Diagnostic Value of CSRG
We continue to analyze the diagnostic value of critical CSRGs. Analysis of the validation cohort GSE144119 revealed significant up-regulation of PLAU, CDK1, and IGFBP2 in primary CML samples, while IL7R and SUN1 were significantly down-regulated (Figure 5A). The expression patterns of PLAU, IGFBP2, IL7R, and SUN1 were consistent with those observed in GSE13159. It is noteworthy that the expression levels of five CSRGs in CML samples with TKI treatment remission returned to varying degrees toward normal sample levels (Figure 5B). These findings suggest that CSRGs are also effective predictors of TKI response in CML patients. Considering the opposite expression trend of CDK1 between the GSE13159 and GSE144119 cohorts, we evaluated the diagnostic performance using only the remaining four CSRGs. ROC curve analysis demonstrated AUC values for diagnosing CML as follows: IGFBP2 (0.794), IL7R (0.853), PLAU (0.808), and SUN1 (0.858) in the GSE13159 cohort (Figure 5C); and IGFBP2 (0.970), IL7R (0.958), PLAU (0.975), and SUN1 (0.944) in the GSE144119 cohort respectively (Figure 5D). These results indicate that these four CSRGs have high diagnostic value for CML across both analysis and validation cohorts.
 |
Figure 5 Identification and validation of the diagnostic value of the key CSRG. (A) Differences in expression of the five CSRGs between CML samples and normal samples in the GSE144119 cohort. (B) Differences in expression of the five CSRGs between primary CML samples and treatment-remission CML samples in the GSE144119 cohort. (C and D) ROC curve analysis was used to evaluate the diagnostic value of the five CSRGs in the GSE13159 (C) and GSE144119 (D) cohorts. *P < 0.05; ***P < 0.001. |
Validation of CSRG Expression in Clinical Samples and Determination of the Targeting Therapeutic Value of IGFBP2 in CML-Resistant Cells
To enhance the validation of the bioinformatics findings, we procured 5 normal samples and 10 CML samples for transcriptome sequencing. Through analysis of the sequencing data, it was observed that PLAU and IGFBP2 expressions were significantly upregulated in CML samples, while IL7R and SUN1 were markedly downregulated (Figure 6A). This trend aligned with the expression pattern observed in two sets of publicly available datasets, affirming the reliability of our bioinformatics analysis results. Subsequently, our focus shifted to IGFBP2 due to its most substantial upregulation within the analyzed cohort. By examining K562/IR cells and imatinib-resistant cells (K562/IR), we discovered a significant increase in IGFBP2 expression in K562/IR cells (Figure 6B), suggesting its potential involvement in therapeutic resistance development in CML. Upon silencing IGFBP2 expression in K562/IR cells (Figure 6C), the activity of resistant cells significantly decreased (Figure 6D), while the levels of apoptosis notably increased (Figure 6E and F). Furthermore, drug analysis revealed a significant reduction in imatinib resistance after the knockdown of IGFBP2 expression (IC50 values: 11.37 μM for the control group vs 4.1 μM for the knockdown group) (Figure 6G and H). These findings indicate that targeting IGFBP2 can effectively inhibit the activity of CML-resistant cells and improve therapeutic sensitivity to imatinib treatment; thus highlighting its potential as a clinical therapy target.
 |
Figure 6 Expression verification of CSRG in clinical samples and effect of targeted inhibition of IGFBP2 on CML resistant cells. (A) Differences in the expression of four CSRGS in 5 normal samples and 10 CML samples. (B) Expression difference of IGFBP2 in K562 and K562/IR cells. (C) IGFBP2 expression was knocked down in K562/IR. (D) The alterations in the activity of K562/IR cells between IGFBP2 knockdown and control groups. (E and F) The alterations in the apoptosis levels of K562/IR cells between IGFBP2 knockdown and control groups. (G and H) The IC50 values of K562/IR cells with IGFBP2 knockdown and control in response to imatinib treatment were compared. **P < 0.01; ***P < 0.001. |
Discussion
Thanks to the development of targeted inhibitors, significant progress has been made in the treatment of CML. However, due to individual heterogeneity, resistance may still emerge at different stages of treatment among CML patients. Therefore, personalized cancer management plays a crucial role in achieving precise treatment for CML patients, particularly those in the early and chronic stages. Currently, an increasing number of studies aim to identify subgroups of cancers based on genomic or transcriptomic alterations to assess prognosis and guide treatment decisions. Nevertheless, there is limited research on classifying CML during the chronic phase. To address this gap, we propose conducting a molecular profile analysis. Numerous studies have demonstrated that cellular senescence can not only inhibit cell proliferation through cycle arrest, but also induce growth arrest in tumor cells leading to chemotherapy resistance and impairing immune cell function by releasing related cytokines, thereby promoting tumor occurrence and malignant progression. Henceforth, exploring the expression characteristics of CSRGs holds important clinical value as it serves as a molecular basis for diagnosing and treating CML.
Compared to normal samples, CML samples exhibited a lower cellular senescence score, potentially attributed to the senescence resistance mediated by malignant proliferation of CML cells. However, as the senescence score of CML cells increased, we observed an augmented infiltration proportion of multiple immune effector cells, indicating that the senescence of CML cells may activate the immune system. Nevertheless, it further stimulates the expression of immune checkpoint genes to inhibit the cytotoxic effect of immune cells. This suggests that inducing senescence in CML cells combined with immunotherapy could be a beneficial approach for treating CML. Subsequently, we identified a group of CSRGs with distinct expression differences. Between the molecular subtypes identified through cluster analysis, subtype C2 was associated with significantly increased infiltration of CD8+ T cells and higher activity in immune-related signaling pathways; whereas subtype C1 was linked to stronger metabolic and DNA damage repair capabilities. These two groups of molecular subtypes displayed different sensitivities towards various chemotherapy agents while subtype C2 also demonstrated a significant increase in responsiveness to immunotherapy. These features reflect substantial biological disparities among different subtypes within CML patients and aid in enhancing our understanding of TME and cancer cell phenotypes.
Finally, we have demonstrated that IGFBP2, IL7R, PLAU, and SUN1 exhibit significant diagnostic value in CML and can predict therapeutic remission in CML patients through analysis of multiple public cohorts and clinical samples. Our focus was on IGFBP2, which showed significantly elevated expression in resistant CML cells. Experimental evidence confirmed that targeted inhibition of IGFBP2 effectively suppressed the activity of resistant CML cells, induced apoptosis, and enhanced the therapeutic sensitivity to imatinib. These findings collectively suggest that targeting IGFBP2 could be a promising approach for overcoming CML resistance. Furthermore, numerous studies have established the involvement of IGFBP2 in various diseases and tumors. Loss of IGFBP2 has been shown to induce senescence in alveolar type 2 cells and promote pulmonary fibrosis.26 In hepatocellular carcinoma, IGFBP2 drives epithelial-mesenchymal transition by activating the Wnt/β-catenin pathway.27 Additionally, in solid tumors, upregulation of IGFBP2 promotes several key processes associated with carcinogenesis including cell migration, invasion angiogenesis transcriptional activation as well as epigenetic programming.28 Accumulating evidence suggests that aberrant expression of IGFBP2 acts as a central node within the carcinogenic network by integrating multiple cancer signaling pathways;29 thus making it an attractive target for cancer therapy. Our study further underscores its significance in the development of CML resistance. However, our study also had certain limitations, such as a small clinical sample size and a lack of in vivo experiments. In future studies, we will aim to address these limitations by conducting multicenter large sample collection and exploring the therapeutic value of relevant targets through animal experiments.
Conclusion
We analyzed the expression characteristics of CSRG in CML and discovered that the senescence of CML cells may impede immune cell function through upregulation of immune checkpoints. The identification of molecular subtypes is essential for evaluating individual patients’ biological traits and guiding clinical treatment, with critical CSRG exhibiting significant diagnostic value for CML. Additionally, IGFBP2 has demonstrated potential as a target for therapy-resistant CML.
Data Sharing Statement
The original data used in this project can be downloaded in the public database GEO (https://www.ncbi.nlm.nih.gov/geo/).
Ethics Approval and Informed Consent
The study was conducted in accordance with the Declaration of Helsinki and approved by the appropriate Ethics Committee: Second Affiliated Hospital of Nanchang University (No. review. [2018] No. (092)).
Funding
The study was funded by the National Natural Science Foundation of China (82160405, 82160038, 82260035, 82301578), and the Natural Science Foundation of Jiangxi Province (20232BAB216037, 20232BAB216050, 20224BAB216037).
Disclosure
The authors declare that they have no conflicts of interest.
References
1. Jabbour E, Kantarjian H. Chronic myeloid leukemia: 2022 update on diagnosis, therapy, and monitoring. Am J Hematol. 2022;97(9):1236–1256. doi:10.1002/ajh.26642
2. Osman AEG, Deininger MW. Chronic Myeloid Leukemia: modern therapies, current challenges and future directions. Blood Rev. 2021;49:100825. doi:10.1016/j.blre.2021.100825
3. Hernandez-Segura A, Nehme J, Demaria M. Hallmarks of cellular senescence. Trends Cell Biol. 2018;28(6):436–453. doi:10.1016/j.tcb.2018.02.001
4. Herranz N, Gil J. Mechanisms and functions of cellular senescence. J Clin Invest. 2018;128:1238–1246. doi:10.1172/jci95148
5. Lopes-Paciencia S, Saint-Germain E, Rowell MC, Ruiz AF, Kalegari P, Ferbeyre G. The senescence-associated secretory phenotype and its regulation. Cytokine. 2019;117:15–22. doi:10.1016/j.cyto.2019.01.013
6. Papaconstantinou J. The role of signaling pathways of inflammation and oxidative stress in development of senescence and aging phenotypes in cardiovascular disease. Cells. 2019;8. doi:10.3390/cells8111383
7. Shmulevich R, Krizhanovsky V. Cell Senescence, DNA Damage, and Metabolism. Antioxid Redox Signal. 2021;34(4):324–334. doi:10.1089/ars.2020.8043
8. Jiang C, Liu G, Luckhardt T, et al. Serpine 1 induces alveolar type II cell senescence through activating p53-p21-Rb pathway in fibrotic lung disease. Aging Cell. 2017;16(5):1114–1124. doi:10.1111/acel.12643
9. Duan JL, Ruan B, Song P, et al. Shear stress-induced cellular senescence blunts liver regeneration through Notch-sirtuin 1-P21/P16 axis. Hepatology. 2022;75(3):584–599. doi:10.1002/hep.32209
10. Chen Q, Sun X, Luo X, et al. PIK3R3 inhibits cell senescence through p53/p21 signaling. Cell Death Dis. 2020;11(9):798. doi:10.1038/s41419-020-02921-z
11. Demaria M, O’Leary MN, Chang J, et al. Cellular senescence promotes adverse effects of chemotherapy and cancer relapse. Cancer Discov. 2017;7(2):165–176. doi:10.1158/2159-8290.Cd-16-0241
12. Knaus HA, Berglund S, Hackl H, et al. Signatures of CD8+ T cell dysfunction in AML patients and their reversibility with response to chemotherapy. JCI Insight. 2018;3(21). doi:10.1172/jci.insight.120974
13. Rutella S, Vadakekolathu J, Mazziotta F, et al. Immune dysfunction signatures predict outcomes and define checkpoint blockade-unresponsive microenvironments in acute myeloid leukemia. J Clin Invest. 2022;132(21). doi:10.1172/jci159579
14. Hoenicke L, Zender L. Immune surveillance of senescent cells--biological significance in cancer- and non-cancer pathologies. Carcinogenesis. 2012;33(6):1123–1126. doi:10.1093/carcin/bgs124
15. Hao X, Zhao B, Zhou W, et al. Sensitization of ovarian tumor to immune checkpoint blockade by boosting senescence-associated secretory phenotype. iScience. 2021;24(1):102016. doi:10.1016/j.isci.2020.102016
16. Liu W, Zhu X, Tang L, et al. ACSL1 promotes imatinib-induced chronic myeloid leukemia cell senescence by regulating SIRT1/p53/p21 pathway. Sci Rep. 2022;12(1):17990. doi:10.1038/s41598-022-21009-6
17. Xu Y, Zhao X, Li R, et al. Loss of the vitamin D receptor triggers senescence in chronic myeloid leukemia via DDIT4-mediated DNA damage. J Molecular Cell Biol. 2023;14(10). doi:10.1093/jmcb/mjad066
18. Zhu S, Xing C, Zhang G, Peng H, Wang Z. Icaritin induces cellular senescence by accumulating the ROS production and regulation of the Jak2/Stat3/p21 pathway in imatinib-resistant, chronic myeloid leukemia cells. Am J Transl Res. 2021;13(8):8860–8872.
19. Zhang H, Cai B, Liu Y, et al. RHOA-regulated IGFBP2 promotes invasion and drives progression of BCR-ABL1 chronic myeloid leukemia. Haematologica. 2023;108(1):122–134. doi:10.3324/haematol.2022.280757
20. Li SQ, Liu J, Zhang J, et al. Transcriptome profiling reveals the high incidence of hnRNPA1 exon 8 inclusion in chronic myeloid leukemia. J Adv Res. 2020;24:301–310. doi:10.1016/j.jare.2020.04.016
21. Ritchie M, Phipson B, Wu D, et al. limma powers differential expression analyses for RNA-sequencing and microarray studies. Nucleic Acids Res. 2015;43(7):e47. doi:10.1093/nar/gkv007
22. Hänzelmann S, Castelo R, Guinney J. GSVA: gene set variation analysis for microarray and RNA-seq data. BMC Bioinf. 2013;14(1):7. doi:10.1186/1471-2105-14-7
23. Subramanian A, Tamayo P, Mootha VK, et al. Gene set enrichment analysis: a knowledge-based approach for interpreting genome-wide expression profiles. Proc Natl Acad Sci. 2005;102(43):15545–15550. doi:10.1073/pnas.0506580102
24. Yoshihara K, Shahmoradgoli M, Martínez E, et al. Inferring tumour purity and stromal and immune cell admixture from expression data. Nat Commun. 2013;4(1):2612. doi:10.1038/ncomms3612
25. Newman A, Liu CL, Green MR, et al. Robust enumeration of cell subsets from tissue expression profiles. Nature Methods. 2015;12(5):453–457. doi:10.1038/nmeth.3337
26. Chin C, Ravichandran R, Sanborn K, et al. Loss of IGFBP2 mediates alveolar type 2 cell senescence and promotes lung fibrosis. Cell Rep Med. 2023;4(3):100945. doi:10.1016/j.xcrm.2023.100945
27. Chen X, Zhang Y, Zhang P, et al. IGFBP2 drives epithelial-mesenchymal transition in hepatocellular carcinoma via activating the Wnt/β-catenin pathway. Infect Agent Cancer. 2023;18(1):73. doi:10.1186/s13027-023-00543-6
28. Wei LF, Weng X, Huang X, et al. IGFBP2 in cancer: pathological role and clinical significance (Review). Oncol Rep. 2021;45(2):427–438. doi:10.3892/or.2020.7892
29. Li T, Forbes ME, Fuller GN, et al. IGFBP2: integrative hub of developmental and oncogenic signaling network. Oncogene. 2020;39(11):2243–2257. doi:10.1038/s41388-020-1154-2
 © 2024 The Author(s). This work is published and licensed by Dove Medical Press Limited. The
full terms of this license are available at https://www.dovepress.com/terms.php
and incorporate the Creative Commons Attribution
- Non Commercial (unported, 3.0) License.
By accessing the work you hereby accept the Terms. Non-commercial uses of the work are permitted
without any further permission from Dove Medical Press Limited, provided the work is properly
attributed. For permission for commercial use of this work, please see paragraphs 4.2 and 5 of our Terms.
© 2024 The Author(s). This work is published and licensed by Dove Medical Press Limited. The
full terms of this license are available at https://www.dovepress.com/terms.php
and incorporate the Creative Commons Attribution
- Non Commercial (unported, 3.0) License.
By accessing the work you hereby accept the Terms. Non-commercial uses of the work are permitted
without any further permission from Dove Medical Press Limited, provided the work is properly
attributed. For permission for commercial use of this work, please see paragraphs 4.2 and 5 of our Terms.
Recommended articles
Nanotechnology: A Promising Approach for Cancer Diagnosis, Therapeutics and Theragnosis
Dessale M, Mengistu G, Mengist HM
International Journal of Nanomedicine 2022, 17:3735-3749
Published Date: 26 August 2022
Updated Perspectives on the Diagnosis and Management of Onychomycosis
Falotico JM, Lipner SR
Clinical, Cosmetic and Investigational Dermatology 2022, 15:1933-1957
Published Date: 15 September 2022
Nontuberculous Mycobacteria Lung Disease (NTM-LD): Current Recommendations on Diagnosis, Treatment, and Patient Management
Pathak K, Hart S, Lande L
International Journal of General Medicine 2022, 15:7619-7629
Published Date: 1 October 2022
Leiomyoma with Bizarre Nuclei: A Current Update
Guo E, Li C, Hu Y, Zhao K, Zheng Q, Wang L
International Journal of Women's Health 2022, 14:1641-1656
Published Date: 25 November 2022
Challenges in the Early Diagnosis and Treatment of Chronic Inflammatory Demyelinating Polyradiculoneuropathy in Adults: Current Perspectives
van Doorn IN, Eftimov F, Wieske L, van Schaik IN, Verhamme C
Therapeutics and Clinical Risk Management 2024, 20:111-126
Published Date: 14 February 2024