")
Back to Journals » Journal of Inflammation Research » Volume 17
Identification of PANoptosis-Related Genes in Community-Acquired Pneumonia Diagnosis
Authors Hao Q , Gao W , Zhang P , Yan P
Received 9 October 2024
Accepted for publication 22 November 2024
Published 4 December 2024 Volume 2024:17 Pages 10289—10304
DOI https://doi.org/10.2147/JIR.S491315
Checked for plagiarism Yes
Review by Single anonymous peer review
Peer reviewer comments 2
Editor who approved publication: Professor Ning Quan
Qiaoxin Hao,1,* Wei Gao,2,* Pei Zhang,1,* Peng Yan2,*
1Department of Clinical Laboratory, China Aerospace Science & Industry Corporation 731 hospital, Beijing, 100074, People’s Republic of China; 2Pulmonary and Critical Care Medicine, China Aerospace Science & Industry Corporation 731 hospital, Beijing, 100074, People’s Republic of China
*These authors contributed equally to this work
Correspondence: Peng Yan, Pulmonary and Critical Care Medicine, China Aerospace Science & Industry Corporation 731 hospital, Beijing, 100074, People’s Republic of China, Tel +86-13581716731, Email [email protected]
Background: This study aimed to identify and characterize novel PANoptosis biomarkers for community-acquired pneumonia (CAP) diagnosis.
Methods: Transcriptomic data from training set GSE196399 and validation sets GSE94916 and GSE202947 were utilized. A PANoptosis gene set was identified by intersecting DEGs linked to CAP, WGCNA hub genes, and PANoptosis-related genes. GO and KEGG analyses were conducted for enrichment analysis. PANoptosis scores were calculated via ssGSEA. Feature genes were identified using SVM-RFE, LASSO regression, and RF methods. Diagnostic performance was assessed via ROC analysis. Immune cell infiltration was evaluated using CIBERSORT. A PPI network was constructed, and a nomogram was developed for CAP prediction. Drug-gene interactions were investigated. qRT-PCR was conducted to confirm feature gene alterations in clinical samples.
Results: We identified 7555 DEGs associated with CAP from the GSE196399 dataset. Through WGCNA, a PANoptosis gene set of 39 genes was found, showing significant enrichment in pathways related to apoptosis and inflammation. CAP patients exhibited significantly reduced PANoptosis scores compared to healthy controls, with a marked upregulation in the majority of the PANoptosis gene set in high-score individuals. Four feature genes (ZNF304, AKT3, MAPK8, and ARHGAP10) were identified as potential biomarkers, exhibiting high diagnostic accuracy with AUCs generally above 0.8. These genes also showed significant correlations with M0 macrophages and neutrophils. Drug-gene interaction analysis revealed potential therapeutic agents targeting MAPK8 and AKT3. Validation in clinical samples confirmed gene expression alterations in CAP patients.
Conclusion: The identified PANoptosis feature genes demonstrate high diagnostic accuracy for CAP, serving as potential biomarkers and therapeutic targets for CAP.
Keywords: community-acquired pneumonia, PANoptosis, diagnosis, neutrophil infiltration, machine learning, biomarkers
Introduction
Pneumonia is a respiratory infection characterized by inflammation of the lung tissue, representing one of the leading causes of morbidity and mortality worldwide.1,2 Annually, pneumonia impacts approximately 450 million individuals worldwide, leading to 2.5 million deaths.3 Pneumonia is categorized into four primary types: community-acquired, hospital-acquired, healthcare-associated, and ventilator-associated. Among these, community-acquired pneumonia (CAP), a lung infection contracted outside healthcare settings, is the leading cause of death among infectious diseases.4 Early and accurate diagnosis of CAP is essential to guide antibiotic selection, reduce unnecessary broad-spectrum antibiotic use, and limit the development of antibiotic resistance.5 Additionally, early identification enables timely interventions to prevent complications, thereby improving patient outcomes.6 In cases involving airborne pathogens, early diagnosis and treatment can prevent further disease transmission, contributing to the protection of public health.7 Biomarkers play a vital role in the early diagnosis and management of CAP by providing measurable indicators of disease presence, severity, and response to treatment. Despite the development of specific biomarkers like procalcitonin, pro-adrenomedullin, and presepsin for CAP diagnosis, biomarkers with higher sensitivity, specificity, and easy testing procedures are still needed.8
PANoptosis refers to a programmed cell death pathway characterized by the involvement of multiple cell death mechanisms, including apoptosis, necroptosis, and pyroptosis. This process is critical for maintaining cellular homeostasis and is implicated in various pathological conditions, including pulmonary diseases.9 In CAP, pathogens such as Yersinia pestis and Francisella novicida can induce acute respiratory distress syndrome (ARDS) by activating PANoptosis. For instance, Y. pestis engages the RIPK1-PANoptosome through TAK1 inhibition, whereas F. novicida triggers the AIM2-PANoptosome via type I interferon signaling.10,11 These pathogens, regardless of being intracellular or extracellular, are ultimately engulfed by immune cells like macrophages and neutrophils.12–15 This process can induce PANoptosis and subsequently promote neutrophilic lung inflammation, suggesting a critical role of PANoptosis in the immune response to CAP.16 PANoptosis-related biomarkers have been reported in lung infectious diseases like tuberculosis and COVID-19;17,18 however, a comprehensive understanding of these biomarkers in CAP is still lacking.
In this study, we aimed to identify circulating PANoptosis-related biomarkers for CAP diagnosis. We analyzed gene expression data from CAP patients and healthy controls to identify differentially expressed genes (DEGs) and conducted a weighted gene co-expression network analysis (WGCNA) to uncover key gene modules associated with CAP. We identified PANoptosis-related biomarkers using machine learning algorithms, created a predictive nomogram, and validated our findings through qRT-PCR in clinical samples. The results may pave the way for the development of targeted therapeutic strategies and enhance the precision of CAP diagnosis, ultimately contributing to improved patient outcomes and personalized treatment approaches.
Materials and Methods
Data Collection and Preprocessing
Gene expression data were obtained from the GEO database (https://www.ncbi.nlm.nih.gov/geo/), including datasets GSE196399 (comprising severe CAP cases and healthy controls), GSE94916 (including pneumonia, malaria infection, and healthy controls), and GSE202947 (consisting of Chlamydia psittaci pneumonia, bronchitis, and healthy controls). Only pneumonia and healthy control samples were used for further analysis. Sample information is summarized in Table 1. GSE196399 was used as a training dataset, while GSE94916 and GSE202947 were used as validation datasets. Probes were mapped to gene symbols, and undetected probes were eliminated. When multiple probes corresponded to the same gene, the median was considered the expression value for that gene. PANoptosis-related genes were obtained as previously described.19
 |
Table 1 Sample Type and Size |
Identification of DEGs
Differential gene expression analysis between CAP cases and healthy controls was conducted on the GSE196399 dataset using the R package “limma”. Genes with a P-value < 0.05 and |logFC| > 0.5 were considered DEGs. The Benjamini-Hochberg method was applied to adjust for multiple testing, reducing the false discovery rate.
Wgcna
A WGCNA network was constructed using the “WGCNA” R package to investigate gene modules associated with CAP in GSE196399. Before constructing the network, gene expression data were preprocessed by filtering for the top 50% of genes with the highest variance across samples, ensuring that only the most variable genes were included in the analysis. Outliers were identified and removed based on clustering dendrograms to improve the reliability of network construction. The soft threshold for network construction was determined based on the scale-free topology criterion to ensure network robustness. The adjacency matrix was constructed with a power of β, chosen to achieve an approximate scale-free topology, followed by transformation into a topological overlap matrix to measure the network’s interconnectedness. Gene modules containing more than 30 genes were identified using hierarchical clustering with a merged similarity threshold set at 0.25. Unique colors were assigned to each module. Furthermore, modules underwent additional screening by assessing their correlation with phenotype. Hub genes within these modules were identified using dual criteria: |module membership (MM)| > 0.6 and |gene significance (GS)| > 0.5. The overlapping genes of DEGs, hub genes, and PANoptosis-related genes were selected as a PANoptosis gene set for subsequent analysis.
Functional Enrichment Analysis
The PANoptosis gene set underwent Gene Ontology (GO) and Kyoto Encyclopedia of Genes and Genomes (KEGG) functional enrichment analyses using the R package “clusterProfiler”. Pathways with an adjusted P-value < 0.05, determined by the Benjamini-Hochberg method, were considered significantly enriched.
Single-Sample Gene Set Enrichment Analysis (ssGSEA)
The PANoptosis score of each sample in the GSE196399 dataset was evaluated through ssGSEA using the “GSVA” package based on the expression levels of the PANoptosis gene set. The subjects in the GSE196399 dataset were classified into high and low-score groups based on the median score. The distribution of the patient scores was visualized using the R package “Rtsne” and principal component analysis (PCA).
Immune Cell Infiltration
The infiltration of 22 immune cell types was evaluated using the “CIBERSORT” algorithm. The differences in immune microenvironment between high and low-score groups were examined. Only samples with a CIBERSORT P-value < 0.05 were included to ensure accuracy in estimated cell fractions.
Identification of Feature Genes
Feature genes were identified in the overlapping genes among DEGs, hub genes, and PANoptosis-related genes using three algorithms: Support Vector Machine-Recursive Feature Elimination (SVM-RFE), Least Absolute Shrinkage and Selection Operator (LASSO) regression, and Random Forest (RF). SVM-RFE was performed using the radial basis kernel function “SVM” from the R package “caret”. The parameters for feature gene selection were as follows: in “rfeControl”, functions = “caretFuncs”; in the “rfe” function, method = “svmRadial”. LASSO regression analysis was conducted using the “glmnet” package in R. The optimal penalty parameter λ was determined based on a minimum criterion. Genes with non-zero coefficients were considered the optimal variables. Gene ranking was carried out using the RF algorithm, with genes having a Gini coefficient greater than 1 considered significant features. The intersecting genes obtained through these three algorithms were considered feature genes.
Protein-Protein Interaction (PPI) Network
To investigate the interaction between feature genes and functionally related genes, a PPI network was constructed using GeneMANIA (https://cn.string-db.org/). All interactions were cross-referenced with the STRING database to confirm known protein associations.
Nomogram Construction and Evaluation
A nomogram was constructed based on the feature genes using the R packages “rms”. The clinical decision-making performance of the nomogram was assessed through calibration curves utilizing the “calibrate” function from the R package “rms” and decision curve analysis (DCA) curves employing the “dca” function from the R package “ggDCA”.
Drug-Gene Interaction Analysis
The interaction between drugs and feature genes was explored using the drug-gene interaction database (DGIdb, www.dgidb.org)20. Results were filtered for FDA-approved drugs to focus on clinically actionable interactions. The interaction network was visualized using Cytoscape software.
qRT-PCR
Patient samples and healthy control samples were obtained as part of the routine hospital testing procedures during diagnosis. qRT-PCR was employed to determine the mRNA levels of feature genes in the blood samples from five CAP patients and five healthy controls recruited from China Aerospace Science & Industry Corporation 731 hospital. The inclusion criteria were CAP. The exclusion criteria were Children, pregnant women, and patients who have taken medication. The study was approved by the Ethical Committee of China Aerospace Science & Industry Corporation 731 hospital (No. 2024-0301-05). Informed consent was obtained from each participant. Total RNA was isolated from the blood samples using the TRNzol kit (DP405-02) following the manufacturer’s instructions. Subsequently, cDNA was synthesized using a reverse transcription kit (R312-01). qRT-PCR reactions were conducted using the Axygen real-time PCR system (PCR-96-FLT-C). GAPDH was used as the reference gene. Each sample was run in triplicate to ensure accuracy. Relative expression levels were calculated using the 2−ΔΔCt method. The primer sequences are summarized in Table 2.
 |
Table 2 qRT-PCR Primers |
Statistical Analysis
Statistical analysis was conducted using R (v4.3.0). PCA was performed and visualized using the R packages “FactoMineR” and “factoextra”. Heatmaps were visualized using the “pheatmap” package. Venn diagrams were created using the “ggvenn” package. Receiver operating characteristic (ROC) curves were visualized using the “pROC” package. Correlation between feature genes was analyzed and visualized using the “ggpairs” package. Graphs were generated using “ggplot2” or “plot” unless specific descriptions were provided. Correlation analysis was performed using the Pearson method. Continuous and categorical variables between two groups were compared using the Wilcoxon test and the Chi-square test, respectively. A P-value less than 0.05 was considered statistically significant.
Results
Identification of DEGs Associated with CAP
To identify DEGs associated with CAP, we analyzed transcriptomic data obtained from the GSE196399 dataset, which comprises whole blood samples from 56 individuals with severe CAP and 21 healthy subjects. PCA showed the separation of the two groups (Figure 1A). The differential gene expression analysis yielded 7555 DEGs, with 1028 upregulated and 6527 downregulated in CAP samples (Figure 1B, Table S1). The heatmap displays the expression profiles of the top 20 DEGs ranked by fold change (Figure 1C).
 |
Figure 1 Identification of differentially expressed genes (DEGs) associated with community-acquired pneumonia (CAP). DEGs associated with CAP were identified using transcriptomic data obtained from the GSE196399 dataset, which comprises whole blood samples from 56 individuals with severe CAP and 21 healthy subjects. (A) Principal component analysis (PCA) reveals the separation of the two groups. (B) A volcano plot displays the statistical significance (p-value) against the magnitude of change (fold change) in gene expression between the two groups. Points above the horizontal line represent significantly differentially expressed genes, with red indicating upregulation and blue downregulation. (C) A heatmap displays the expression profiles of the top 20 DEGs ranked by fold change. (D) Sample clustering dendrogram to detect outliers within the GSE196399 dataset. (E) Determination of the scale-free topology fit index (y-axis) and the mean connectivity (right y-axis) against the soft-thresholding power (x-axis). (F) A cluster dendrogram of genes, with each color representing different gene modules. (G) A heat map of module-trait relationships, with red indicating a positive correlation and blue indicating a negative correlation. (H) A scatterplot of module eigengenes. (I) A Venn diagram shows the overlap between DEGs, genes identified in the turquoise module, and PANoptosis-related genes. (J) GO analysis of the enriched biological processes, cellular components, and molecular functions of the PANoptosis gene set. (K) KEGG analysis of the enriched pathways associated with the PANoptosis gene set. Dot size represents the count of genes involved, and color denotes the significance level (p.adjust) from high (red) to low (blue). |
Identification and Characterization of a PANoptosis Gene Set Related to CAP
To identify core gene modules related to CAP, we conducted WGCNA on the GSE196399 dataset. Three outliers were found in initial sample clustering (Figure 1D). To establish an optimal scale-free topology and connectivity, we set the soft threshold β to 10 (Figure 1E). Utilizing hierarchical clustering, we categorized the genes into 11 modules (Figure 1F). Notably, the turquoise module exhibited the highest correlation (R = 0.65) with CAP samples (Figure 1G). By applying the criteria GS > 0.5 and |MM| > 0.6, we identified 3313 hub genes in the turquoise module (Figure 1H, Table S2). The intersection of DEGs, hub genes, and PANoptosis-related genes resulted in the identification of a PANoptosis gene set consisting of 39 genes (Figure 1I). GO analysis revealed that the gene set was significantly involved in biological processes such as peptidyl-serine phosphorylation and modification, cellular components like membrane rafts and PML bodies, as well as molecular functions such as protein serine/threonine kinase activity and ubiquitin protein ligase binding (Figure 1J, Table S3). KEGG analysis showed that the PANoptosis gene set was significantly enriched in apoptosis and various infection and inflammation-related pathways like human T-cell leukemia virus 1 infection and NF-kappa B signaling pathway (Figure 1K, Table S4).
Differential PANoptosis Scores and Immune Cell Correlations in CAP Patients
The PANoptosis scores for each sample in the GSE196399 dataset were obtained using ssGSEA based on the expression levels of the PANoptosis gene set. Patient samples had significantly lower PANoptosis scores compared to the control group (Figure 2A). Patient samples were then stratified into two groups based on their median PANoptosis scores: high and low. These groups exhibited distinct clustering patterns (Figure 2B and C). In the high-score group, 35 out of 39 genes in the PANoptosis gene set exhibited significant upregulation, constituting approximately 89.7% of the gene set (Figure 2D). The heatmap illustrated a distinct pattern of gene expression differentiation between the two groups (Figure 2E). These data suggest that PANoptosis-related pathways may exhibit reduced activity in the high-score group. We further evaluated the correlation between PANoptosis genes and various immune cell types (Figure 2F). Significant differences were observed in nine immune cell types between high and low-score groups. Notably, neutrophils were the predominant cell type across all patient samples and exhibited a significant negative correlation with most of the PANoptosis gene set. Patients with higher PANoptosis scores showed a significantly lower proportion of neutrophils compared to those with lower scores (Figure 2G and H).
 |
Figure 2 PANoptosis score analysis and immune cell correlation in GSE196399 Dataset. (A) A comparison of PANoptosis scores between patient and control samples in the GSE196399 dataset. (B and C) PCA (B) and t-distributed stochastic neighbor embedding (t-SNE) plot (C) show the clustering of samples based on their PANoptosis scores. (D) A comparison of PANoptosis gene expression levels between patients with high and low PANoptosis scores. (E) A heatmap with hierarchical clustering displays PANoptosis gene expression patterns across different PANoptosis score categories. Red represents high expression, and blue represents low expression. (F) Correlation analysis between PANoptosis genes and immune cell types. Color gradient represents correlation strength, and circle size indicates statistical significance. (G) A comparison of the proportions of immune cell types between patients with high and low PANoptosis scores. (H) The percentage distribution of immune cell types between the high and low PANoptosis score groups. *P < 0.05, **P < 0.01, ***P < 0.001, ****P < 0.0001. |
Identification of Feature Genes
To identify feature PANoptosis genes for CAP diagnosis, we employed machine learning algorithms on the gene set comprising 39 PANoptosis genes. The LASSO regression model screened 7 genes with non-zero coefficients based on the minimal lambda value (Figure 3A and B). The SVM-RFE method exhibited optimal model accuracy with a feature gene number of 38 (Figure 3C). Additionally, the RF model achieved error rate stabilization when the number of trees (ntree) exceeded 400 (Figure 3D) and demonstrated the lowest error rate at an mtry value of 4 (Figure 3E), resulting in 13 genes with a Gini coefficient greater than 1 (Figure 3F). By intersecting the features identified by all three algorithms, we determined four feature genes: ZNF304, AKT3, MAPK8, and ARHGAP10 (Figure 3G). These genes could potentially serve as biomarkers for CAP diagnosis upon further validation.
 |
Figure 3 Application of various machine learning algorithms to identify PANoptosis gene features for the diagnosis of CAP. (A) LASSO regression was utilized to reduce the complexity of the model by penalizing the absolute size of the regression coefficients, resulting in seven genes with non-zero coefficients. (B) A cross-validation curve for model tuning to select the optimal lambda value that minimizes the mean squared error. (C) A model accuracy plot for the Support Vector Machine-Recursive Feature Elimination (SVM-RFE) method, indicating the highest model accuracy with the inclusion of 38 feature genes. (D–F) In a random forest (RF) model, the error rate stabilized beyond 400 trees (D). The lowest error rate occurred with an mtry value of 4 (E). The MeanDecreaseGini plot identified 13 genes with Gini coefficients exceeding 1 (F). (G) A Venn diagram highlighted four genes (ZNF304, AKT3, MAPK8, and ARHGAP10) by intersecting features from the LASSO, SVM-RFE, and RF algorithms. |
Feature Genes are Downregulated and Interconnected in CAP Datasets
Then, we examined the expression patterns of the four feature genes in the training and validation datasets. All four feature genes demonstrated significant downregulation or a trend towards downregulation in patient samples compared to control samples (Figure 4A–C). Using the GeneMANIA database, we established an interaction network of the feature genes (Figure 4D). In the GSE196399 dataset, correlation analysis revealed significant and positive correlations among these genes (Figure 4E). These data suggest that the identified feature genes are involved in disease pathogenesis, serving as potential diagnostic biomarkers.
 |
Figure 4 Expression and correlation analysis of PANoptosis feature genes in CAP datasets. (A–C) The expression patterns of four feature genes in the training (GSE196399) and validation (GSE94916 and GSE202947) datasets for CAP. (D) An interaction network for these genes was established using the GeneMANIA database. (E) In the GSE196399 dataset, significant and positive correlations among the feature genes were observed. *P < 0.05, **P < 0.01, ****P < 0.0001. |
Diagnostic Efficacy of Feature Genes in CAP
To examine the diagnostic potential of the feature genes for CAP, we constructed a nomogram to visualize the predictive power of each gene (Figure 5A). The calibration curve showed that the nomogram’s predicted probabilities of CAP closely aligned with the actual observed outcomes (Figure 5B). The results of DCA demonstrated that the combined model based on all four feature genes offered greater clinical benefit than models based on individual genes (Figure 5C). Additionally, ROC analysis indicated high diagnostic performance for ZNF304, AKT3, and MAPK8 with AUCs consistently above 0.8, and good diagnostic potential for ARHGAP10, although its AUCs were slightly lower in some datasets (Figure 5D–F). These data suggest that the combined application of the feature genes offers superior diagnostic accuracy for CAP.
 |
Figure 5 Diagnostic efficacy of feature genes in CAP assessed by nomogram and ROC analysis. (A) A nomogram was established to visualize the predictive power of ZNF304, AKT3, MAPK8, and ARHGAP10 for CAP diagnosis. (B) A calibration curve was generated to demonstrate the alignment between the nomogram’s predicted probabilities and actual outcomes. (C) A decision curve analysis (DCA) was performed to show the superior clinical benefit of the combined gene model over individual gene models. (D–F) ROC analysis was conducted for the genes across the training (GSE196399) and validation (GSE94916 and GSE202947) datasets. |
Differential Immune Cell Distribution and Correlation with Feature Gene Expression
To investigate the differences in the immune microenvironment between patients and controls, we compared the abundance of immune cell subpopulations in the GSE196399 dataset. The distribution of immune cells across different samples is shown in Figure 6A. We observed significant differences in 12 types of immune cells between the patient and control groups. Notably, neutrophils showed a prominent increase in the patient group compared to the control group (Figure 6B). AKT3 and MAPK8 showed the strongest negative correlation with M0 macrophages. ARHGAP10 and ZNF304 were most negatively correlated with neutrophils. All four feature genes exhibited the strongest positive correlation with resting CD4 memory T cells (Figure 6C–F).
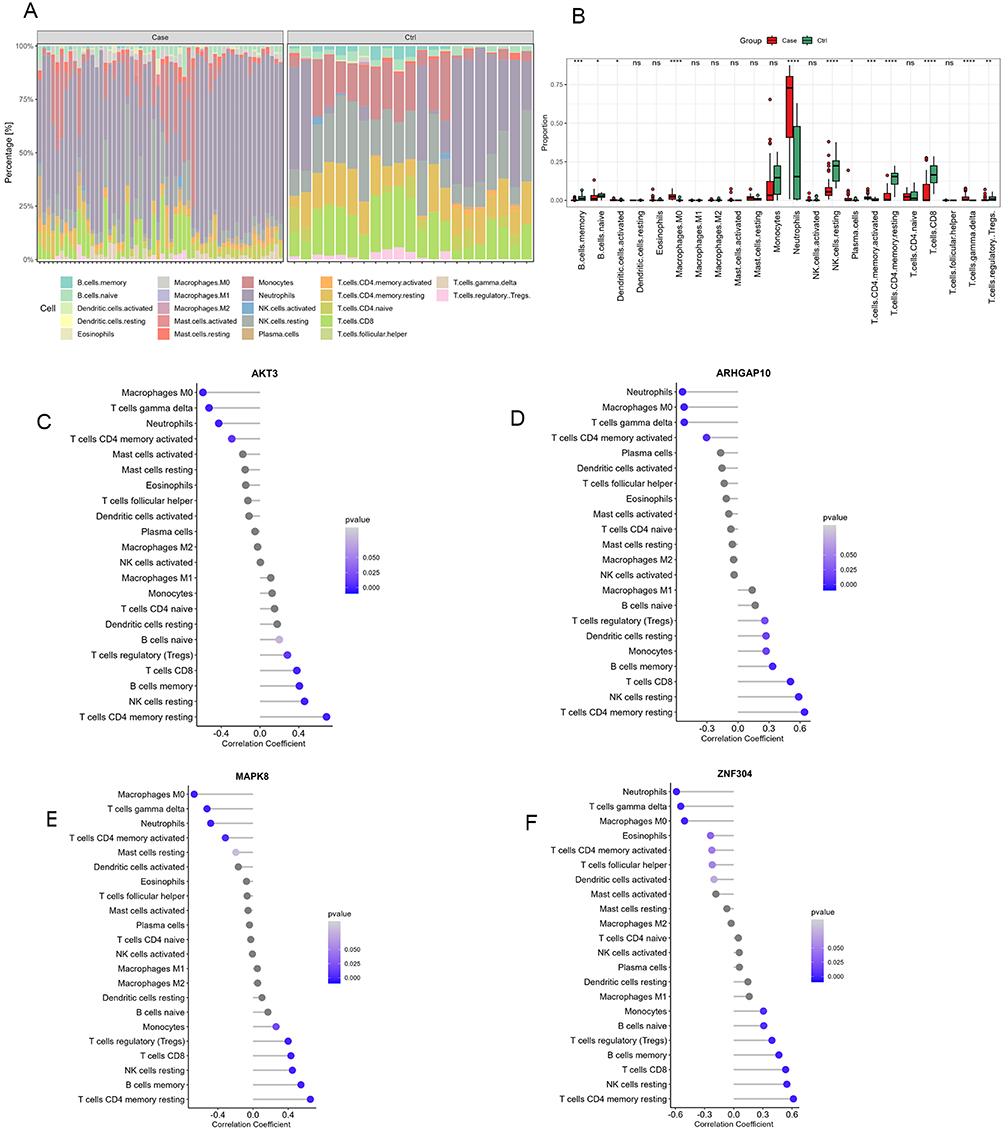 |
Figure 6 Differential immune cell distribution and correlation with feature gene expression. (A) A stacked bar chart demonstrates the proportions of various immune cell types across individual samples in the GSE196399 dataset. (B) A box plot shows a comparative analysis of the proportions of various immune cell types between patients and control samples in the GSE196399 dataset. (C–F) The correlation between the expression of feature genes and the abundance of immune cell subpopulations. *P < 0.05, **P < 0.01, ***P < 0.001, ****P < 0.0001. |
Analysis of Drug-Gene Interactions
To illustrate the pharmacogenomic interactions of the feature genes, we constructed a network diagram using the DGIdb. The results revealed the drugs that interact with MAPK8 and AKT3 (Figure 7 and Table S5). These agents represent various therapeutic classes, including antibiotics like Doxycycline, anticancer agents like Bleomycin, immunosuppressants like Everolimus, tyrosine kinase inhibitors like Pazopanib, hormones like Oxytocin, and vitamins like Alpha-Tocopherol. This suggests a pharmacological network where these drugs may modulate the activity of the MAPK8 and AKT3 pathways in the pathophysiology of CAP, targeting inflammation, cell proliferation, and survival mechanisms related to the disease.
 |
Figure 7 Drug-gene interaction network. A drug-gene interaction network was established using data sourced from the Drug-Gene Interaction database (DGIdb). |
Validation of Feature Gene Alterations in Clinical Samples
To validate feature gene alterations in clinical samples, we collected blood samples from five CAP patients (2 males, 3 females; age range: 15 to 77 years) and five healthy controls (1 male, 4 females; age range: 26 to 45 years; Table 3). The results of qRT-PCR showed that ZNF304 and ARHGAP10 mRNA levels were substantially decreased in CAP samples compared to those in control samples, whereas AKT3 and MAPK8 mRNA levels were remarkably increased (Figure 8). The contradiction in gene expression between datasets and clinical samples may attribute to technical, biological, or methodological variances, necessitating further validation with larger cohorts to elucidate the roles of AKT3 and MAPK8 in CAP pathogenesis.
 |
Table 3 Demographic Characteristics of Patients with Community-Acquired Pneumonia and Healthy Controls (Han Chinese) |
 |
Figure 8 Validation of feature gene alterations in clinical samples. qRT-PCR was performed to determine mRNA expression of ARHGAP10, MAPK8, AKT3, and ZNF304 in XXX samples from CAP patients and healthy controls. Data are expressed as the mean ± standard deviation. **P < 0.01, ***P < 0.001, n = 5. |
Discussion
In this study, we identified DEGs associated with CAP by analyzing transcriptomic data from the GSE196399 dataset. Through WGCNA, we identified a PANoptosis gene set comprising 39 genes significantly correlated with CAP. These genes were enriched in pathways related to apoptosis, infection, and inflammation. Patients exhibited lower PANoptosis scores and differential immune cell distributions compared to controls, with neutrophils showing a prominent increase. Machine learning algorithms identified four feature genes (ZNF304, AKT3, MAPK8, and ARHGAP10) with potential diagnostic utility. These genes showed interconnectivity and strong correlations with immune cell subpopulations, suggesting they are actively involved in CAP-specific immune responses and may serve as biomarkers for diagnosing CAP. Pharmacogenomic analysis revealed potential drug interactions with MAPK8 and AKT3, offering avenues for targeted therapies. Furthermore, qRT-PCR validation in clinical samples supported the dysregulation of feature genes in CAP, underscoring their promise for clinical application in CAP diagnosis and treatment optimization. From a clinical perspective, the identified feature genes show the potential to improve CAP diagnosis and patient management. As biomarkers, ZNF304, AKT3, MAPK8, and ARHGAP10 could enable early and precise CAP identification, particularly by distinguishing it from other respiratory infections for timely intervention. Targeting MAPK8 and AKT3 for their roles in inflammation and immune modulation also supports therapeutic strategies aimed at reducing disease severity. Integrating these genes into diagnostic protocols and targeted therapies could enhance CAP outcomes through accurate diagnosis and personalized treatment, addressing a critical need in CAP care.
Similar bioinformatics approaches, as utilized in recent studies on brain metastasis and autoimmune colitis, provide a precedent for exploring disease-specific gene sets and cellular interactions. In brain metastasis, advanced RNA-sequencing techniques, such as single-cell RNA sequencing, have proven effective in elucidating complex cellular and immune interactions within the tumor microenvironment.21 Meanwhile, studies on autoimmune colitis emphasize the importance of identifying distinct immune cell populations and gene sets relevant to inflammatory responses.22 Together, these approaches underscore the utility of high-resolution transcriptomic profiling for understanding cellular interactions and disease mechanisms.
The identification of ZNF304, AKT3, MAPK8, and ARHGAP10 as feature genes associated with PANoptosis and their downregulation in CAP datasets, along with an inverse relationship with PANoptosis scores, presents a nuanced and complex biological scenario. PANoptosis is a critical immune response mechanism.23 The downregulation of these genes in CAP patients across different datasets, who exhibited lower PANoptosis scores than healthy controls, suggests a compromised PANoptosis pathway, potentially leading to inadequate immune response to infection.24 The upregulation of these genes in patients with higher PANoptosis scores indicates a more active PANoptosis response, which might reflect the body’s effort to combat infection more effectively. The variance in gene expression and PANoptosis scores between patients with CAP and those with higher PANoptosis scores may reflect differences in the stage of infection, individual genetic predispositions, or the influence of other regulatory mechanisms controlling PANoptosis.
To the best of our knowledge, there is no direct evidence linking ZNF304 (ZNF304) and ARHGAP10 (Rho GTPase activating protein 10) to CAP. ZNF304 is known to be involved in gene regulation, including DNA methylation processes, and has been studied primarily in cancer and genetic regulation.25,26 ARHGAP10 is known for its role in cell signaling, particularly in actin cytoskeleton organization and Rho GTPase signaling pathways, which are crucial for cell morphology, migration, and immune cell function.27,28 AKT3 (RAC-gamma serine/threonine-protein kinase) is a critical component of the AKT signaling pathway, playing a significant role in regulating inflammation and immune responses.29,30 Alterations in AKT3 activity could potentially influence the body’s response to infections, including CAP. AKT3 modulates the immune response and ferroptosis in lung epithelial cells via the AKT3/GPX4 pathway, thereby playing a pivotal role in mitigating lung injury in ventilator-associated pneumonia.31 MAPK8 (Mitogen-Activated Protein Kinase 8), through its involvement in inflammation and apoptosis pathways,32,33 could influence the severity and progression of CAP. It is implicated in multiple signaling pathways related to the treatment of infantile pneumonia, novel coronavirus pneumonia, and influenza viral pneumonia.34–37 Our results underscore the novel identification of these genes as diagnostic genes for CAP, paving the way for innovative approaches in the diagnosis and treatment of the disease.
Neutrophils play a critical role in CAP by mounting an initial innate immune response against bacterial invasion in the lung, yet excessive neutrophil-mediated inflammation can contribute to the severity of the disease.38 In our study, neutrophil levels were notably elevated in CAP patients compared to controls but decreased in patients with high PANoptosis scores. Neutrophils showed a significant negative correlation with nearly 90% of the PANoptosis gene set, including the feature genes. These findings suggest a potential regulatory role of PANoptosis in modulating neutrophil responses in CAP patients. Droemann et al have reported that in patients with CAP, pulmonary neutrophils exhibit decreased apoptosis rates and heightened activation status compared to systemic neutrophils, contributing to prolonged immune responses and tissue damage within the pulmonary compartment.39 Neutrophil extracellular traps (NETs) release bacterial DNA, exacerbating inflammation and tissue damage in ARDS.16 Similarly, in idiopathic pulmonary fibrosis, neutrophils contribute to fibrotic lung tissue remodeling through the production of chemokines and neutrophil elastase from NETs, exacerbating epithelial cell apoptosis and fibroblast proliferation.40 These findings highlight the intricate relationship between neutrophils, PANoptosis, and pulmonary pathology.
Notably, AKT3 and MAPK8 showed the strongest negative correlation with M0 macrophages, suggesting a potential role in modulating macrophage polarization in CAP. Studies have shown that AKT3 plays a critical role in macrophage polarization, facilitating the modulation between M1 and M2 phenotypes by regulating various signaling pathways and functions including phagocytosis, autophagy, and cell metabolism, thus contributing to the regulation of inflammatory responses and macrophage biology.41 AKT3 modulates macrophage-mediated inflammation and ferroptosis in lung epithelial cells, and depletion of macrophages in ventilator-associated pneumonia alleviates lung injury.31 MAPK8 is expressed in alveolar macrophages, epithelial cells, vascular endothelial cells, and lymphocytes in the lung.42 Inhibition of MAPK8 by lipoxin A4 receptor agonist BML-111 in alveolar macrophages leads to enhanced autophagy, reduced apoptosis, and decreased inflammation, contributing to the mitigation of acute lung injury.43 These findings suggest that AKT3 and MAPK8 represent promising therapeutic targets in the treatment of CAP, potentially through modulating macrophage polarization and function. This aligns to our drug-gene interaction results showing that drugs targeting MAPK8 and AKT3 could serve as versatile therapeutic agents in CAP management.
One limitation of the study is the reliance on transcriptomic data from a single dataset, which may not fully capture the complexity and heterogeneity of CAP pathogenesis. Additionally, the sparsity and noise often present in transcriptomic data, particularly in single-cell data, could impact the robustness of PANoptosis score calculations and DEG identification. The study’s focus on whole blood samples further limits insights into tissue-specific gene expression patterns, and the absence of detailed clinical information in available public databases restricts subgroup analysis based on CAP severity. Finally, the functional roles and clinical implications of the identified feature genes require further experimental validation in larger patient cohorts and functional assays.
Conclusions
In conclusion, we identified a PANoptosis gene set enriched in key pathways implicated in infection and inflammation in CAP. Moreover, we found a panel of feature genes, including ZNF304, AKT3, MAPK8, and ARHGAP10, that exhibit promise as diagnostic biomarkers for CAP. Furthermore, we observed differential immune cell distributions and correlations with feature gene expression. Pharmacogenomic analysis revealed potential therapeutic targets, emphasizing the translational implications of our findings. These results may contribute to a deeper understanding of CAP pathogenesis and offer valuable insights for the development of novel diagnostic and therapeutic strategies. Future studies should focus on experimental validation of PANoptosis-related pathways and gene functions in CAP models, and integrating proteomic and metabolomic data could provide a more comprehensive understanding of PANoptosis in CAP.
Data Sharing Statement
All data generated or analyzed during this study are included in this article and its Supplementary Information file.
Informed Consent Statement
Informed consent was obtained from all subjects involved in the study.
Institutional Review Board Statement
The study was conducted in accordance with the Declaration of Helsinki, and approved by the Ethics Committee of China Aerospace Science & Industry Corporation 731 Hospital (No. 2024-0301-05).
Author Contributions
All authors made a significant contribution to the work reported, whether that is in the conception, study design, execution, acquisition of data, analysis, and interpretation, or in all these areas; took part in drafting, revising, or critically reviewing the article; gave final approval of the version to be published; have agreed on the journal to which the article has been submitted; and agree to be accountable for all aspects of the work.
Funding
This research did not receive any specific grant from funding agencies in the public, commercial, or not-for-profit sectors.
Disclosure
The authors declare that the research was conducted in the absence of any commercial or financial relationships that could be construed as a potential conflict of interest.
References
1. Nowicki J, Murray MT. Bronchitis and pneumonia. In: Textbook Nat Med. Textbook of Natural Medicine; 2020:1196.
2. Dandachi D, Rodriguez-Barradas MC. Viral pneumonia: etiologies and treatment. J Invest Med. 2018;66(6):957–965. doi:10.1136/jim-2018-000712
3. Shah A, Shah M. Advancement of deep learning in pneumonia/COVID-19 classification and localization: a systematic review with qualitative and quantitative analysis. Chronic Dis Transl Med. 2022;8(3):154–171. doi:10.1002/cdt3.17
4. Ferreira-Coimbra J, Sarda C, Rello J. Burden of community-acquired pneumonia and unmet clinical needs. Adv Ther. 2020;37:1302–1318. doi:10.1007/s12325-020-01248-7
5. Metlay JP, Waterer GW, Long AC, et al. Diagnosis and treatment of adults with community-acquired pneumonia. An official clinical practice guideline of the American Thoracic Society and Infectious Diseases Society of America. Am J Respir Crit Care Med. 2019;200(7):e45–e67. doi:10.1164/rccm.201908-1581ST
6. Aliberti S, Cruz CSD, Amati F, Sotgiu G, Restrepo MI. Community-acquired pneumonia. The Lancet. 2021;398(10303):906–919. doi:10.1016/S0140-6736(21)00630-9
7. Wang Y, Wang Y, Chen Y, Qin Q. Unique epidemiological and clinical features of the emerging 2019 novel coronavirus pneumonia (COVID‐19) implicate special control measures. J Med Virol. 2020;92(6):568–576. doi:10.1002/jmv.25748
8. Ito A, Ishida T. Diagnostic markers for community-acquired pneumonia. Ann Translat Med. 2020;8(9):609. doi:10.21037/atm.2020.02.182
9. Chen S, Jiang J, Li T, Huang L. PANoptosis: mechanism and role in pulmonary diseases. Int J Mol Sci. 2023;24(20):15343. doi:10.3390/ijms242015343
10. Malireddi RKS, Kesavardhana S, Karki R, Kancharana B, Burton AR, Kanneganti TD. RIPK1 distinctly regulates Yersinia-induced inflammatory cell death, PANoptosis. Immunohorizons. 2020;4(12):789–796. doi:10.4049/immunohorizons.2000097
11. Lee S, Karki R, Wang Y, Nguyen LN, Kalathur RC, Kanneganti T-D. AIM2 forms a complex with pyrin and ZBP1 to drive PANoptosis and host defence. Nature. 2021;597(7876):415–419. doi:10.1038/s41586-021-03875-8
12. Nizet V. Bacteria and phagocytes: mortal enemies. J Innate Immun. 2010;2(6):505. doi:10.1159/000320473
13. Underhill DM, Goodridge HS. Information processing during phagocytosis. Nat Rev Immunol. 2012;12(7):492–502. doi:10.1038/nri3244
14. Wolf AJ, Arruda A, Reyes CN, et al. Phagosomal degradation increases TLR access to bacterial ligands and enhances macrophage sensitivity to bacteria. J Immunol. 2011;187(11):6002–6010. doi:10.4049/jimmunol.1100232
15. Wang C, Guan Y, Lv M, et al. Manganese increases the sensitivity of the cGAS-STING pathway for double-stranded DNA and is required for the host defense against DNA viruses. Immunity. 2018;48(4):675–687.e677. doi:10.1016/j.immuni.2018.03.017
16. Messaoud-Nacer Y, Culerier E, Rose S, et al. STING agonist diABZI induces PANoptosis and DNA mediated acute respiratory distress syndrome (ARDS). Cell Death Dis. 2022;13(3):269. doi:10.1038/s41419-022-04664-5
17. Liu Y, Zhang L, Wu F, Liu Y, Li Y, Chen Y. Identification and validation of a pyroptosis-related signature in identifying active tuberculosis via a deep learning algorithm. Front Cell Infect Microbiol. 2023;13 1273140.
18. Peleman C, Van Coillie S, Ligthart S, et al. Ferroptosis and pyroptosis signatures in critical COVID-19 patients. Cell Death Differ. 2023;30(9):2066–2077. doi:10.1038/s41418-023-01204-2
19. Song F, Wang C-G, Mao J-Z, et al. PANoptosis-based molecular subtyping and HPAN-index predicts therapeutic response and survival in hepatocellular carcinoma. Front Immunol. 2023;14:1197152. doi:10.3389/fimmu.2023.1197152
20. Cotto KC, Wagner AH, Feng -Y-Y, et al. DGIdb 3.0: a redesign and expansion of the drug–gene interaction database. Nucleic Acids Res. 2018;46(D1):D1068–D1073. doi:10.1093/nar/gkx1143
21. Song Q, Ruiz J, Xing F, et al. Single-cell sequencing reveals the landscape of the human brain metastatic microenvironment. Commun Biol. 2023;6(1):760. doi:10.1038/s42003-023-05124-2
22. Bouch RJ, Zhang J, Miller BC, et al. Distinct inflammatory Th17 subsets emerge in autoimmunity and infection. J Exp Med. 2023;220(10):e20221911. doi:10.1084/jem.20221911
23. Chen W, Gullett JM, Tweedell RE, Kanneganti TD. Innate immune inflammatory cell death: PANoptosis and PANoptosomes in host defense and disease. Eur J Immunol. 2023;53:2250235. doi:10.1002/eji.202250235
24. Place DE, Lee S, Kanneganti T-D. PANoptosis in microbial infection. Curr Opin Microbiol. 2021;59:42–49. doi:10.1016/j.mib.2020.07.012
25. Aslan B, Monroig P, Hsu M-C, et al. The ZNF304-integrin axis protects against anoikis in cancer. Nat Commun. 2015;6(1):7351. doi:10.1038/ncomms8351
26. Krasnopolsky S, Kuzmina A, Taube R, Bangham CRM. Genome-wide CRISPR knockout screen identifies ZNF304 as a silencer of HIV transcription that promotes viral latency. PLoS Pathogens. 2020;16(9):e1008834. doi:10.1371/journal.ppat.1008834
27. Sekiguchi M, Sobue A, Kushima I, et al. ARHGAP10, which encodes Rho GTPase-activating protein 10, is a novel gene for schizophrenia risk. Transl Psychiatry. 2020;10(1):247. doi:10.1038/s41398-020-00917-z
28. Bassères DS, Tizzei EV, Duarte AA, Costa FF, Saad STO. ARHGAP10, a novel human gene coding for a potentially cytoskeletal Rho-GTPase activating protein. Biochem Biophys Res Commun. 2002;294(3):579–585. doi:10.1016/S0006-291X(02)00514-4
29. DuBois JC, Ray AK, Gruber RC, et al. Akt3-mediated protection against inflammatory demyelinating disease. Front Immunol. 2019;10:1738. doi:10.3389/fimmu.2019.01738
30. Tsiperson V, Gruber RC, Goldberg MF, et al. Suppression of inflammatory responses during myelin oligodendrocyte glycoprotein–induced experimental autoimmune encephalomyelitis is regulated by AKT3 signaling. J Immunol. 2013;190(4):1528–1539. doi:10.4049/jimmunol.1201387
31. Zhu Y, Chen Y, Xie D, et al. Macrophages depletion alleviates lung injury by modulating AKT3/GXP4 following ventilator associated pneumonia. Front Immunol. 2023;14:1.
32. Xu P, Zhang G, Hou S, L-g S. MAPK8 mediates resistance to temozolomide and apoptosis of glioblastoma cells through MAPK signaling pathway. Biomed Pharmacother. 2018;106:1419–1427. doi:10.1016/j.biopha.2018.06.084
33. Gu M, Liu K, Xiong H, You Q. MiR-130a-3p inhibits endothelial inflammation by regulating the expression of MAPK8 in endothelial cells. Heliyon. 2024 10(2):1.
34. Liu Y, Wei P, Qiu Z, Shen X, Gao L, Chen L Study on mechanism of Shufeng Jiedu granules in treating novel coronavirus pneumonia based on network pharmacology.
35. Guo S, Zhou W, Wu J, et al. Network pharmacology-based study on the mechanism of “Jiu Wei Zhu Huang San” in respiratory tract infections treatment. Eur J Int Med. 2019;32:101013. doi:10.1016/j.eujim.2019.101013
36. Lu NaNa LN, Liu Qi LQ, Gu LiGang GL, et al. Regulatory effects of shufeng xuanfei formula and jiebiao qingli formula on expression of TLR3, P38 and JNK in lung of mice with influenza viral. pneumonia. 2015; 2015:3563–3566.
37. Yang F-S, Cao F, Kong Y-B, Xu Y, Wang Z-T, Sun L-P. Molecular mechanism of treatment of pneumonia in children with Mori cortex-Lycii cortex based on network pharmacology. J Hainan Med College. 2022;28(4):1.
38. Craig A, Mai J, Cai S, Jeyaseelan S. Neutrophil recruitment to the lungs during bacterial pneumonia. Infect Immun. 2009;77(2):568–575. doi:10.1128/IAI.00832-08
39. Droemann D, Aries SP, Hansen F, et al. Decreased apoptosis and increased activation of alveolar neutrophils in bacterial pneumonia. Chest. 2000;117(6):1679–1684. doi:10.1378/chest.117.6.1679
40. Yan S, Li M, Liu B, Ma Z, Yang Q. Neutrophil extracellular traps and pulmonary fibrosis: an update. J Inflam. 2023;20(1):2. doi:10.1186/s12950-023-00329-y
41. Vergadi E, Ieronymaki E, Lyroni K, Vaporidi K, Tsatsanis C. Akt signaling pathway in macrophage activation and M1/M2 polarization. J Immunol. 2017;198(3):1006–1014. doi:10.4049/jimmunol.1601515
42. Weston CR, Davis RJ. The JNK signal transduction pathway. Curr Opin Genet Dev. 2002;12(1):14–21. doi:10.1016/S0959-437X(01)00258-1
43. Liu H, Zhou K, Liao L, Zhang T, Yang M, Sun C. Lipoxin A4 receptor agonist BML-111 induces autophagy in alveolar macrophages and protects from acute lung injury by activating MAPK signaling. Respir Res. 2018;19:1–11. doi:10.1186/s12931-018-0937-2
 © 2024 The Author(s). This work is published and licensed by Dove Medical Press Limited. The
full terms of this license are available at https://www.dovepress.com/terms.php
and incorporate the Creative Commons Attribution
- Non Commercial (unported, 3.0) License.
By accessing the work you hereby accept the Terms. Non-commercial uses of the work are permitted
without any further permission from Dove Medical Press Limited, provided the work is properly
attributed. For permission for commercial use of this work, please see paragraphs 4.2 and 5 of our Terms.
© 2024 The Author(s). This work is published and licensed by Dove Medical Press Limited. The
full terms of this license are available at https://www.dovepress.com/terms.php
and incorporate the Creative Commons Attribution
- Non Commercial (unported, 3.0) License.
By accessing the work you hereby accept the Terms. Non-commercial uses of the work are permitted
without any further permission from Dove Medical Press Limited, provided the work is properly
attributed. For permission for commercial use of this work, please see paragraphs 4.2 and 5 of our Terms.