")
Back to Journals » Journal of Inflammation Research » Volume 17
Identification of the Biomarkers for Chronic Gastritis with TCM Damp Phlegm Pattern by Using Tongue Coating Metabolomics
Authors You Z , Zhang J, Xu Y, Lu J, Zhang R, Zhu Z, Wang Y, Hao Y
Received 25 July 2024
Accepted for publication 24 October 2024
Published 2 November 2024 Volume 2024:17 Pages 8027—8045
DOI https://doi.org/10.2147/JIR.S480307
Checked for plagiarism Yes
Review by Single anonymous peer review
Peer reviewer comments 2
Editor who approved publication: Professor Ning Quan
Zhiyuan You,1 Jialin Zhang,1 Yifeng Xu,1 Junhong Lu,1 Renling Zhang,2 Zhujing Zhu,3 Yiqin Wang,1 Yiming Hao1
1Shanghai Key Laboratory of Health Identification and Assessment/Laboratory of TCM Four Diagnostic Information, Shanghai University of Traditional Chinese Medicine, Shanghai, 201203, People’s Republic of China; 2Gastroenterology, Longhua Hospital Shanghai University of Traditional Chinese Medicine, Shanghai, 201203, People’s Republic of China; 3Rheumatology, Longhua Hospital Shanghai University of Traditional Chinese Medicine, Shanghai, 201203, People’s Republic of China
Correspondence: Yiming Hao, Email [email protected]
Objective: This study aimed to establish a model for identifying chronic gastritis with the traditional Chinese medicine damp phlegm pattern by examining metabolite changes in the tongue coating of patients. It also explored the role of metabolic pathways in the pathogenesis of this condition.
Methods: This cross-sectional study involved 300 patients diagnosed with chronic gastritis. Of these, 200 patients exhibited the damp phlegm pattern, while 100 did not. Metabolomic methods employing GC-TOF-MS and UHPLC-QE-MS were utilized to identify various metabolites in the tongue coating of patients. An identification model for chronic gastritis with the damp phlegm pattern was created based on ROC curves derived from differential biomarkers. Additionally, 50 samples not included in model construction were collected for external validation.
Results: Comparison of the damp phlegm pattern group with the non-damp phlegm pattern group revealed a total of 116 differential metabolites. Among these, lipids and lipid-like compounds were most abundant, comprising 27 types, which included four lipid metabolites related to sphingomyelin metabolism. The ROC model, which included phenol, 2.6-diaminoheptanedioic acid, and N-hexadecanoyl pyrrolidine, demonstrated the highest accuracy, with accuracy, sensitivity, and specificity metrics of 94.0%, 91.0%, and 87.0%, respectively. Furthermore, external validation using tongue coating metabolites from 50 patients revealed accuracy, sensitivity, and specificity in the validation set of 93.9%, 90.6%, and 83.3%, respectively.
Conclusion: Differential metabolites between patients with the damp phlegm pattern and those without are primarily lipids and lipid-like compounds. N-hexadecanoyl pyrrolidine, phenol, and 2.6-diaminoheptanedioic acid may serve as potential biomarkers for chronic gastritis characterized by the damp phlegm pattern.
Keywords: chronic gastritis, damp phlegm pattern, tongue coating, metabolomics, biomarkers
A Letter to the Editor has been published for this article.
A Response to Letter by Dr Hu has been published for this article.
Introduction
An increasing number of people have had digestive problems in recent years as a result of dietary changes and increased workplace stress. Currently affecting over half of the world’s population, chronic gastritis is one of the most prevalent chronic disorders.1 One of the most prevalent conditions in the general population during gastroscopy in Eastern countries is thought to be chronic gastritis.2 Currently, gastroscopy is an invasive procedure,3 which may cause discomfort to patients, leading to their reluctance to undergo follow-up examinations during their illness. This often hampers the assessment of treatment effectiveness and the judgment of prognosis.
The concept of the Damp Phlegm (DP) pattern in Traditional Chinese Medicine (TCM) is recognized for its distinctive clinical manifestations, such as greasy tongue coating and weak limbs, indicating organ dysfunction. This pattern has gained international acknowledgment, as evidenced by its inclusion in the World Health Organization’s International Classification of Diseases, 11th Revision (ICD-11), which is a significant step towards the global integration of TCM diagnostic categories.4
Moreover, the DP pattern, particularly the wet phlegm aspect, has been identified as a predominant syndrome in chronic gastritis, a condition that can lead to severe discomfort and complications for affected individuals. This association is further supported by clinical studies that have examined the characteristics of “phlegm” and “dampness” in precancerous lesions of gastric carcinoma, further confirming that chronic gastritis with the DP pattern is more likely to develop into precancerous conditions of gastric cancer, highlighting the significance of TCM syndrome differentiation in understanding and treating gastric diseases.5 Among the various diagnostic methods used by TCM doctors, tongue diagnosis is very commonly used and important. Tongue diagnosis is the observation of the tongue coating and body. It has the characteristics of non-invasive and repeatable Blood cells, metabolites, nutrients, bacteria, and detached epithelial cells that are affixed to the tongue body comprise the tongue coating.6 According to TCM philosophy, tongue coating is an extremely subtle sign of how the stomach chemistry and pathology are doing. In our previous study, we found that several chemicals on the tongue coating in individuals with gastric precancerous lesion (GPL) DP patterns were significantly different from those of healthy persons.7
The metabolomics techniques have been widely used to search for disease-related diagnostic indicators recently. The metabolites from people with chronic gastritis were examined by some researchers while using various metabolomics approaches. Researchers discovered that certain metabolites in patients with chronic gastritis differed from those in healthy individuals. Based on these differences, they hypothesized that these differential metabolites could be employed as diagnostic indicators for chronic gastritis.8–13 However, it had small case numbers in these studies, and only one detection method was used in the study. A single detection method may not be able to detect metabolites comprehensively. Despite all this, no pertinent research on metabolites among people in DP pattern chronic gastritis has been discovered. Thus, to identify the metabolites within the tongue coating of about 300 patients with chronic gastritis DP pattern, we used a mixture of gas chromatography time-of-flight mass spectrometry (GC-TOF-MS) and ultra-high performance liquid chromatography Q-exactive orbitrap mass spectrometry (UHPLC-QE-MS) in this study. The alterations in tongue coating metabolites among patients who have a persistent gastritis DP pattern may be better understood from several angles with the aid of these differential metabolites (Figure 1).
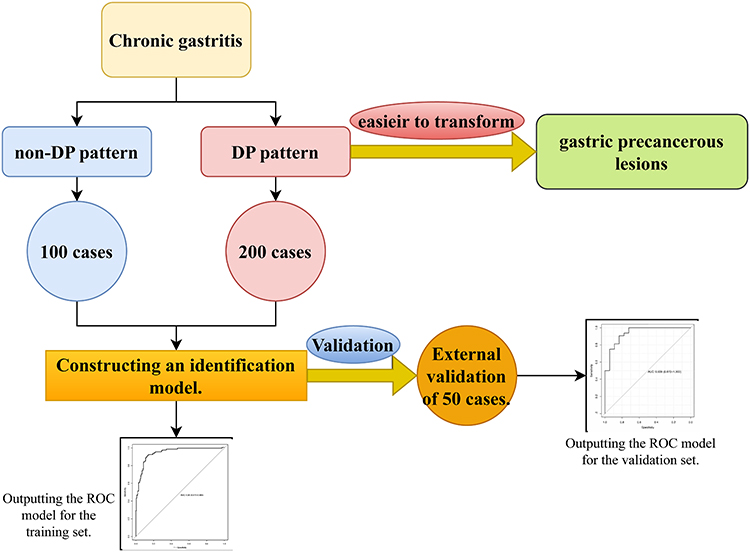 |
Figure 1 Research approach and flowchart. |
Materials and Methods
Samples
To shed light on the composition of tongue coating metabolites in people with chronic gastritis with DP pattern, we employed a case-control study design in this paper. Each participant diagnosed with chronic gastritis received a gastroscopy at Longhua Hospital, affiliated with Shanghai University of Traditional Chinese Medicine. At the same time, they also performed a test for gastric mucosal lesions. There were 200 cases of chronic gastritis with DP pattern and 100 instances without DP pattern among them. A recognition model was established using the 300 cases. Furthermore, the model was validated using 50 randomly chosen cases, of which eighteen had a chronic gastritis DP pattern and 32 had a non-DP pattern. Participating in the research from December 2018 to October 2019, every respondent self-reported that they were of Chinese ethnicity. Following their tongue coating specimen sample collection, participants underwent gastric mucosal pathology and gastroscopy. Table 1 summarizes their clinical and demographic data (therapy, Helicobacter pylori infection, and disease course).
 |
Table 1 Summary of Demographics and Clinical Information of the Participants |
Ethics Approval
The study was approved by the Ethics Committee of Shanghai University of TCM (2017–3). It was carried out in accordance with the Declaration of Helsinki. Before any data were collected, each participant signed an informed consent form.
Criteria
Diagnostic Criteria
Patients had endoscopic examinations, and biopsies of questionable lesion locations were performed (eg, angle, antrum, cardio, and body).
Two skilled pathologists carried out the histopathological evaluation by “the updated Sydney System” clinical guidelines.14
According to “Diagnostics of Traditional Chinese Medicine”, the chronic gastritis DP pattern diagnostic criteria were developed.15 Patients who meet 1–2 of the primary symptoms, 0–2 of the secondary symptoms, and exhibit the characteristic tongue coating are identified as having the DP pattern.
- Primary symptoms:The patient felt epigastric fullness or distending pain.Patients were nauseous and/or vomiting.
- Secondary symptoms:The patient’s feces were not shaped.The patient had a bad appetite.
- Tongue coating characteristic:The patient’s tongue had a thick coating.
Inclusion Criteria and Exclusion Criteria
(1) Inclusion Criteria16
The patient met the diagnostic criteria of chronic gastritis.
The age range of all participants was 20 to 70 years.
(2) Exclusion Criteria
Patients with gastric bleeding, duodenal ulcer, gastroesophageal reflux disease, gastric cancer, gastric ulcer.
Patients with intestinal disorders as well as any systemic diseases identified by endoscopy.
Patients with psychiatric disorders.
Pregnant or lactating female subjects.
Subjects with tongue, mouth, nose or pharynx injuries within one month before sample collection.
Subjects who had received antibiotics or probiotics within one month prior to sample collection.
Subjects who used tobacco or alcohol, or had a body mass index (BMI) greater than 28 were also excluded.
Tongue Coating Samples
Tongue coating specimens were obtained from participants before their morning meal. To ensure cleanliness, participants were instructed to rinse their mouths with sterile physiological saline on three occasions before the collection process. A sterilized tongue scraper (model CY-98000, manufactured by Huachenyang Technology Co., Ltd, iClean brand, China) was employed by the collector to gently collect material from the most prominent areas of the participants’ tongue coatings, repeating the scraping process five times. Subsequently, the swabbed samples were carefully placed into a sterile centrifuge tube, with particular attention to depositing the sample at the tip of the swab. A single researcher was responsible for the collection of all specimens to maintain consistency. The collected tongue coatings were then properly stored at a temperature of −80°C for future analysis.7
GC-TOF-MS Metabolomics Processing
The GC-TOF-MS experiment’s reagents were specified in Table S1. We presented the experimental steps in Figure 2.
- The swab tip containing the tongue coating sample was transferred to a 5 mL sterile Eppendorf tube for weighing purposes. A pre-chilled extraction solution (methanol to chloroform ratio of 3:1), totaling 1500 μL, along with an internal standard solution (adonitol at a concentration of 0.5 mg/mL), 15 μL, was added. The sample was then subjected to sonication in an ice bath for 30 minutes. The swab tip was subsequently discarded. Following centrifugation at 4°C at 10,000 rpm for 15 minutes, 500 μL of the supernatant was carefully transferred to new tubes.
- A 100 μL aliquot was extracted from each sample and pooled to create a quality control (QC) sample. The combined samples were evaporated using a vacuum concentrator. To the dried residues, 40 μL of methoxylamine hydrochloride (dissolved in pyridine at 20 mg/mL) was added, and the mixture was incubated at 80°C for 30 minutes. This was followed by a 1.5-hour incubation with 60 μL of bis-(trimethylsilyl)-trifluoroacetamide reagent (containing 1% trimethylchlorosilane) at 70°C. Once the samples had gradually reached room temperature, 5 μL of fatty acid methyl ester in chloroform was added to the QC samples.
- The GC-TOF-MS analysis was conducted using an Agilent 7890 gas chromatograph interfaced with a TOF mass spectrometer, equipped with a db-5ms capillary column. A 1 μL aliquot was injected in the splitless mode. Helium was used as the carrier gas, with a purge flow rate of 3 mL/min at the front inlet and a column flow rate of 1 mL/min. The temperature program initiated at 50°C, held for 1 minute, then ramped up to 310°C at a rate of 20°C/min and finally maintained at 310°C for 6 minutes. The temperatures of the injection port, transfer line, and ion source were set at 280°C, 280°C, and 250°C, respectively. The mass spectra were acquired in full-scan mode with an electron energy of −70 eV in electron collision mode, scanning the m/z range from 50 to 500 at a rate of 12.5 spectra per second and a solvent delay of 6.30 minutes.
 |
Figure 2 GC-TOF-MS & UHPLC-QE-MS specific analysis conditions. |
Integration, alignment, deconvolution, baseline adjustment, and peak extraction were among the analyses of the original data using Chroma TOF (V4.3x, LECO) software.17 By using the mass spectrum and retention index, the metabolites were found using the LECO-Fiehn Rtx5 database. Just over half of the peaks removed in QC samples with RSD>30% were present among the peaks that were found.18
UHPLC-QE-MS Metabolomics Processing
The UHPLC-QE-MS experiment’s reagents were specified in Table S1. The trial actions are presented in Figure 2.
- To the sample, 1500 μL of extraction solvent containing a mixture of isotopically-labeled internal standards was added (acetonitrile: methanol: water ratio of 2:2:1). The mixture was briefly vortexed for 30 seconds and then subjected to sonication in an ice bath for 30 minutes.
- The sample was cooled at −40°C for 1 hour and subsequently centrifuged at 12,000 rpm for 15 minutes at 4°C. The supernatant was carefully transferred to a new glass vial in preparation for analysis. A quality control (QC) sample was prepared by pooling and thoroughly mixing the supernatants from all individual samples.
- Liquid chromatography-mass spectrometry (LC-MS) analysis was conducted using a UHPLC system (Vanquish, Thermo Fisher Scientific) equipped with a UPLC BEH Amide column (2.1 mm × 100 mm, 1.7 μm) and coupled to a Q Exactive HFX mass spectrometer (Orbitrap MS, Thermo). The mobile phases consisted of 25 mm ammonium acetate and 25 mm ammonia hydroxide in water at pH 9.75 (solvent A) and acetonitrile (solvent B). The gradient elution program was as follows: 0–0.5 min, 95% B; 0.5–7.0 min, 95–65% B; 7.0–8.0 min, 65–40% B; 8.0–9.0 min, 40% B; 9.0–9.1 min, 40–95% B; 9.1–12.0 min, 95% B. The column was maintained at a temperature of 25°C, while the auto-sampler was set at 4°C with an injection volume of 3 μL.
- The QE HFX mass spectrometer operated in the information-dependent acquisition (IDA) mode, controlled by acquisition software (Xcalibur, Thermo). The software continuously monitored the full scan mass spectrum. Electrospray ionization (ESI) source conditions were optimized as follows: sheath gas flow rate of 50 Arb, auxiliary gas flow rate of 10 Arb, capillary temperature at 320°C, full MS resolution set to 60,000, MS/MS resolution at 7,500, collision energy ramped at 10/30/60 in nice mode, and spray voltage at 3.5 kV for positive mode or −3.2 kV for negative mode.
- Raw data files were converted to mzXML format using the ProteoWizard software suite, and subsequent peak detection, extraction, alignment, and integration were performed using a custom XCMS-based program developed in the R programming environment.
Metabolite identification was facilitated by referencing the company’s proprietary MS2 database (BiotreeDB V2.1). The annotation cutoff value was established at 0.3.19
Statistical Analysis
UV formatting and logarithmic conversion were carried out on the data using the Simca software (V15.0.2, Sartorius Stedim Data Analytics AB, Umea, Sweden). First, a modeling study using orthogonal projections for latent structures-discriminant analysis (OPLS-DA) was conducted on the first principal component. The model’s quality was then evaluated through the use of seven-fold cross-validation. Subsequently, the model’s validity was assessed using the cross-validation results for Q2 (the model’s prediction) and R2Y (the model’s interpretability to the categorical variable Y). Lastly, using a permutation test to randomly change the categorical variable Y’s order 200 times, the reliability of the model was further verified by obtaining unique random Q2 values.
The rate of false discovery rate (FDR) of the rank-sum test and the P-value (P<0.05), the significance of the variable in the projection (VIP) of the first principal component of the OPLS-DA model (VIP>1), the similarity value (SV) detected by GC-TOF-MS (SV>700),20 and the MS2 score identified by UHPLC-QE-MS detection (MS2 score>0.6)21 were the factors used to determine if there was an important distinction in metabolites with the two groups. The log fold change (FC) values were calculated after comparing the mean values for the peak regions of the metabolites between the two groups.
The factors used to determine whether there was a significant difference in metabolites between two groups were the rate of false discovery (FDR) of the rank-sum test and the P-value (P<0.05), the significance of the variable in the projection (VIP) of the first principal component of the OPLS-DA model (VIP>1), similarity value (SV) detected by GC-TOF-MS (SV>700), and MS2 score identified by UHPLC-QE-MS detection (MS2 score>0.6). After comparing the two groups’ mean values for the metabolites’ peak regions, the log fold change (FC) value was computed.
Following the enrichment analysis and topology analysis, the Kyoto Encyclopedia of Genes and Genomes (KEGG) pathway database remarks on the significantly differential metabolites revealed the key routes with the highest relationship to metabolite differences based on both raw P and impact values.
By randomly combining each distinctly qualitatively different metabolite and using the Random Forest algorithm, model selection was performed to differentiate between two groups of samples through ten-fold cross-validation. The combination with the lowest cross-validation error (CV Error) was chosen, and the results were plotted on the Receiver Operating Characteristic (ROC) curve.
Results
OPLS-DA Score Plots
The two groups can be clearly distinguished by looking at the OPLS-DA score chart of the DP group and the non-DP group, together with the GC-TOF-MS, UHPLC-QE-MS positive ion pattern, and UHPLC-QE-MS negative ion pattern (with a little overlap). In GC-TOF-MS (R2Y = 0.12, Q2 = −0.67), UHPLC-QE-MS positive ion mode (R2Y = −0.01, Q2 = −0.47), and UHPLC-QE-MS negative ion mode (R2Y = −0.08, Q2 = −0.51). Permutation tests of the two OPLS-DA model sets indicated good model robustness, with no signs of overfitting (Figure 3–4).
 |
Figure 3 OPLS-DA analysis of metabolomic data of chronic gastritis damp phlegm pattern group and non-damp phlegm pattern group. (a) OPLS-DA analysis by GC-TOF-MS, (b) OPLS-DA analysis by UHPLC-QE-MS positive ion mode, and (c) OPLS-DA analysis by UHPLC-QE-MS negative ion mode. C: chronic gastritis damp phlegm pattern; D: chronic gastritis non-damp phlegm pattern. The figures of OPLS-DA illustrated that there were significant differences between the chronic gastritis with damp phlegm pattern group and non-damp phlegm pattern group. |
 |
Figure 4 Validation plots of OPLS-DA scores of chronic gastritis damp phlegm pattern group and chronic gastritis non-damp phlegm pattern group. (a) Validation plots of OPLS-DA scores by GC-TOF-MS, (b) validation plots of OPLS-DA scores by UHPLC-QE-MS positive ion mode, and (c) validation plots of OPLS-DA scores by UHPLC-QE-MS negative ion mode. The figures of validation plots of OPLS-DA scores showed that the models of chronic gastritis damp phlegm pattern group and non-damp phlegm pattern group had good robustness as well as had no overfitting phenomenon. |
Different Metabolic MS Peaks in Tongue Coating Samples
As shown in Figure 5a–f, significant differences in mass spectrometry (MS) peaks were observed between the Damp Phlegm (DP) pattern group and the non-DP group in patients with chronic gastritis (CG).
 |
Figure 5 Mass spectrum peaks of damp phlegm pattern group and non-damp phlegm pattern group. (a) Non-DP pattern group UHPLC-QE-MS negative ion mode, (b) Non-DP pattern group UHPLC-QE-MS positive ion mode, (c) Non-DP pattern group GC-TOF-MS, (d) DP pattern group UHPLC-QE-MS negative ion mode, (e) DP pattern group UHPLC-QE-MS positive ion mode, (f) DP pattern group GC-TOF-MS. As shown in Figure 4a–f, there are some differences in the mass spectrometric peaks of the tongue coating metabolites between patients with chronic gastritis in the DP pattern group and those in the non-DP pattern group. |
Using the criteria of a P-value less than 0.05 and a VIP greater than 1, gas chromatography-time of flight mass spectrometry (GC-TOF-MS) analysis revealed 28 peaks in the DP group compared to the non-DP group (with 4 peaks increased and 24 peaks decreased). Similarly, ultra-high-performance liquid chromatography-quadrupole orbitrap mass spectrometry (UHPLC-QE-MS) positive ion mode evaluation showed 108 significant peaks in the DP group compared to the non-DP group (with 101 peaks increased and 7 peaks decreased). The negative ion mode analysis revealed 35 different peaks in the DP group compared to the non-DP group (with 32 peaks increased and 3 peaks decreased).
Further employing the criteria of similarity (SV > 700) and MS2 score (> 0.6), GC-TOF-MS analysis identified 19 different peaks in the DP group compared to the non-DP group (with 2 peaks increased and 17 peaks decreased). For the UHPLC-QE-MS positive ion analysis, the DP group showed 72 different peaks compared to the non-DP group (with 6 peaks decreased and 66 peaks increased), and the negative ion analysis revealed 31 peaks (with 29 increased and 2 decreased). These findings emphasize the distinct metabolic profiles present in the tongue coating of DP and non-DP CG patients.
Differential Metabolites Analysis
In Table 2, 116 metabolites were categorized into 11 groups, with the largest categories being Lipids and lipid-like molecules (27 metabolites), Organic acids and derivatives (24 metabolites), Organoheterocyclic compounds (20 metabolites), Nucleosides, nucleotides, and analogs (12 metabolites), Organic oxygen compounds (7 metabolites), and Organic nitrogen compounds (5 metabolites). Both Organooxygen compounds and Benzenoids had 4 metabolites each. Organic nitrogen compounds contain 2 metabolites. Organosulfur compounds, Phenylpropanoids and polyketides each had 1 metabolite. There were 14 unclassified metabolites.
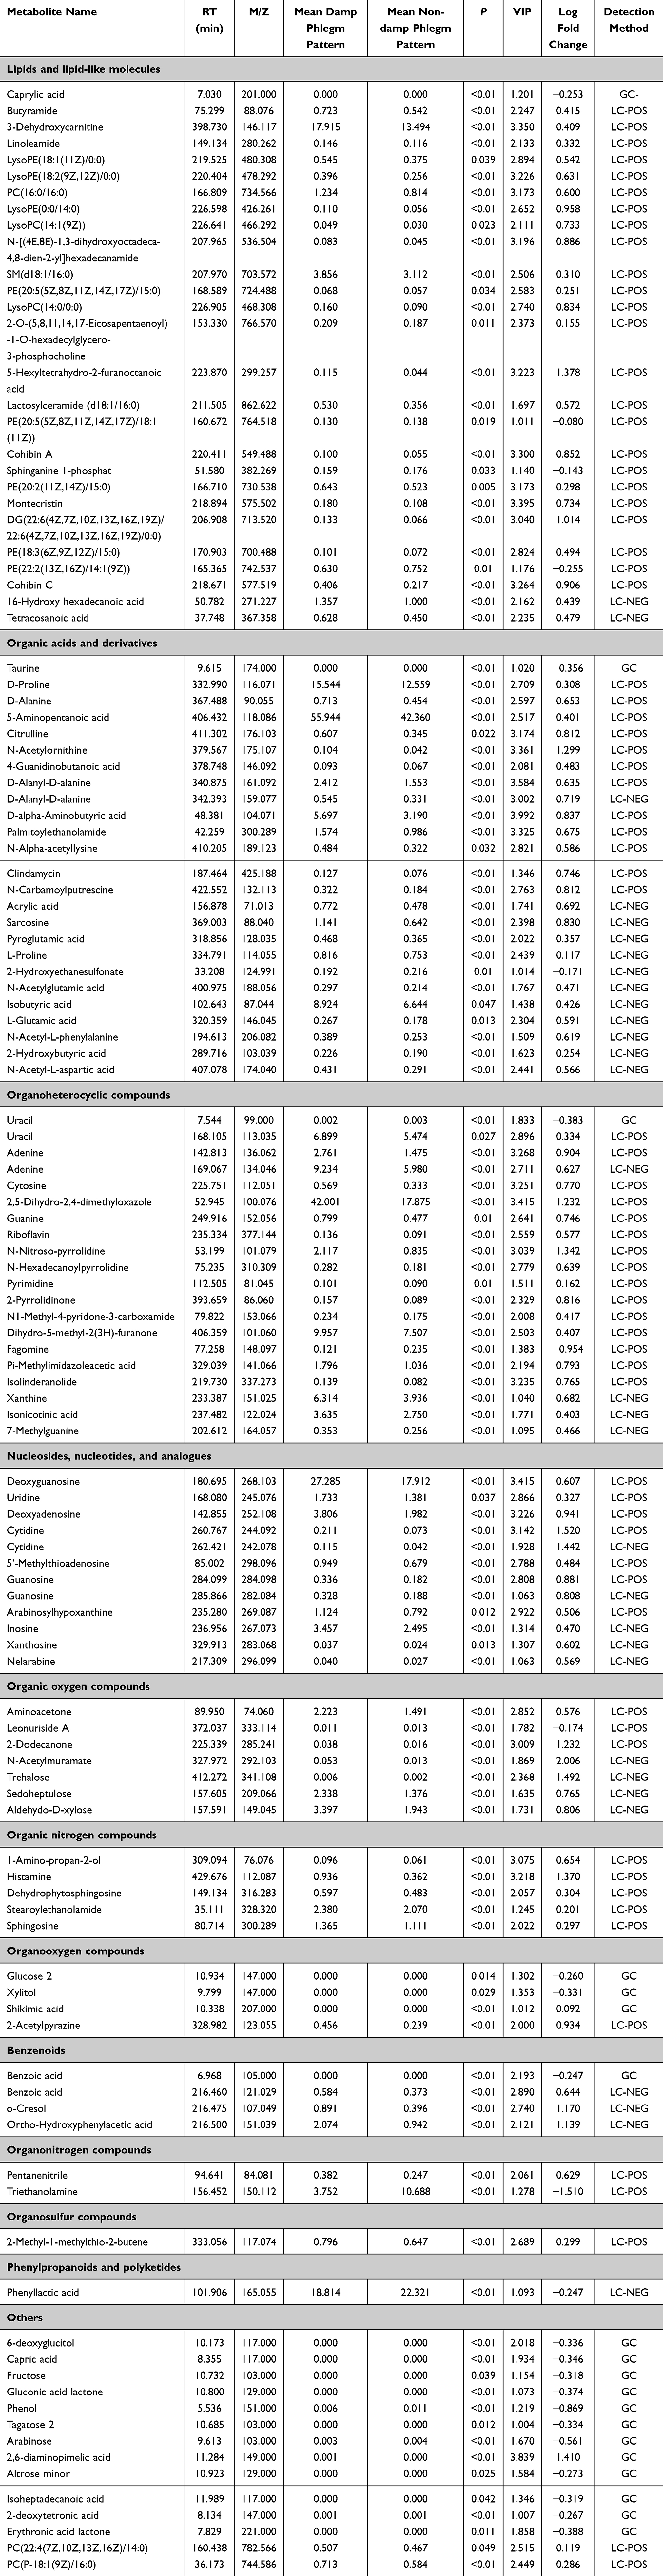 |
Table 2 Identification of Significant Differential Metabolites in Tongue Coating by Comparison of the Damp Phlegm Pattern Group and Non-Damp Phlegm Pattern Group |
Differential Metabolic Pathways Analysis
Five metabolic pathways were identified by GC-TOF-MS analysis in the comparison between the DP pattern group and the non-DP pattern group (hypotaurine metabolism, taurine and pyrimidine metabolism, phenylalanine, tryptophan biosynthesis and tyrosine, primary bile acid biosynthesis, and phenylalanine metabolism). UHPLC-QE-MS positive ion model analyzed 11 metabolic pathways (arginine and proline metabolism, threonine metabolism, methionine metabolism, glycerophospholipid metabolism, riboflavin metabolism, pyrimidine metabolism, vitamin B6 metabolism, glycine, histidine metabolism, serine, lysine degradation and sphingolipid metabolism, and cysteine and purine metabolism). UHPLC-QE-MS negative ion model analyzed 12 metabolic pathways (sucrose metabolism, aspartate, arginine and proline metabolism, caffeine metabolism, alanine, purine metabolism and glutamate metabolism, D-glutamine, D-glutamate metabolism and glutathione metabolism, pyrimidine metabolism, aminoacyl-tRNA biosynthesis, glycine, threonine metabolism and serine, starch and phenylalanine metabolism, and histidine metabolism). In total, 39 key metabolites were involved, which were uracil, taurine, shikimic acid, benzoic acid, sphinganine 1-phosphate, SM, sphingosine, lactosylceramide, citrulline, N-acetylornithine, D-proline, 4-guanidinobutanoic acid, N-carbamoylputrescine, 5-aminopentanoic acid, triethanolamine, uridine, cytidine, cytosine, deoxyadenosine, adenine, guanine, deoxyguanosine, guanosine, riboflavin, D-alanine, histamine, aminoacetone, 5’-methylthioadenosine, ortho-hydroxyphenylacetic acid, N-acetyl-L-phenylalanine, xanthine, xanthosine, inosine, L-glutamic acid, L-proline, sarcosine, N-acetyl-L-aspartic acid, pyroglutamic acid, and trehalose (Table 3).
 |
Table 3 Key Metabolic Pathways Identified from the Significant Differential Metabolites in Tongue Coating Between the Damp Phlegm Pattern Group and Non-Damp Phlegm Pattern Group |
Diagnostic Model of Chronic Gastritis DP Pattern
In this study, 200 cases of chronic gastritis DP syndrome were compared with 100 cases of chronic gastritis non-DP syndrome. Screening for differential metabolites in the tongue coating to construct diagnostic models. Finally, we obtained the optimal diagnostic model composed of three tongue coating biomarkers by GC-TOF-MS screening. They are 2.6-diaminoheptaneic acid, phenol and N-hexadecyprollidine screened by UHPLC-QE-MS positive ion mode, respectively. The accuracy of the model is 94.0%, the sensitivity is 91.0%, and the specificity is 87.0% (Figure 6). In the pattern of chronic gastritis DP, phenol was significantly down-regulated, while 2.6-diaminopimelic acid and N-Hexadecanoylpyrrolidine were significantly up-regulated compared to the non-DP pattern of chronic gastritis. The tongue coating metabolites of 50 patients with chronic gastritis (including 18 cases of chronic gastritis DP pattern and 32 cases of chronic gastritis non-DP pattern) were randomly detected in the clinic to validate the model, which was visualized by the ROC curve, and the accuracy of this diagnostic model was 93.9%, the specificity was 83.3%, and the sensitivity was 90.6% (Figure 7).
 |
Figure 6 ROC curve of chronic gastritis damp phlegm pattern and chronic gastritis non-damp phlegm pattern diagnostic model. The accuracy of the diagnostic model was 94.0%, the sensitivity was 91.0%, and the specificity was 87.0%. |
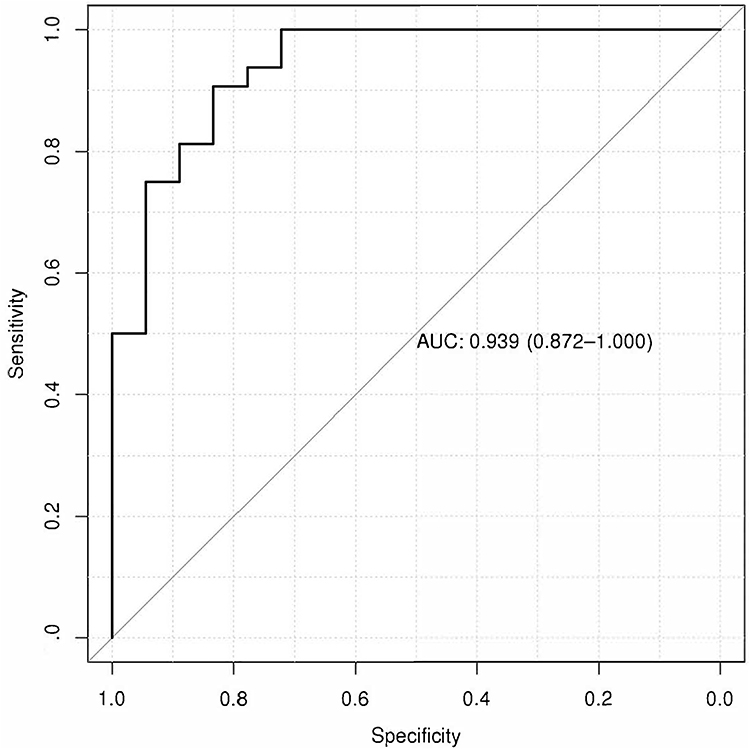 |
Figure 7 The ROC curve of the identification model for chronic gastritis with phlegm-dampness syndrome and non-wet chronic gastritis on a validation set of 50 cases. The accuracy of the diagnostic model was 93.9%, the sensitivity was 90.6%, and the specificity was 83.3%. |
Discussion
We used GC-TOF-MS and UHPLC-QE-MS to look at metabolite changes in the tongue covering of individuals with chronic gastritis. Compared to UHPLC-QE-MS, GC-TOF-MS has a larger library and superior separation power as well as extremely repeatable mass spectra. All the same, UHPLC-QE-MS finds over a thousand metabolites while GC-TOF-MS finds just about 100.22 Given the diverse composition of metabolites on the tongue coating Therefore, with the combination of these two assays, the detected metabolites may be more comprehensive.
The most prevalent species of metabolites in the chronic gastritis DP pattern group were 27 different kinds of lipids and lipid-like compounds, as compared to the non-DP pattern group. According to certain research, lipid metabolism could have an impact on the onset of chronic gastritis.8 It has also been found that lipids are associated with the progression of the course of chronic atrophic gastritis.23 Adverse cholesterol status, such as low serum high-density lipoprotein, also had an impact on inflammatory diseases.24 High-fat and high-cholesterol diets have been linked to an increased risk of gastritis in mice, according to studies.25 We previously discovered that lipids and lipid-like substances might have a role in the development of the GPL of the DP pattern.7 The aforementioned research shows that lipids are linked to both the onset of GPL and the progression of chronic gastritis. At present, researchers have also found that lipids are related to the development of other DP pattern diseases. For instance, research has revealed that rats with hyperlipidemia had significantly higher total cholesterol levels and that the condition falls under the category of DP patterns.26 DP pattern hypertensive patients with diabetes mellitus showed increased total and low-density lipoprotein cholesterol levels.27
Lipids and lipid-like compounds have been linked in one metabolic process called sphingolipid metabolism, according to the pathway of metabolism analysis. The metabolic pathway contained 4 metabolites which were sphinganine 1-phosphate, SM, sphingosine, and lactosylceramide.
Some studies have shown that sphinganine 1-phosphate may inhibit cell apoptosis,28 reduce lymphocyte infiltration, and reduce renal and liver damage caused by hepatic ischemia and reperfusion in mice.29 It can be seen that this substance may exert a protective effect on humans. Sphinganine 1-phosphate levels in the DP pattern group of this study were considerably greater than in the healthy control group, suggesting that the chemical may have a protective effect on individuals with chronic gastritis. However as compared to the group of non-DP patterns, it was significantly lower, suggesting that the decrease in this chemical may be linked to the onset of chronic gastritis DP pattern. SM(d18:1/16:0) exerts protective effects on the gastric mucosal surface.30 The “oxidative stress” environment induced by lactosylceramide leads to the occurrence of inflammation.31
Lipid metabolites can be found in patients with chronic gastritis, some substances play a protective role in the stomach, and some substances have a relationship with the development of chronic gastritis. We also discovered that various helpful chemicals were reduced in individuals with DP pattern chronic gastritis, and this reduction may be linked to the development of DP pattern chronic gastritis.
The second largest group was organic acids and derivatives, for a total of 25 metabolites. According to certain research, the metabolites of patients with gastric adenocarcinoma contain noticeably more organic acids.32 Additionally, the organic acid content of the GPL patients’ tongue coating and DP pattern was shown to be considerably higher in our prior study than in normal controls.7
Based on metabolic pathway analysis, Organic acids and derivatives were involved in 13 metabolic pathways, including 13 metabolites, which were taurine, citrulline, N-acetylornithine, D-proline, 4-guanidinobutanoic acid, N-carbamoylputrescine, 5-aminopentanoic acid, D-alanine, N-acetyl-L-phenylalanine, L-glutamic acid, L-proline, sarcosine, and N-acetyl-L-aspartic acid.
Among them, taurine has anti-inflammatory effects.33 Taurine could also attenuate the damage of gastric mucosa in rats.34 Taurine dramatically dropped in this study when comparing the DP to the non-DP pattern. Individuals with DP pattern chronic gastritis may not be protected by this compound. Citrulline may be associated with the occurrence of inflammation.35 Researchers have found that plasma citrulline concentration can be used to evaluate the amount of functional intestinal cells in various acute and chronic small bowel diseases.36 When the DP pattern group and the non-DP pattern group were contrasted in this study, citrulline was significantly higher. It has been observed that an increase in this substance’s content may exacerbate the development of disorders associated with the digestive tract.
Researchers found that D-proline and L-proline might serve as substrates for Helicobacter pylorirespiration in the stomach.34,35,37 The levels of these two substances in the DP pattern group were significantly higher than in the non-DP pattern group. Moreover, reduced expression levels of glutamate are associated with digestive diseases.38 When comparing L-glutamic acid levels between the DP pattern group and the non-DP pattern group in this study, L-glutamic acid was found to be significantly higher in the DP pattern group. This suggests that L-glutamic acid may play a protective role in individuals with DP pattern chronic gastritis.
Among the metabolites in this category, there were also some substances related to upper gastrointestinal diseases. For instance, research has shown that persons with foul breath have considerably higher levels of 5-aminopentanoic acid and N-acetylornithine in their saliva.39 It was also found that N-acetyl-L-phenylalanine could be a biomarker for oral squamous epithelial carcinoma.40 There has not been any research on these three drugs with chronic gastritis as of yet. In this investigation, the DP pattern group’s contents of these three substances were noticeably higher than those of the non-DP pattern group.
The third category of metabolites was organoheterocyclic compounds, with 25 metabolites. According to the metabolic pathway analysis, there are 6 metabolic pathways involved, including 6 metabolites (uracil, cytosine, adenine, guanine, riboflavin, and xanthine). Among them, riboflavin has anti-inflammatory and anticancer properties.41 One possible biomarker for the diagnosis of patients with chronic gastritis could be xanthine.9 Compared to the non-DP pattern group, the contents of these two substances were substantially higher in the DP pattern group. As can be observed, xanthine may have accelerated the onset of chronic gastritis, while riboflavin may have a protective function for the body.
This study analyzed the metabolic differences in the tongue coating of patients with chronic gastritis, exploring the distinction between the DP pattern and the non-DP pattern. The research found that in patients with the DP pattern, metabolites of lipids and lipid-like compounds showed significant changes, with a diagnostic model composed of phenol, 2.6-diaminoheptanedioic acid, and N-hexadecanoyl pyrrolidine demonstrating promising diagnostic potential. These findings may contribute to our understanding of the pathophysiological processes of the DP pattern in chronic gastritis and provide a reference for future treatment strategies.
Our study suggests that these specific metabolites could potentially serve as biomarkers for the DP pattern in chronic gastritis. Further research with a broader population is needed to confirm the consistency and reliability of these potential biomarkers. Additionally, investigating the biological functions and mechanisms of action of these biomarkers may help to uncover the pathogenesis of chronic gastritis.
In this study, the diagnostic model we constructed initially showed its potential in the early diagnosis of chronic gastritis. However, we recognize that our sample size and population distribution limitations might affect the applicability of our findings. Therefore, we recommend that future studies be conducted in different regions and populations to ensure the robustness and universality of the diagnostic model.
Furthermore, we believe that considering the impact of environmental and lifestyle factors on metabolite levels is important for developing effective prevention and treatment strategies. The development of diagnostic tools based on these biomarkers may help to improve the diagnostic efficiency of the DP pattern in chronic gastritis.
In summary, our research provides new insights into the diagnosis and understanding of the DP pattern in chronic gastritis, but further studies are needed to validate and expand on these preliminary findings. We hope that future work will provide more scientific evidence for the diagnosis and treatment of chronic gastritis.
Conclusion
This study, based on the method of tongue coating metabolomics, identified significant differences in tongue coating metabolites between the chronic gastritis DP pattern group and non-DP pattern group. Notably, lipids and lipid-like compounds were the most predominant categories of differential metabolites identified. Specifically, a diagnostic model composed of three metabolites—phenol, 2.6-diaminoheptanedioic acid, and N-hexadecanoyl pyrrolidine—demonstrated high accuracy, specificity, and sensitivity, offering new non-invasive biomarkers for the diagnosis of the DP pattern in chronic gastritis. Additionally, the study investigated the metabolic pathways associated with these differential metabolites, providing new insights into the pathogenesis of the DP pattern in chronic gastritis.
Funding
The study was funded by the National Natural Science Foundation of China (82174279 and 81703982) and Shanghai Science and Technology Planning Program (21DZ2271000).
Disclosure
There are no competing interests in the study.
References
1. Sipponen P, Maaroos HI. Chronic gastritis. Scand J Gastroenterol. 2015;50(6):657–667. doi:10.3109/00365521.2015.1019918
2. Bai Y, Li ZS, Zou DW, et al. Alarm features and age for predicting upper gastrointestinal malignancy in Chinese patients with dyspepsia with high background prevalence of Helicobacter pylori infection and upper gastrointestinal malignancy: an endoscopic database review of 102,665 patients from 1996 to 2006. Gut. 2010;59(6):722–728. doi:10.1136/gut.2009.192401
3. International Agency for Research on Cancer. Stomach cancer. CLOBOCAN; 2012.
4. World Health Organization. ICD-11 for mortality and morbidity statistics, World Health Organization, Geneva, Switzerland, version: 04/2019); 2019.
5. Li SH, Li SN, Huang MH, et al. Study on the characteristics of syndrome elements ‘phlegm’ and ‘dampness’ in precancerous lesions of gastric carcinoma. China J Tradition Chinese Med Pharm. 2019;34(3):970–973.
6. Lundgren T, Mobilia A, Hallström H, et al. Evaluation of tongue coating indices. Oral Dis. 2007;13(2):177–180. doi:10.1111/j.1601-0825.2006.01261.x
7. Xu Y, Zhang R, Morris R, et al. Metabolite characteristics in tongue coating from DP pattern in patients with gastric precancerous lesion. Evid Based Complement Alternat Med. 2021;2021:5515325. doi:10.1155/2021/5515325
8. Yu L, Lai Q, Feng Q, et al. Serum metabolic profiling analysis of chronic gastritis and gastric cancer by untargeted metabolomics. Front Oncol. 2021;11:636917. doi:10.3389/fonc.2021.636917
9. Mu X, Ji C, Wang Q, et al. Non-targeted metabolomics reveals diagnostic biomarker in the tongue coating of patients with chronic gastritis. J Pharm Biomed Anal. 2019;174:541–551. doi:10.1016/j.jpba.2019.06.025
10. Cui J, Liu Y, Hu Y, et al. NMR-based metabonomics and correlation analysis reveal potential biomarkers associated with chronic atrophic gastritis. J Pharm Biomed Anal. 2017;132:77–86. doi:10.1016/j.jpba.2016.09.044
11. Shi XG, Zou ZJ, Wu MY, et al. Metabonomics study on urine 1H-NMR in chronic superficial gastritis patients with pi-qi deficiency syndrome/Pi-Wei Dampness-heat Syndrome. Zhongguo Zhong Xi Yi Jie He Za Zhi. 2015;35(12):1427–1432. Chinese.
12. Yu L, Aa J, Xu J, et al. Metabolomic phenotype of gastric cancer and precancerous stages based on gas chromatography time-of-flight mass spectrometry. J Gastroenterol Hepatol. 2011;26(8):1290–1297. doi:10.1111/j.1440-1746.2011.06724.x
13. Liu X, Sun ZM, Liu YN, et al. The metabonomic studies of tongue coating in H. pylori positive chronic gastritis patients. Evid Based Complement Alternat Med. 2015;2015:804085. doi:10.1155/2015/804085
14. Dixon MF, Genta RM, Yardley JH, et al. Classification and grading of gastritis. The updated Sydney system. international workshop on the histopathology of gastritis, Houston 1994. Am J Surg Pathol. 1996;20(10):1161–1181. doi:10.1097/00000478-199610000-00001
15. He JC. Diagnostics of Traditional Chinese Medicine. Shanghai, China: Shanghai Pujiang Education Press; 2018:329–331.
16. National Health and Family Planning Commission of PRC. Criteria of Weight for Adults. Vol. 2. Beijing, China: Standards Press of China; 2013.
17. Kind T, Wohlgemuth G, Lee DY, et al. FiehnLib: mass spectral and retention index libraries for metabolomics based on quadrupole and time-of-flight gas chromatography/mass spectrometry. Anal Chem. 2009;81(24):10038–10048. doi:10.1021/ac9019522
18. Dunn WB, Broadhurst D, Begley P, et al. Procedures for large-scale metabolic profiling of serum and plasma using gas chromatography and liquid chromatography coupled to mass spectrometry. Nat Protoc. 2011;6(7):1060–1083. doi:10.1038/nprot.2011.335
19. Smith CA, Want EJ, O’Maille G, et al. XCMS: processing mass spectrometry data for metabolite profiling using nonlinear peak alignment, matching, and identification. Anal Chem. 2006;78(3):779–787. doi:10.1021/ac051437y
20. Yang C, Hao R, Du X, et al. GC–TOF/MS-based metabolomics studies on the effect of protein sources in formulated diet for pearl oyster Pinctada fucata martensii. Aquaculture. 2018;486:139–147. doi:10.1016/j.aquaculture.2017.12.020
21. Wang W, Zhao L, He Z, et al. Metabolomics-based evidence of the hypoglycemic effect of Ge-Gen-JiaoTai-Wan in type 2 diabetic rats via UHPLC-QTOF/MS analysis. J Ethnopharmacol. 2018;219:299–318. doi:10.1016/j.jep.2018.03.026
22. Zeki ÖC, Eylem CC, Reçber T, et al. Integration of GC-MS and LC-MS for untargeted metabolomics profiling. J Pharm Biomed Anal. 2020;190:113509. doi:10.1016/j.jpba.2020.113509
23. Liu Y, Xu W, Qin X. Deciphering the mechanical network of chronic atrophic gastritis: a urinary time-dependent metabonomics-based network pharmacology study. Front Physiol. 2019;10:1004. doi:10.3389/fphys.2019.01004
24. Kim DH, Son BK, Min KW, et al. Chronic gastritis is associated with a decreased high-density lipid level: histological features of gastritis based on the updated Sydney system. J Clin Med. 2020;9(6):1856. doi:10.3390/jcm9061856
25. Laurila A, Cole SP, Merat S, et al. High-fat, high-cholesterol diet increases the incidence of gastritis in LDL receptor-negative mice. Arterioscler Thromb Vasc Biol. 2001;21(6):991–996. doi:10.1161/01.ATV.21.6.991
26. Zhang L, Zhang Q, You Y, et al. Investigation of evolution rules of phlegm and blood stasis syndrome in hyperlipidemia and atherosclerosis by NMR-based metabolic profiling and metabonomic approaches. Zhongguo Zhong Xi Yi Jie He Za Zhi. 2015;35(7):823–833. Chinese.
27. Han SH, Li KZ, Zheng JM, et al. Study on the distribution of Chinese medical constitutions of hypertension complicated diabetes patients. Zhongguo Zhong Xi Yi Jie He Za Zhi. 2013;33(2):199–204. Chinese.
28. Kim DH, Yoo HS, Lee YM, et al. Elevation of sphinganine 1-phosphate as a predictive biomarker for fumonisin exposure and toxicity in mice. J Toxicol Environ Health A. 2006;69(23):2071–2082. doi:10.1080/15287390600746215
29. Park SW, Kim M, Chen SW, et al. Sphinganine-1-phosphate attenuates both hepatic and renal injury induced by hepatic ischemia and reperfusion in mice. Shock. 2010;33(1):31–42. doi:10.1097/SHK.0b013e3181c02c1f
30. Kurabe N, Igarashi H, Ohnishi I, et al. Visualization of sphingolipids and phospholipids in the fundic gland mucosa of human stomach using imaging mass spectrometry. World J Gastrointest Pathophysiol. 2016;7(2):235–241. doi:10.4291/wjgp.v7.i2.235
31. Chatterjee S, Balram A, Li W. Convergence: lactosylceramide-centric signaling pathways induce inflammation, oxidative stress, and other phenotypic outcomes. Int J Mol Sci. 2021;22(4):1816. doi:10.3390/ijms22041816
32. Hur H, Paik MJ, Xuan Y, et al. Quantitative measurement of organic acids in tissues from gastric cancer patients indicates increased glucose metabolism in gastric cancer. PLoS One. 2014;9(6):e98581. doi:10.1371/journal.pone.0098581
33. Qaradakhi T, Gadanec LK, McSweeney KR, et al. The anti-inflammatory effect of taurine on cardiovascular disease. Nutrients. 2020;12(9):2847. doi:10.3390/nu12092847
34. Ma N, Sasaki T, Sakata-Haga H, et al. Protective effect of taurine against nitrosative stress in the stomach of rat with water immersion restraint stress. Adv Exp Med Biol. 2009;643:273–283.
35. Couchet M, Pestour S, Breuillard C, et al. Regulation of citrulline synthesis in human enterocytes: role of hypoxia and inflammation. Biofactors. 2022;48(1):181–189. doi:10.1002/biof.1810
36. Kaore SN, Amane HS, Kaore NM. Citrulline: pharmacological perspectives and its role as an emerging biomarker in future. Fundam Clin Pharmacol. 2013;27(1):35–50. doi:10.1111/j.1472-8206.2012.01059.x
37. Rivera-Ordaz A, Bracher S, Sarrach S, et al. The sodium/proline transporter PutP of Helicobacter pylori. PLoS One. 2013;8(12):e83576. doi:10.1371/journal.pone.0083576
38. Zu GX, Sun QQ, Chen J, et al. Urine metabolomics of rats with chronic atrophic gastritis. PLoS One. 2020;15(11):e0236203. doi:10.1371/journal.pone.0236203
39. Jo JK, Seo SH, Park SE, et al. Identification of salivary microorganisms and metabolites associated with halitosis. Metabolites. 2021;11(6):362. doi:10.3390/metabo11060362
40. Wang Q, Gao P, Wang X, et al. The early diagnosis and monitoring of squamous cell carcinoma via saliva metabolomics. Sci Rep. 2014;4(1):6802. doi:10.1038/srep06802
41. Suwannasom N, Kao I, Pruß A, et al. Riboflavin: the health benefits of a forgotten natural vitamin. Int J Mol Sci. 2020;21(3):950. doi:10.3390/ijms21030950
 © 2024 The Author(s). This work is published and licensed by Dove Medical Press Limited. The
full terms of this license are available at https://www.dovepress.com/terms.php
and incorporate the Creative Commons Attribution
- Non Commercial (unported, 3.0) License.
By accessing the work you hereby accept the Terms. Non-commercial uses of the work are permitted
without any further permission from Dove Medical Press Limited, provided the work is properly
attributed. For permission for commercial use of this work, please see paragraphs 4.2 and 5 of our Terms.
© 2024 The Author(s). This work is published and licensed by Dove Medical Press Limited. The
full terms of this license are available at https://www.dovepress.com/terms.php
and incorporate the Creative Commons Attribution
- Non Commercial (unported, 3.0) License.
By accessing the work you hereby accept the Terms. Non-commercial uses of the work are permitted
without any further permission from Dove Medical Press Limited, provided the work is properly
attributed. For permission for commercial use of this work, please see paragraphs 4.2 and 5 of our Terms.
Recommended articles
Untargeted Metabolomics of Feces Reveals Diagnostic and Prognostic Biomarkers for Active Tuberculosis and Latent Tuberculosis Infection: Potential Application for Precise and Non-Invasive Identification
Luo D, Yang BY, Qin K, Shi CY, Wei NS, Li H, Qin YX, Liu G, Qin XL, Chen SY, Guo XJ, Gan L, Xu RL, Dong BQ, Li J
Infection and Drug Resistance 2023, 16:6121-6138
Published Date: 12 September 2023