")
Back to Journals » Journal of Inflammation Research » Volume 17
Insulin Mediates Lipopolysaccharide-Induced Inflammatory Responses and Oxidative Stress in BV2 Microglia
Authors Huang CC , Tsai SF, Liu SC, Yeh MC, Hung HC, Lee CW, Cheng CL, Hsu PL, Kuo YM
Received 3 June 2024
Accepted for publication 28 October 2024
Published 2 November 2024 Volume 2024:17 Pages 7993—8008
DOI https://doi.org/10.2147/JIR.S481101
Checked for plagiarism Yes
Review by Single anonymous peer review
Peer reviewer comments 2
Editor who approved publication: Professor Ning Quan
Chi-Chen Huang,1 Sheng-Feng Tsai,2,3 Shu-Cheng Liu,4 Mei-Chen Yeh,5 Hao-Chang Hung,5 Chu-Wan Lee,6 Ching-Li Cheng,6 Pei-Ling Hsu,7– 9 Yu-Min Kuo2,3
1Division of Neurosurgery, Department of Surgery, National Cheng Kung University Hospital, College of Medicine, National Cheng Kung University, Tainan, 70403, Taiwan; 2Department of Cell Biology and Anatomy, College of Medicine, National Cheng Kung University, Tainan, 70101, Taiwan; 3Institute of Basic Medical Sciences, College of Medicine, National Cheng Kung University, Tainan, 70101, Taiwan; 4Department of Anesthesiology, National Cheng Kung University Hospital, College of Medicine, National Cheng Kung University, Tainan, 70403, Taiwan; 5Division of Endocrinology and Metabolism, Department of Internal Medicine, Chi Mei Medical Center, Tainan, 71004, Taiwan; 6Department of Nursing, National Tainan Junior College of Nursing, Tainan, 700007, Taiwan; 7Department of Anatomy, School of Medicine, College of Medicine, Kaohsiung Medical University, Kaohsiung, 80708, Taiwan; 8Department of Medical Research, Kaohsiung Medical University Hospital, Kaohsiung, 80708, Taiwan; 9Drug Development and Value Creation Research Center, Kaohsiung Medical University, Kaohsiung, 80708, Taiwan
Correspondence: Pei-Ling Hsu, Department of Anatomy, School of Medicine, College of Medicine, Kaohsiung Medical University, 100 Shih-Chuan 1st Road, Kaohsiung, Taiwan, 80708, Tel +886-7-3121101 ext. 2144#16, Fax +886-7-3119849, Email [email protected] Yu-Min Kuo, Department of Cell Biology and Anatomy, College of Medicine, National Cheng Kung University, 1 Ta Hsueh Road, Tainan, 70101, Taiwan, Tel +886-6-2353535 ext. 5294, Fax +886-6-2093007, Email [email protected]
Introduction: Insulin, the key hormone for glucose regulation, has garnered attention for its role as an immune modulator. Impaired insulin signaling in the central nervous system is linked to neuroinflammation and neurodegenerative diseases. Microglia, the resident macrophage-like immune cells in the brain, are key regulators of neuroinflammation. However, the mechanisms by which insulin influences microglial immune responses remain relatively unknown.
Methods: This study aimed to assess the effects of post-treatment with insulin [30 minutes after lipopolysaccharide (LPS) exposure] on LPS-induced inflammatory responses in BV2 microglial cells.
Results: Post-treatment with insulin potentiated LPS-induced production of nitric oxide and pro-inflammatory cytokines, such as TNF and IL-6, through activation of the Akt/NF-κB pathway. Insulin also enhanced the ability of BV2 cells to phagocytose bacteria particles and β-amyloid fibrils. Conversely, insulin inhibited activation of NADPH oxidase and reduced intracellular levels of reactive oxygen species in LPS-treated BV2 cells.
Conclusion: Insulin enhances microglial immune competence when challenged by endotoxins but mitigates oxidative stress in these cells.
Keywords: β-amyloid, p47phox, phagocytosis, superoxide dismutase
Graphical Abstract:

Introduction
Evidence has increasingly shown that neuroinflammation plays an active role in the development of neurodegenerative diseases, such as Alzheimer’s disease (AD) and Parkinson’s disease.1–3 Neuroinflammation is highly regulated by microglia, the resident macrophage-like innate immune cells in the brain. Under physiological conditions, microglia are in a “surveillance” state that is characterized by a ramified morphology. Surveillance microglia actively govern the homeostasis of the central nervous system (CNS) through constant scanning of a defined territory of brain parenchyma via their processes.4,5 In response to stimulatory signals, microglia undergo varying degrees of transformation (referred to as microglial activation), including changes in morphology, gene expression, and functional behavior.5 Depending on the type, intensity, and duration of the stimuli, microglial activation can be neuroprotective or neurotoxic.5 Activated microglia can release inflammatory cytokines and toxins, which can injure or even cause neuronal death.5 Therefore, the regulation of microglial activation represents a critical means of controlling neuroinflammation and related neurological disorders.
While insulin is primarily known for its role in glucose homeostasis, recent studies have highlighted its critical role in regulating immune responses. Insulin signaling has been implicated in modulating inflammation through various pathways.6 It can influence the activity of nuclear factor-κB (NF-κB),7 a key regulator of inflammation, via the PI3K/Akt pathway.8,9 Insulin also induces vasodilation by promoting nitric oxide (NO) production7,10–13 and mitigates endotoxin-induced systemic inflammation by activating anti-inflammatory signaling cascades and suppressing the expression of pro-inflammatory cytokines such as interleukin (IL)-6 and tumor necrosis factor (TNF).14,15 In patients with type 2 diabetes, insulin has been shown to transcriptionally downregulate toll-like receptors (TLRs) in mononuclear cells, thereby reducing TLR-mediated inflammatory injury.16 Notably, insulin also plays a prominent role in modulating microglia-mediated immune responses, as the brain is insulin-sensitive,17 with insulin receptors widely expressed in various brain regions.18–21 In vitro, insulin has been shown to reduce lipopolysaccharide (LPS)-induced production of NO, reactive oxygen species (ROS), and TNF, while enhancing phagocytic activity in BV2 microglia.22 However, the administration of high doses of insulin (>100 nM) alone has been found to increase the expression of pro-inflammatory cytokines, such as IL-1β and TNF, in both BV2 cells and primary microglia.23 In vivo, microglial reactivity has been observed in the hippocampus of mice with high-fat diet-induced central insulin resistance.23 Interestingly, a five-day intracerebroventricular insulin infusion has been reported to activate microglia, as indicated by increased inflammatory markers in the hippocampus of young adult rats.24 Additionally, co-infusion of insulin and LPS via intracerebroventricular administration significantly improved LPS-induced cognitive decline and inhibited LPS-induced glial activation, TNF, IL-1β, and ROS release, blood-brain barrier disruption, and ferroptosis in the hippocampus of mice.25 Collectively, these findings suggest that the effects of insulin on immune responses in the CNS are complex and may vary depending on treatment protocols and the presence or absence of inflammagen stimuli. Thus, investigating the molecular mechanisms by which insulin modulates microglial immune responses and interacts with inflammatory agents is essential for a deeper understanding of the regulatory role of insulin in neuroinflammation.
In addition to regulating neuroinflammation, insulin also contributes to the pathogenesis of neuroinflammation-related diseases, as disrupted insulin signaling in the brain has been linked to the development of several neurodegenerative disorders,26,27 particularly AD. AD is characterized by chronic, progressive memory loss and cognitive decline, making it a leading cause of dementia.28 Pathologically, AD is defined by three key features: the presence of extracellular amyloid plaques consisting primarily of aggregated Aβ in the brain parenchyma, intracellular neurofibrillary tangles composed of hyperphosphorylated tau proteins, and neurodegeneration.29 Epidemiological studies have demonstrated a strong association between AD and diabetes,30 and AD is sometimes referred to as type 3 diabetes due to the insulin resistance observed in the brain.31,32 Insulin receptor expression and its binding capacity are reduced in individuals with AD, correlating with disease severity.33,34 Moreover, mounting evidence indicates that microglia actively participate in clearing Aβ from the AD brain.35 Microglial phagocytosis has been proposed as a mechanism for reducing Aβ levels in response to Aβ immunization in AD.36 Microglia interact with fibrillar Aβ via cell surface receptors, promoting its clearance and phagocytosis in vitro.37 However, in vivo studies suggest that while microglia surrounding plaques in the AD brain are activated, they fail to effectively phagocytose and degrade fibrillar Aβ deposits,38 indicating a microglial dysfunction in AD. Since insulin is known to enhance microglial phagocytosis22 and insulin resistance is present in the AD brain,31,32 investigating whether insulin treatment can stimulate microglial phagocytosis of fibrillar Aβ warrants further exploration.
In this study, we determined the effects of insulin on LPS-induced inflammatory responses in BV2 microglial cells. LPS, a TLR4 ligand, is known to induce a series of inflammatory responses in innate immune cells. LPS upregulates the expressions of pro-inflammatory cytokines and inducible nitric oxide synthase (iNOS) and activates NOD-, LRR- and pyrin domain-containing protein 3 (NLRP3) inflammasome through activating the NF-κB and mitogen-activated protein kinases (MAPKs) pathways downstream to TLR4.39–41 LPS also regulates phagocytosis42,43 and quickly increases the production of ROS in macrophages.44 ROS are mainly generated by the members of the NADPH oxidase (NOX) family.45,46 Increased NOX activity is linked to an accumulation of intracellular ROS.47 Within cells, superoxide dismutases (SODs), catalyzing the conversion of superoxide to oxygen and hydrogen peroxide, act as the first-line defense system against ROS.48 Accordingly, the interacting effects of insulin and LPS on the activity of TLR4 signaling, the secretion of pro-inflammatory mediators (ie, TNF, IL-6, and NO), the phagocytic activity, and the production of ROS were examined.
Materials and Methods
BV2 Microglial Cell Cultures and Treatments
Immortalized murine microglial BV2 cells (Cat#: ABC-TC212S, AcceGen Biotechnology, Fairfield, NJ, USA; RRID: CVCL_0182) were cultured in Dulbecco’s modified eagle medium/nutrient mixture F-12 (DMEM/F12, Cat#: 12500062, Thermo Fisher Scientific, Waltham, MA, USA) supplemented with 10% fetal bovine serum containing extremely low endotoxin (< 0.05 EU/mL; Lot#: VP2002200, Cat#: TMS‐013‐BKR, Merck‐Millipore, Burlington, MA, USA), and penicillin‐streptomycin (Cat#: 15140122, Thermo Fisher Scientific). The cultures were maintained in a humidified atmosphere of 5% CO2 and 95% air at 37°C. Subcultures were performed when cell density reached 80% confluence (approximately every two days). BV2 cells used in experiments were from passage numbers four to nine. Detailed sample sizes for each assay are provided in the respective figure legends.
To characterize the interacting effects of LPS and insulin on inflammatory responses in the BV2 cells, we conducted a 2 (with or without LPS) × 2 (with or without insulin) experimental design. This generated four experimental groups: LPS-INS-, LPS-INS+, LPS+INS-, and LPS+INS+, as indicated in the figures. The BV2 cells were seeded in culture plates at a density of 3×10⁴ cells/cm2. Sixteen hours after seeding, the cultures were treated with LPS (from Escherichia coli O55:B5, Cat#: L2880, Sigma‐Aldrich, St. Louis, MO, USA; stock concentration: 1 mg/mL, dissolved in saline) to a final concentration of 500 ng/mL or an equal volume of saline (vehicle control).
Establishment of the Dosing Regimen
To obtain an ideal dosing regimen, we first treated BV2 cells with various doses of insulin (Cat#: I0516, Sigma‐Aldrich, dissolved in 25 mm HEPES) for 2 hours. The degrees of Akt phosphorylation at S473 (pAktS473), the major mediator in the insulin signaling pathway,9 increased when insulin concentrations were 200 ng/mL or higher. To determine the effective treatment time points of insulin, we added insulin to BV2 cells 30 minutes before, concurrently, and 30 minutes after the LPS treatment. Our results showed that 500 ng/mL of LPS effectively induced phosphorylation of NF-κB p65 when insulin was given 30 minutes after, but not 30 minutes before or concurrently, significantly affected the LPS-induced NF-κB activation (data not shown). Consequently, in the following experiments, we treated BV2 cells with 200 ng/mL of insulin 30 minutes after LPS exposure (500 ng/mL) to assess the interaction between insulin and LPS. A summary of this dosing regimen, the experimental model, and subsequent examinations is provided in Figure 1.
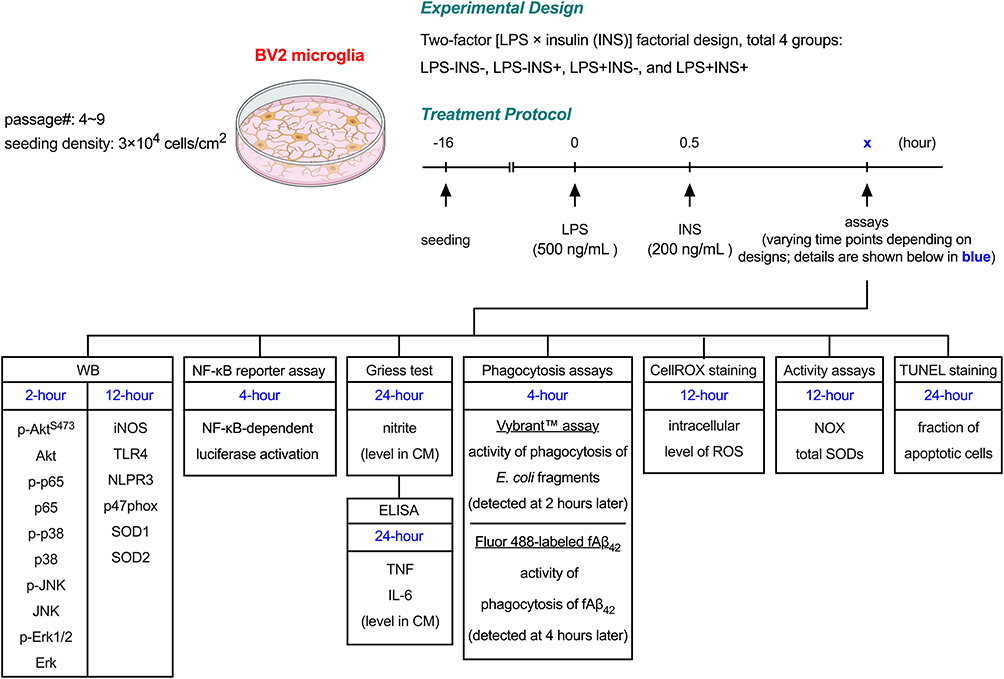 |
Figure 1 Experimental scheme of this study. |
Western Blots
The BV2 cells were collected at targeted time points and lysed in chilled RIPA buffer (Cat#: 89900, Thermo Fisher Scientific) containing protease and phosphatase inhibitors (Cat#: 04693116001 and 04906837001, Roche, Basel, Switzerland). The homogenates were centrifuged at 15,000 × g for 20 minutes at 4°C. Protein concentrations of the supernatants were determined using a BCA Kit (Cat#: 23225, Thermo Fisher Scientific) and adjusted to uniform levels. Twenty μg of total protein was mixed with the sample buffer (Cat#: S3401, Sigma‐Aldrich) supplemented with 2% β‐mercaptoethanol (Cat#:19‐1335, Sigma‐Aldrich), denatured by boiling, and resolved in polyacrylamide gels (8–15%) at 110 V for two hours. The separated proteins were transferred to PVDF membranes (Cat#: IPVH00010, Merck‐Millipore), blocked with 5% skim milk, and probed with respective primary antibodies for 16 hours at 4°C. After washing, the membranes were hybridized with proper horseradish peroxidase-conjugated secondary antibodies (goat anti‐mouse IgG: Cat#: 115‐035‐166; goat anti‐rabbit IgG: Cat#: 111‐035‐144, Jackson ImmunoResearch, West Grove, PA, USA). The bound antibodies were detected using an enhanced chemiluminescence detection kit (Cat#: WBKLS0500, Merck‐Millipore) and medical X‐ray film (Cat# Super RX, Fujifilm, Minato City, Tokyo, Japan). For re-probing, the membranes were incubated with a stripping buffer containing 2% SDS, 62.5 mm Tris, and 0.8% β‐mercaptoethanol for 20 minutes at 55°C to remove the bound antibodies. The band densities were analyzed using ImageJ software (v2.0.0‐rc‐69/1.52p, US National Institutes of Health, Bethesda, MD, USA). Relative protein expression was estimated by normalizing with levels of respective total proteins or α‐tubulin. Band densities from one identical sample applied to each gel were used to normalize band densities among gels. The antibody dilution ratios and image exposure times were optimized to confirm that the luminescence signals were within the linear range of detection. The details of the primary antibodies are listed in Table 1, and the uncropped blot images are provided in Supplementary Material 1–3.
 |
Table 1 Information of Antibodies Used in This Study |
Plasmid DNA Transfection and NF-κB Luciferase Reporter Assay
An NF-κB-dependent luciferase activation assay was conducted to analyze the activity of NF-κB-mediated transcriptional activity in the BV2 cells. Sixteen hours after seeding the cells in white-sided and clear-bottom 96-well plates (Cat#: 165306, Thermo Fisher Scientific), the cultures were transfected with the NanoLuc® reporter vector with NF-κB response element (100 ng/well, Cat#: N1111, Promega, Madison, WI, USA) by using Lipofectamine™ 3000 transfection reagent (0.3 µL/well, Cat#: L3000015, Thermo Fisher Scientific) and Lipofectamine™ P3000 reagent (0.2 µL/well, Cat#: L3000015, Thermo Fisher Scientific). Forty-eight hours after transfection, cultures were exposed to LPS and insulin as described above for four hours. The activities of NF-κB-driven luciferase were detected using the Nano-Glo® luciferase assay reagent (100 µL/well, Cat#: N1110, Promega). The intensities of luminescence signals were detected by a multi-mode reader (Model#: Synergy HT, BioTek, Winooski, VT, USA).
Griess Test
NO release in BV2 cultures was estimated by detecting nitrite levels in conditioned medium collected 24 hours after LPS treatment using a commercial Griess reagent kit (Cat#: K544, BioVision, Milpitas, CA, USA) following the manufacturer’s instructions.
ELISAs Assay
Twenty-four hours after the beginning of LPS treatment, the conditioned culture medium was collected for further examinations. The levels of pro-inflammatory cytokines, including TNF and IL-6, in the collected medium were measured using commercial ELISA kits (IL-6, Cat#: 550950; TNF, Cat#: 560478, BD Biosciences, Franklin Lakes, NJ, USA) following the manufacturer’s instructions.
Phagocytosis Assay Using Vybrant™ Phagocytosis Kit
Vybrant™ phagocytosis assay kit (Cat#: V6694, Thermo Fisher Scientific) was employed to measure the degree of phagocytosis of fluorescein-labeled E. coli BioParticles® in the BV2 microglia. BV2 cells were seeded in 96-well plates with black side and clear bottom (Cat#: 165305, Thermo Fisher Scientific) at a recommended density of 105 cells/ well. Sixteen hours post-seeding, the cells were treated with LPS and insulin as described in the Establishment of the dosing regimen. Four hours after the beginning of LPS treatment, the cultures were treated with fluorescein-labeled E. coli particles for two hours, and their activities of phagocytosis of fluorescein-labeled E. coli particles were determined following the manufacturer’s instructions and detected by a multi-mode reader (Model#: Synergy HT, BioTek).
Assay of Phagocytosis of Aβ
HiLyte™ Fluor 488-labeled beta-amyloid 1–42 (Aβ42, Cat#: AS-60479-01, AnaSpec, Fremont, CA, USA) was used to prepare fibrillar Aβ42 (fAβ42) by dissolving it in sterile water and incubating 37°C for five days.49 BV2 cells were seeded in 24-well culture plates and treated with LPS and insulin as previously described. Four hours after the beginning of LPS treatment, the cultures were treated with 5 µM of HiLyte™ Fluor 488-labeled fAβ42 for four hours. Cells were then removed by the treatment of 0.01% trypsin, centrifuged at 1000 × g for five minutes, washed with PBS twice, and suspended in PBS for the fluorescence analysis using a flow cytometer (model: BD FACSCalibur™, BD Biosciences) equipped with a FITC signal detector.
Detection of the Intracellular Level of ROS
The fluorogenic probe, CellROX™ green reagent (Cat#: C10444, Thermo Fisher Scientific), was used to measure the general level of ROS in the live BV2 cells. The cells were seeded in 8-well culture slides (Cat#: PEZGS0816, Merck‐Millipore) and treated with LPS and insulin as aforementioned. Twelve hours after the start of LPS treatment, the cells were stained with CellROX™ green reagent following the manufacturer’s instructions. The culture slides were then sealed with an aqueous mounting medium (Cat#: F4680, Sigma‐Aldrich) and imaged with an optical fluorescence microscope (Model: Axio Imager A1, Carl Zeiss) equipped with a digital camera (Model: Axiocam 305 Color, Carl Zeiss). The fluorescent density was quantified using ImageJ software (v2.0.0‐rc‐69/1.52p, US National Institutes of Health).
Terminal Deoxynucleotidyl Transferase dUTP Nick End Labeling
The effects of LPS and insulin on the extent of cellular apoptosis were detected by terminal deoxynucleotidyl transferase dUTP nick end labeling (TUNEL) staining. The BV2 cells were seeded in 8-well culture slides (Cat#: PEZGS0816, Merck‐Millipore) and treated with LPS and insulin. Twenty-four hours after the start of LPS treatment, the TUNEL staining was conducted with a commercial kit (Cat#: C10617, Thermo Fisher Scientific) following the manufacturer’s instructions. The culture slides were sealed with an aqueous mounting medium containing DAPI (Cat#: ab104139, Abcam, Cambridge, UK). The images were captured with an optical fluorescence microscope (Model: Axio Imager A1, Carl Zeiss) equipped with a digital camera (Model: Axiocam 305 Color, Carl Zeiss). The fraction of TUNEL-positive cells was analyzed and reported.
Measurements for Activities of NOX and SOD
Twelve hours after the beginning of LPS treatment, the activities of total NOX and SOD were determined using their respective commercial assay kits (NOX activity, Cat #: MBS8243191, MyBioSource, San Diego, CA, USA; SOD activity, Cat#: E-BC-K019-S, Elabscience, Houston, TX, USA) following the manufacturer’s instructions.
Statistical Analysis
All numerical data are presented in the form of box and whisker plots. Statistical analyses and graph plotting were performed using Prism software (v. 10.1.1, GraphPad Software Inc., San Diego, CA, USA). Significance was set at p < 0.05. The D’Agostino-Pearson normality test was adopted to estimate the assumption of normality. For datasets with normal distributions, an unpaired, two-tailed Student’s t-test was used to compare means in experiments with two groups. For non-normal distributed datasets, the Mann–Whitney U-test was used for comparisons of two groups. Designs with two independent variables were analyzed by two-way ANOVA followed by Tukey’s multiple comparison tests if the main effects or interactions were significant. The details of statistical analyses and results are described in Supplementary Table 1.
Results
Insulin Aggravates LPS-Induced Activation of NF-κB, Expression of iNOS, and Secretions of NO and Pro-Inflammatory Cytokines in BV2 Microglial Cells
Our results showed that, two hours after LPS treatment, levels of phosphorylated AktS473 (p-AktS473, Figure 2A and B) and NF-κB p65 (p-p65, Figure 2A and C) increased in BV2 cells. Insulin alone mildly increased levels of p-AktS473 and p-p65. The LPS-induced increases in p-AktS473 and p-p65 were aggravated by insulin (Figure 2A–C, LPS+INS- vs LPS+INS+) based on our dosing regimen (see Materials and Methods for details). Insulin enhanced LPS-induced NF-κB activation, as confirmed by the NF-κB luciferase reporter assay (Figure 2D). We then examined the expression levels of iNOS and pro-inflammatory cytokines downstream of NF-κB signaling. The basal expression level of iNOS in the BV2 cells was below our Western detection limit (Figure 2A). Twelve hours after the LPS treatment, levels of iNOS were upregulated (Figure 2A and E). Although insulin alone did not trigger iNOS expression, it potentiated LPS-induced upregulation of iNOS (Figure 2A and E, LPS+INS- vs LPS+INS+). Consistently, LPS increased NO production in these cells, which was further potentiated by insulin (Figure 2F). A similar increase was observed in the production of TNF (Figure 2G) and IL-6 (Figure 2H). These results indicated that insulin aggravates the LPS-induced secretion of pro-inflammatory mediators in BV2 microglial cells.
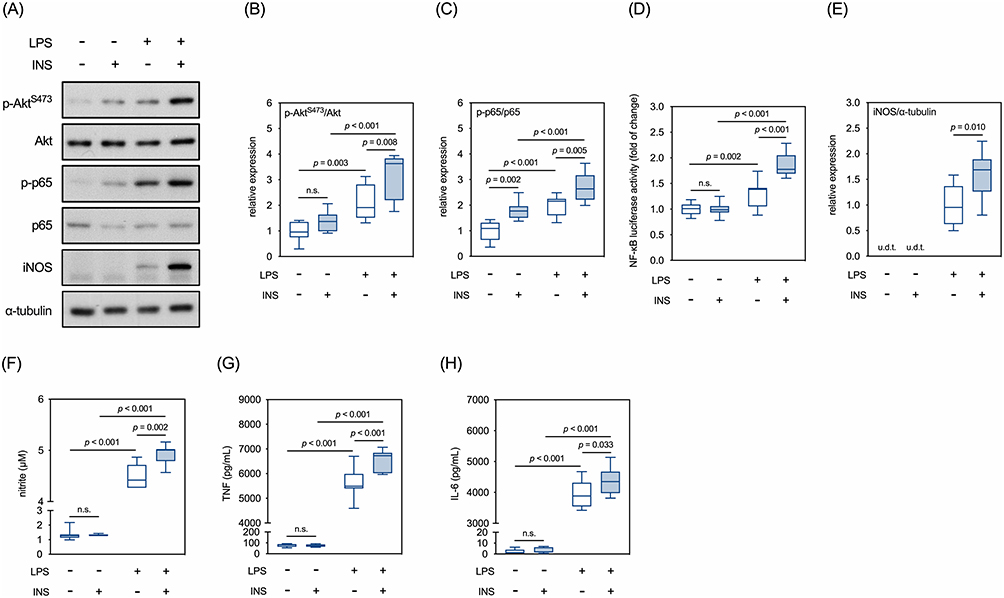 |
Figure 2 Effects of LPS and insulin on Akt/NF-κB signaling and secretions of pro-inflammatory mediators in BV2 microglial cells. (A) Representative Western blots for selected molecules involved in AKT/NF-κB signaling cascades. (B) Quantitative results of relative levels of p-Akt. (C) Quantitative results of relative levels of p-p65. (D) Quantitative results of NF-κB luciferase reporter assay. (E) Quantitative results of relative levels of iNOS. (F) Quantitative results of the Griess assay in the conditioned media. (G) Quantitative results of levels of TNF in the conditioned media. (H) Quantitative results of levels of IL-6 in the conditioned media. u.d.t., under the detective threshold. n.s., not significant. Sample size = 9 biological replicates in Western blots, Griess assay, and ELISA assays; 12 biological replicates in NF-κB luciferase reporter assay. See also Supplementary Table 1 for details of the statistical test results. |
Insulin Does Not Affect LPS-Induced Activation of TLR4-Mediated MAPK Signaling in BV2 Microglial Cells
Next, we determined the effects of insulin on the TLR4/MAPK signaling pathway in the BV2 cells. Two hours after LPS treatment, phosphorylation levels of p38, JNK, and Erk1/2 were significantly increased (Figure 3A–D). Post-treatment of insulin did not affect LPS-induced increases in phosphorylation levels of any of the three MAPKs (Figure 3A–D). The effects of LPS and insulin on expressions of TLR4 and NLRP3 were determined 12 hours after the LPS treatment. Neither LPS nor insulin affected the expression levels of TLR4 (Figure 3A and E). The expression of NLRP3 was significantly altered (upregulated) by LPS but not insulin (Figure 3A and F). These results suggested that insulin does not affect the LPS-induced activation of TLR4-MAPK signaling pathway.
 |
Figure 3 Effects of LPS and insulin on TLR4/MAPK signaling in BV2 microglial cells. (A) Representative Western blots for TLR4/MAPK signaling and NLRP3. (B-D) Quantitative results of relative levels of phosphorylated p38, JNK, and Erk1&2. (E and F) Quantitative results of relative levels of TLR4 and NLRP3. u.d.t., under detective threshold. n.s., not significant. Sample size = 9 biological replicates in each assay. See also Supplementary Table 1 for details of the statistical test results. |
Insulin and LPS Enhance the Phagocytic Activity of BV2 Microglial Cells
The abilities of BV2 cells to phagocytose fluorescein-labeled E. coli fragments and fAβ42 were examined. Our results showed that both insulin and LPS alone enhanced phagocytosis of fluorescein-labeled E. coli fragments (Figure 4A). The combination of both treatments induced even higher phagocytic activity than either alone (Figure 4A). Similarly, insulin and LPS alone enhanced phagocytosis of fAβ42, with the combination of the two treatments induced even higher phagocytic activity than either treatment alone (Figure 4B). These results indicated that both insulin and LPS enhance the phagocytic activity of BV2 microglial cells.
 |
Figure 4 Effects of LPS and insulin on phagocytic activity of BV2 microglial cells. (A) Quantitative results of Vybrant™ phagocytosis assay. (B) Quantitative results of phagocytosis of HiLyte™ Fluor 488-labeled fAβ42. The left panel showed the overlayed histograms of flow cytometry. The right panel showed the quantitative results of flow cytometry. Sample size = 9 biological replicates in (A); 3 biological replicates in (B). See also Supplementary Table 1 for details of the statistical test results. |
Insulin Inhibits LPS-Induced Intracellular ROS Accumulation and Apoptosis in BV2 Microglial Cells
Twelve hours after LPS treatment, levels of intracellular ROS in BV2 cells were increased, which was attenuated by insulin (Figure 5A). Accordingly, we then explored the effects of LPS and insulin on the activity and expression of molecules that modulate ROS levels, such as NOX and SODs. Our results showed that the activities of NOX in the BV2 cells were increased by LPS treatment, which were completely suppressed by insulin (Figure 5B). Interestingly, insulin alone inhibited the basal activities of NOX (Figure 5B). The levels of p47phox, a cytosolic subunit of NOX, were increased by LPS, which were repressed by insulin (Figure 5C). Furthermore, LPS increased the activities of total SOD in BV2 cells, which were not affected by insulin (Figure 5D). LPS increased the expression of SOD2 but not SOD1, and insulin exerted no effect on the levels of either protein, regardless of LPS treatment. (Figure 5E). Since accumulated ROS contributes to LPS-induced cell death,50,51 we examined whether insulin affects LPS-induced apoptosis in these cells. In parallel to the ROS levels, numbers of TUNEL+ cells increased 24 hours after LPS treatment, which were reversed by the presence of insulin (Figure 6A and B). Taken together, these results suggested that insulin mitigates LPS-induced oxidative stress and apoptosis, partly by repressing NOX activity in BV2 cells.
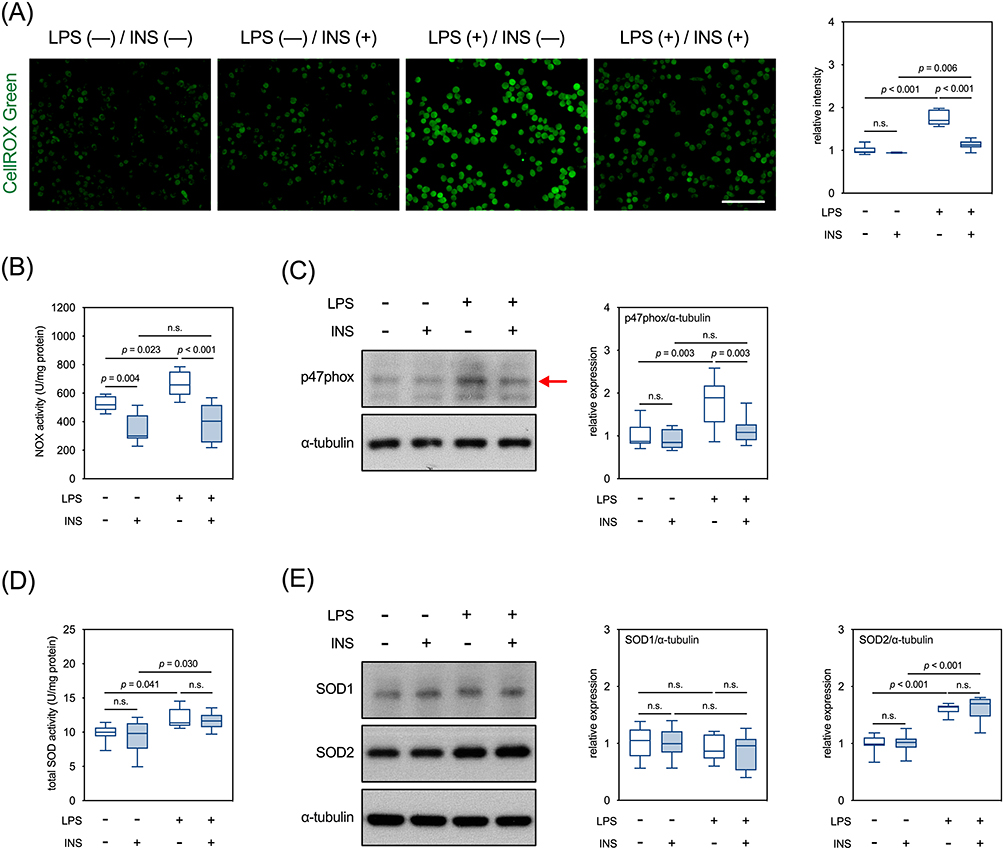 |
Figure 5 Effects of LPS and insulin on intracellular accumulation of ROS in BV2 microglial cells. (A) Representative micrographs and quantitative results of CellROX™ green staining. Scale bar: 100 µm. (B) Quantitative results of NOX activity. (C) Representative Western blots and quantitative results of p47phox. The red arrow indicates the accurate molecular size. (D) Quantitative results of total SOD activity. (E) Representative Western blots and quantitative results of SOD1 and SOD2. n.s., not significant. Sample size = 9 biological replicates in each assay. See also Supplementary Table 1 for details of the statistical test results. |
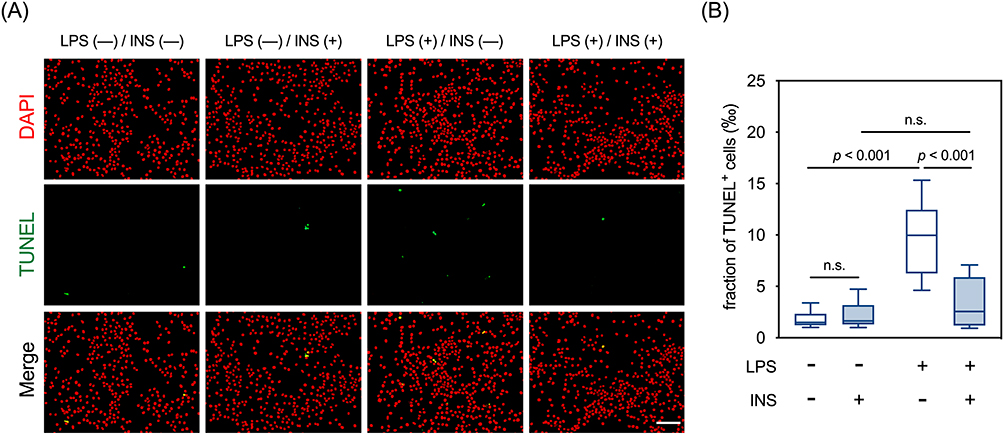 |
Figure 6 Effects of LPS and insulin on apoptosis in BV2 microglial cells. (A) Representative micrographs of TUNEL staining. Scale bar: 100 µm. (B) Quantitative results of TUNEL staining. n.s., not significant. Sample size = 12 biological replicates. See also Supplementary Table 1 for details of the statistical test results. |
Discussion
Beyond its glucose-lowering effects, insulin is also known to modulate immune responses in macrophages.6 Notably, insulin also plays a prominent role in modulating microglia-mediated immune responses, as the brain is insulin-sensitive.17 However, studies examining the role of insulin in microglial immune modulation indicate the complexity of its effects on CNS immune responses, varying based on treatment protocols and the presence or absence of inflammagen stimuli.22–25 Therefore, understanding the molecular mechanisms through which insulin regulates microglial immune responses and interacts with inflammatory agents is crucial for gaining deeper insight into its role in neuroinflammation. By adopting the well-established LPS-induced innate immune response, we showed that insulin potentiated LPS-induced productions of NO and pro-inflammatory cytokines through the Akt/NF-κB pathway and enhanced phagocytic activity of BV2 microglial cells. Moreover, insulin repressed LPS-induced increases in levels of intracellular ROS and apoptosis, partially by inhibiting the activities and levels of NOX. Our results suggested that insulin not only enhances immunocompetence but also counteracts oxidative damage in microglia challenged by endotoxin.
The PI3K/Akt signaling pathway has been shown to be essential for LPS-induced microglial activation.52 Pharmacological inhibition of Akt blocks LPS-induced activation of NF-κB and upregulation of iNOS in chick primary microglia.52 Since the PI3K/Akt pathway is a key component of the insulin signaling cascade,9 it was not surprising to observe that insulin enhanced LPS-induced production of inflammatory mediators in our study. However, PI3K/Akt-mediated immune responses are not uniform across all mononuclear phagocytic cells. For instance, in RAW 264.7 macrophages, inhibition of the PI3K/Akt pathway following LPS exposure increases iNOS expression through sustained NF-κB activation, rather than decreasing it.53 Interestingly, contrary to our findings, other studies report that insulin reduces the production of pro-inflammatory mediators in endotoxemic human macrophages and BV2 microglia.22,54 One possible explanation for these discrepancies may lie in the varying LPS strains used across experiments. It is known that LPS derived from different Gram-negative bacterial strains can trigger distinct innate immune responses.55,56 Another factor could be the different dosing regimens of LPS and insulin used in these studies. In our study, we employed a relatively high dose of LPS (500 ng/mL) to achieve significant induction of iNOS expression. Additionally, we observed that administering insulin 30 minutes after LPS treatment produced a more pronounced effect than when it was given 30 minutes before or concurrently with LPS. Furthermore, high doses of insulin (>100 nM) have been shown to independently increase pro-inflammatory cytokine expression in both BV2 cells and primary microglia.23 Similarly, a five-day intracerebroventricular infusion of insulin has been reported to activate microglia, as indicated by elevated inflammatory markers in the hippocampus of young adult rats.24 These results suggested that the strengths and kinetics between LPS- and insulin-induced signaling are critical determining factors for insulin-mediated immune responses in microglia.
The effects of insulin on the phagocytic activity of peripheral innate immune cells have been well-studied.57–60 Given that microglial phagocytosis has recently emerged as a critical factor in regulating several CNS diseases,61,62 we sought to investigate the interacting effects of insulin and LPS on microglial phagocytosis. Consistent with previous studies,22 our results showed that insulin significantly enhances the ability of BV2 microglia to phagocytose both bacterial components and fAβ42. Insoluble Aβ filaments are the primary constituents of extracellular amyloid plaques, which represent one of the hallmark pathologies of AD.63 Microglial phagocytosis plays a crucial role in the pathogenesis of AD.2,64,65 Interestingly, AD has been classified as type 3 diabetes, a disease manifesting as insulin resistance in the brain.31,32 Whether insulin resistance in microglia contributes to impaired Aβ clearance and subsequent Aβ deposition in the AD brain warrants further investigation. It has been shown that fAβ interacts with microglial surface receptor complexes, triggering both inflammation and Aβ phagocytosis.66–68 Moreover, activation of microglia through TLRs enhances Aβ clearance in microglial cultures,66–68 aligning with our findings that LPS treatment alone increased the phagocytosis of fAβ42. However, the overall impact of LPS on microglial phagocytic activity remains debated. The capabilities of mouse primary microglia to phagocytose IgG-coated sheep erythrocytes and pHrodo-labeled synaptosomes were enhanced by LPS at 2 μg/ mL69 and 100 ng/mL,70 respectively. Conversely, lower doses of LPS (5 ng/mL) have been reported to suppress the phagocytosis of E. coli bioparticles in the CD11b-expressing mouse primary microglia.71 Whether these conflicting results arise from differences in LPS strains or dosing regimens requires further clarification.
Our results revealed that insulin inhibited the LPS-induced intracellular accumulation of ROS in the BV2 cells. Similar antioxidative actions of insulin have been found in LPS-challenged human polymorphonuclear leukocytes.72 In agreement with these findings, we also found that insulin decreased the activities and expression levels of NOX. However, the effects of insulin on intracellular levels of ROS and NOX also vary depending on the cell types. It has been demonstrated that insulin upregulates the expression of NOX2, the vascular isoform of NOX, and increases the production of ROS in human adipose microvascular endothelial cells.73 Moreover, we found that LPS, but not insulin, elevated the total SOD activity and elevated the level of SOD2 in the BV2 cells without affecting the expression of SOD1. Consistently, LPS also induces SOD2 expression in macrophages treated with an apoptosis-inducing factor.74 The upregulation of SOD2, located mainly in the mitochondria, may represent a compensatory defense mechanism to counteract LPS-induced oxidative damage in the innate immune cells.
This study has several limitations. While the BV2 microglial cell line is often used as a substitute for primary microglia due to their similarities, including the expression of NADPH oxidase75,76 and comparable transcriptomic and proteomic profiles following LPS stimulation,77 more recent studies have raised concerns. Notably, proteomic differences between BV2 cells and primary microglia have been identified under M1 and M2 polarization and irradiation conditions.78 Beyond the limitations of the cell line, translating these findings to human microglia and in vivo models poses further challenges. This is primarily due to the limited availability of nonpathological primary human microglia and the complexity of cell-type-specific effects of insulin in the brain.17 As such, future research using human microglia and in vivo models will be crucial to assess the applicability of these findings to human neuroinflammation. These limitations should be carefully considered when interpreting the results of this study.
Conclusion
Our results suggested that insulin 1) increases releases of Akt/NF-κB pathway-mediated pro-inflammatory mediators, 2) enhances phagocytotic activity, and 3) counteracts oxidative damage through repressing activity and expression of NOXs in microglia activated by endotoxin. These results provide insights into the molecular mechanisms through which insulin modulates microglial immune responses and contribute to understanding the potential of insulin as an anti-oxidative, anti-inflammatory, or anti-amyloid agent. This study may also offer new perspectives on the role of insulin resistance in neuroinflammation.
Funding
This work was supported by the following grants: 1) National Cheng Kung University Hospital, Tainan, Taiwan (Grant #: NCKUH-11204055, SCL), 2) Kaohsiung Medical University, Kaohsiung, Taiwan (Grant #: KMU-Q-112004, KMU-Q-113008, PLH), 3) the National Science and Technology Council, Taiwan (Grant #: 109-2326-B-037-002-MY3, 113-2320-B-037-027-MY3, PLH; Grant #: 109-2320-B-006-043-MY3, 110-2811-B-006-546, 112-2811-B-006-020, 113-2811-B-006-035, and 112-2320-B-006-042-MY3, YMK), and 4) National Health Research Institutes, Taiwan (Grant#: NHRI-EX113-11207NI, YMK).
Disclosure
The authors report no conflicts of interest in this work.
References
1. Wang TF, Wu SY, Pan BS, Tsai SF, Kuo YM. Inhibition of nigral microglial activation reduces age-related loss of dopaminergic neurons and motor deficits. Cells. 2022;11(3). doi:10.3390/cells11030481
2. Kiani Shabestari S, Morabito S, Danhash EP, et al. Absence of microglia promotes diverse pathologies and early lethality in Alzheimer’s disease mice. Cell Rep. 2022;39(11):110961. doi:10.1016/j.celrep.2022.110961
3. Heppner FL, Ransohoff RM, Becher B. Immune attack: the role of inflammation in Alzheimer disease. Nat Rev Neurosci. 2015;16(6):358–372. doi:10.1038/nrn3880
4. Nimmerjahn A, Kirchhoff F, Helmchen F. Resting microglial cells are highly dynamic surveillants of brain parenchyma in vivo. Science. 2005;308(5726):1314–1318. doi:10.1126/science.1110647
5. Hanisch UK, Kettenmann H. Microglia: active sensor and versatile effector cells in the normal and pathologic brain. Nat Neurosci. 2007;10(11):1387–1394. doi:10.1038/nn1997
6. Sun Q, Li J, Gao F. New insights into insulin: the anti-inflammatory effect and its clinical relevance. World J Diabetes. 2014;5(2):89–96. doi:10.4239/wjd.v5.i2.89
7. Aljada A, Ghanim H, Saadeh R, Dandona P. Insulin inhibits NFkappaB and MCP-1 expression in human aortic endothelial cells. J Clin Endocrinol Metab. 2001;86(1):450–453. doi:10.1210/jcem.86.1.7278
8. Anderson RA, Boronenkov IV, Doughman SD, Kunz J, Loijens JC. Phosphatidylinositol phosphate kinases, a multifaceted family of signaling enzymes. J Biol Chem. 1999;274(15):9907–9910. doi:10.1074/jbc.274.15.9907
9. Mackenzie RW, Elliott BT. Akt/PKB activation and insulin signaling: a novel insulin signaling pathway in the treatment of type 2 diabetes. Diabetes Metab Syndr Obes. 2014;7:55–64. doi:10.2147/DMSO.S48260
10. Grover A, Padginton C, Wilson MF, Sung BH, Izzo JL Jr, Dandona P. Insulin attenuates norepinephrine-induced venoconstriction. An ultrasonographic study. Hypertension. 1995;25(4):779–784. (). doi:10.1161/01.HYP.25.4.779
11. Steinberg HO, Brechtel G, Johnson A, Fineberg N, Baron AD. Insulin-mediated skeletal muscle vasodilation is nitric oxide dependent. A novel action of insulin to increase nitric oxide release. J Clin Invest. 1994;94(3):1172–1179. doi:10.1172/JCI117433
12. Aljada A, Saadeh R, Assian E, Ghanim H, Dandona P. Insulin inhibits the expression of intercellular adhesion molecule-1 by human aortic endothelial cells through stimulation of nitric oxide. J Clin Endocrinol Metab. 2000;85(7):2572–2575. doi:10.1210/jcem.85.7.6677
13. Li J, Wu F, Zhang H, et al. Insulin inhibits leukocyte-endothelium adherence via an Akt-NO-dependent mechanism in myocardial ischemia/reperfusion. J Mol Cell Cardiol. 2009;47(4):512–519. doi:10.1016/j.yjmcc.2009.07.010
14. Jeschke MG, Klein D, Bolder U, Einspanier R. Insulin attenuates the systemic inflammatory response in endotoxemic rats. Endocrinology. 2004;145(9):4084–4093. doi:10.1210/en.2004-0592
15. Brix-Christensen V, Andersen SK, Andersen R, et al. Acute hyperinsulinemia restrains endotoxin-induced systemic inflammatory response: an experimental study in a porcine model. Anesthesiology. 2004;100(4):861–870. doi:10.1097/00000542-200404000-00016
16. Ghanim H, Mohanty P, Deopurkar R, et al. Acute modulation of toll-like receptors by insulin. Diabetes Care. 2008;31(9):1827–1831. doi:10.2337/dc08-0561
17. Chen W, Cai W, Hoover B, Kahn CR. Insulin action in the brain: cell types, circuits, and diseases. Trends Neurosci. 2022;45(5):384–400. doi:10.1016/j.tins.2022.03.001
18. Ghasemi R, Haeri A, Dargahi L, Mohamed Z, Ahmadiani A. Insulin in the brain: sources, localization and functions. Mol Neurobiol. 2013;47(1):145–171. doi:10.1007/s12035-012-8339-9
19. Derakhshan F, Toth C. Insulin and the brain. Curr Diabetes Rev. 2013;9(2):102–116.
20. Gabbouj S, Ryhanen S, Marttinen M, et al. Altered insulin signaling in alzheimer’s disease brain - special emphasis on PI3K-Akt pathway. Front Neurosci. 2019;13:629. doi:10.3389/fnins.2019.00629
21. Lee SH, Zabolotny JM, Huang H, Lee H, Kim YB. Insulin in the nervous system and the mind: functions in metabolism, memory, and mood. Mol Metab. 2016;5(8):589–601. doi:10.1016/j.molmet.2016.06.011
22. Brabazon F, Bermudez S, Shaughness M, Khayrullina G, Byrnes KR. The effects of insulin on the inflammatory activity of BV2 microglia. PLoS One. 2018;13(8):e0201878. doi:10.1371/journal.pone.0201878
23. Yang X, Xu Y, Gao W, et al. Hyperinsulinemia-induced microglial mitochondrial dynamic and metabolic alterations lead to neuroinflammation in vivo and in vitro. Front Neurosci. 2022;16:1036872. doi:10.3389/fnins.2022.1036872
24. Haas CB, de Carvalho AK, Muller AP, Eggen BJL, Portela LV. Insulin activates microglia and increases COX-2/IL-1beta expression in young but not in aged hippocampus. Brain Res. 2020;1741:146884. doi:10.1016/j.brainres.2020.146884
25. Sun M, Li Y, Liu M, et al. Insulin alleviates lipopolysaccharide-induced cognitive impairment via inhibiting neuroinflammation and ferroptosis. Eur J Pharmacol. 2023;955:175929. doi:10.1016/j.ejphar.2023.175929
26. Najem D, Bamji-Mirza M, Chang N, Liu QY, Zhang W. Insulin resistance, neuroinflammation, and Alzheimer’s disease. Rev Neurosci. 2014;25(4):509–525. doi:10.1515/revneuro-2013-0050
27. Van Dyken P, Lacoste B. Impact of metabolic syndrome on neuroinflammation and the blood-brain barrier. Front Neurosci. 2018;12:930. doi:10.3389/fnins.2018.00930
28. Better MAAlzheimer’s disease facts and figures. Alzheimers Dement. 2023;19(4):1598–1695. doi:10.1002/alz.13016
29. Probst A, Langui D, Ulrich J. Alzheimer’s disease: a description of the structural lesions. Brain Pathol. 1991;1(4):229–239. doi:10.1111/j.1750-3639.1991.tb00666.x
30. Biessels GJ, Staekenborg S, Brunner E, Brayne C, Scheltens P. Risk of dementia in diabetes mellitus: a systematic review. Lancet Neurol. 2006;5(1):64–74. doi:10.1016/S1474-4422(05)70284-2
31. Arnold SE, Arvanitakis Z, Macauley-Rambach SL, et al. Brain insulin resistance in type 2 diabetes and Alzheimer disease: concepts and conundrums. Nat Rev Neurol. 2018;14(3):168–181. doi:10.1038/nrneurol.2017.185
32. Nguyen TT, Ta QTH, Nguyen TKO, Nguyen TTD, Giau VV. Type 3 diabetes and its role implications in Alzheimer’s disease. Int J Mol Sci. 2020;21(9):3165. doi:10.3390/ijms21093165
33. Steen E, Terry BM, Rivera EJ, et al. Impaired insulin and insulin-like growth factor expression and signaling mechanisms in Alzheimer’s disease--is this type 3 diabetes? J Alzheimers Dis. 2005;7(1):63–80. doi:10.3233/JAD-2005-7107
34. Rivera EJ, Goldin A, Fulmer N, Tavares R, Wands JR, de la Monte SM. Insulin and insulin-like growth factor expression and function deteriorate with progression of Alzheimer’s disease: link to brain reductions in acetylcholine. J Alzheimers Dis. 2005;8(3):247–268. doi:10.3233/JAD-2005-8304
35. Lee CY, Landreth GE. The role of microglia in amyloid clearance from the AD brain. J Neural Transm. 2010;117(8):949–960. doi:10.1007/s00702-010-0433-4
36. Bard F, Cannon C, Barbour R, et al. Peripherally administered antibodies against amyloid beta-peptide enter the central nervous system and reduce pathology in a mouse model of Alzheimer disease. Nat Med. 2000;6(8):916–919. doi:10.1038/78682
37. Bamberger ME, Harris ME, McDonald DR, Husemann J, Landreth GE. A cell surface receptor complex for fibrillar beta-amyloid mediates microglial activation. J Neurosci. 2003;23(7):2665–2674. doi:10.1523/JNEUROSCI.23-07-02665.2003
38. Grathwohl SA, Kalin RE, Bolmont T, et al. Formation and maintenance of Alzheimer’s disease beta-amyloid plaques in the absence of microglia. Nat Neurosci. 2009;12(11):1361–1363. doi:10.1038/nn.2432
39. Lu YC, Yeh WC, Ohashi PS. LPS/TLR4 signal transduction pathway. Cytokine. 2008;42(2):145–151. doi:10.1016/j.cyto.2008.01.006
40. Guo H, Callaway JB, Ting JP. Inflammasomes: mechanism of action, role in disease, and therapeutics. Nat Med. 2015;21(7):677–687. doi:10.1038/nm.3893
41. Chan ED, Riches DW. IFN-gamma + LPS induction of iNOS is modulated by ERK, JNK/SAPK, and p38(MAPK) in a mouse macrophage cell line. Am J Physiol Cell Physiol. 2001;280(3):C441–50. doi:10.1152/ajpcell.2001.280.3.C441
42. Wu TT, Chen TL, Chen RM. Lipopolysaccharide triggers macrophage activation of inflammatory cytokine expression, chemotaxis, phagocytosis, and oxidative ability via a toll-like receptor 4-dependent pathway: validated by RNA interference. Toxicol Lett. 2009;191(2–3):195–202. doi:10.1016/j.toxlet.2009.08.025
43. Feng X, Deng T, Zhang Y, Su S, Wei C, Han D. Lipopolysaccharide inhibits macrophage phagocytosis of apoptotic neutrophils by regulating the production of tumour necrosis factor alpha and growth arrest-specific gene 6. Immunology. 2011;132(2):287–295. doi:10.1111/j.1365-2567.2010.03364.x
44. Hsu HY, Wen MH. Lipopolysaccharide-mediated reactive oxygen species and signal transduction in the regulation of interleukin-1 gene expression. J Biol Chem. 2002;277(25):22131–22139. doi:10.1074/jbc.M111883200
45. Bedard K, Krause KH. The NOX family of ROS-generating NADPH oxidases: physiology and pathophysiology. Physiol Rev. 2007;87(1):245–313. doi:10.1152/physrev.00044.2005
46. Collins Y, Chouchani ET, James AM, Menger KE, Cocheme HM, Murphy MP. Mitochondrial redox signalling at a glance. J Cell Sci. 2012;125(Pt 4):801–806. doi:10.1242/jcs.098475
47. Panday A, Sahoo MK, Osorio D, Batra S. NADPH oxidases: an overview from structure to innate immunity-associated pathologies. Cell Mol Immunol. 2015;12(1):5–23. doi:10.1038/cmi.2014.89
48. Wang Y, Branicky R, Noe A, Hekimi S. Superoxide dismutases: dual roles in controlling ROS damage and regulating ROS signaling. J Cell Biol. 2018;217(6):1915–1928. doi:10.1083/jcb.201708007
49. Burdick D, Soreghan B, Kwon M, et al. Assembly and aggregation properties of synthetic Alzheimer’s A4/beta amyloid peptide analogs. J Biol Chem. 1992;267(1):546–554. doi:10.1016/S0021-9258(18)48529-8
50. Guzel M, Akpinar O. Hydroxychloroquine attenuates acute inflammation (LPS)-induced apoptosis via inhibiting TRPV1 channel/ROS signaling pathways in human monocytes. Biology. 2021;10(10):967. doi:10.3390/biology10100967
51. Raza H, John A, Shafarin J. Potentiation of LPS-induced apoptotic cell death in human hepatoma HepG2 Cells by aspirin via ROS and mitochondrial dysfunction: protection by N-Acetyl cysteine. PLoS One. 2016;11(7):e0159750. doi:10.1371/journal.pone.0159750
52. Saponaro C, Cianciulli A, Calvello R, Dragone T, Iacobazzi F, Panaro MA. The PI3K/Akt pathway is required for LPS activation of microglial cells. Immunopharmacol Immunotoxicol. 2012;34(5):858–865. doi:10.3109/08923973.2012.665461
53. Diaz-Guerra MJ, Castrillo A, Martin-Sanz P, Bosca L. Negative regulation by phosphatidylinositol 3-kinase of inducible nitric oxide synthase expression in macrophages. J Immunol. 1999;162(10):6184–6190. doi:10.4049/jimmunol.162.10.6184
54. Leffler M, Hrach T, Stuerzl M, Horch RE, Herndon DN, Jeschke MG. Insulin attenuates apoptosis and exerts anti-inflammatory effects in endotoxemic human macrophages. J Surg Res. 2007;143(2):398–406. doi:10.1016/j.jss.2007.01.030
55. Muotiala A, Helander IM, Pyhala L, Kosunen TU, Moran AP. Low biological activity of helicobacter pylori lipopolysaccharide. Infect Immun. 1992;60(4):1714–1716. doi:10.1128/iai.60.4.1714-1716.1992
56. Nielsen H, Birkholz S, Andersen LP, Moran AP. Neutrophil activation by helicobacter pylori lipopolysaccharides. J Infect Dis. 1994;170(1):135–139. doi:10.1093/infdis/170.1.135
57. Rassias AJ, Givan AL, Marrin CA, Whalen K, Pahl J, Yeager MP. Insulin increases neutrophil count and phagocytic capacity after cardiac surgery. Anesth Analg. 2002;94(5):1113–1119. (). doi:10.1097/00000539-200205000-00010
58. Saiepour D, Sehlin J, Oldenborg PA. Insulin inhibits phagocytosis in normal human neutrophils via PKCalpha/beta-dependent priming of F-actin assembly. Inflamm Res. 2006;55(3):85–91. doi:10.1007/s00011-005-0009-1
59. Davidson NJ, Sowden JM, Fletcher J. Defective phagocytosis in insulin controlled diabetics: evidence for a reaction between glucose and opsonising proteins.. J Clin Pathol. 1984;37(7):783–786. doi:10.1136/jcp.37.7.783
60. Rassias AJ, Marrin CA, Arruda J, Whalen PK, Beach M, Yeager MP. Insulin infusion improves neutrophil function in diabetic cardiac surgery patients. Anesth Analg. 1999;88(5):1011–1016. doi:10.1097/00000539-199905000-00008
61. Fu R, Shen Q, Xu P, Luo JJ, Tang Y. Phagocytosis of microglia in the central nervous system diseases. Mol Neurobiol. 2014;49(3):1422–1434. doi:10.1007/s12035-013-8620-6
62. Podlesny-Drabiniok A, Marcora E, Goate AM. Microglial phagocytosis: a disease-associated process emerging from Alzheimer’s disease genetics. Trends Neurosci. 2020;43(12):965–979. doi:10.1016/j.tins.2020.10.002
63. Scheltens P, De Strooper B, Kivipelto M, et al. Alzheimer’s disease. Lancet. 2021;397(10284):1577–1590. doi:10.1016/S0140-6736(20)32205-4
64. Rogers J, Lue LF. Microglial chemotaxis, activation, and phagocytosis of amyloid beta-peptide as linked phenomena in Alzheimer’s disease. Neurochem Int. 2001;39(5–6):333–340. doi:10.1016/S0197-0186(01)00040-7
65. Brelstaff JH, Mason M, Katsinelos T, et al. Microglia become hypofunctional and release metalloproteases and tau seeds when phagocytosing live neurons with P301S tau aggregates. Sci Adv. 2021;7(43):eabg4980. doi:10.1126/sciadv.abg4980
66. Reed-Geaghan EG, Savage JC, Hise AG, Landreth GE. CD14 and toll-like receptors 2 and 4 are required for fibrillar A{beta}-stimulated microglial activation. J Neurosci. 2009;29(38):11982–11992. doi:10.1523/JNEUROSCI.3158-09.2009
67. Doi Y, Mizuno T, Maki Y, et al. Microglia activated with the toll-like receptor 9 ligand CpG attenuate oligomeric amyloid {beta} neurotoxicity in in vitro and in vivo models of Alzheimer’s disease. Am J Pathol. 2009;175(5):2121–2132. doi:10.2353/ajpath.2009.090418
68. Tahara K, Kim HD, Jin JJ, Maxwell JA, Li L, Fukuchi K. Role of toll-like receptor signalling in abeta uptake and clearance. Brain. 2006;129(Pt 11):3006–3019. doi:10.1093/brain/awl249
69. abd-el-Basset E, Fedoroff S. Effect of bacterial wall lipopolysaccharide (LPS) on morphology, motility, and cytoskeletal organization of microglia in cultures. J Neurosci Res. 1995;41(2):222–237. doi:10.1002/jnr.490410210
70. He Y, Taylor N, Yao X, Bhattacharya A. Mouse primary microglia respond differently to LPS and poly(I:C) in vitro. Sci Rep. 2021;11(1):10447. doi:10.1038/s41598-021-89777-1
71. Mukai T, Di Martino E, Tsuji S, Blomgren K, Nagamura-Inoue T, Aden U. Umbilical cord-derived mesenchymal stromal cells immunomodulate and restore actin dynamics and phagocytosis of LPS-activated microglia via PI3K/Akt/Rho GTPase pathway. Cell Death Discov. 2021;7(1):46. doi:10.1038/s41420-021-00436-w
72. Dandona P, Ghanim H, Bandyopadhyay A, et al. Insulin suppresses endotoxin-induced oxidative, nitrosative, and inflammatory stress in humans. Diabetes Care. 2010;33(11):2416–2423. doi:10.2337/dc10-0929
73. Mahmoud AM, Ali MM, Miranda ER, et al. Nox2 contributes to hyperinsulinemia-induced redox imbalance and impaired vascular function. Redox Biol. 2017;13:288–300. doi:10.1016/j.redox.2017.06.001
74. Regdon Z, Robaszkiewicz A, Kovacs K, et al. LPS protects macrophages from AIF-independent parthanatos by downregulation of PARP1 expression, induction of SOD2 expression, and a metabolic shift to aerobic glycolysis. Free Radic Biol Med. 2019;131:184–196. doi:10.1016/j.freeradbiomed.2018.11.034
75. Wu DC, Re DB, Nagai M, Ischiropoulos H, Przedborski S. The inflammatory NADPH oxidase enzyme modulates motor neuron degeneration in amyotrophic lateral sclerosis mice. Proc Natl Acad Sci U S A. 2006;103(32):12132–12137. doi:10.1073/pnas.0603670103
76. Yang CS, Lee HM, Lee JY, et al. Reactive oxygen species and p47phox activation are essential for the mycobacterium tuberculosis-induced pro-inflammatory response in murine microglia. J Neuroinflammation. 2007;4(1):27. doi:10.1186/1742-2094-4-27
77. Henn A, Lund S, Hedtjarn M, Schrattenholz A, Porzgen P, Leist M. The suitability of BV2 cells as alternative model system for primary microglia cultures or for animal experiments examining brain inflammation. ALTEX. 2009;26(2):83–94. doi:10.14573/altex.2009.2.83
78. Luan W, Li M, Wu C, Shen X, Sun Z. Proteomic dissimilarities of primary microglia and BV2 cells under stimuli. Eur J Neurosci. 2022;55(7):1709–1723. doi:10.1111/ejn.15637
 © 2024 The Author(s). This work is published and licensed by Dove Medical Press Limited. The
full terms of this license are available at https://www.dovepress.com/terms.php
and incorporate the Creative Commons Attribution
- Non Commercial (unported, 3.0) License.
By accessing the work you hereby accept the Terms. Non-commercial uses of the work are permitted
without any further permission from Dove Medical Press Limited, provided the work is properly
attributed. For permission for commercial use of this work, please see paragraphs 4.2 and 5 of our Terms.
© 2024 The Author(s). This work is published and licensed by Dove Medical Press Limited. The
full terms of this license are available at https://www.dovepress.com/terms.php
and incorporate the Creative Commons Attribution
- Non Commercial (unported, 3.0) License.
By accessing the work you hereby accept the Terms. Non-commercial uses of the work are permitted
without any further permission from Dove Medical Press Limited, provided the work is properly
attributed. For permission for commercial use of this work, please see paragraphs 4.2 and 5 of our Terms.