")
Back to Journals » Journal of Inflammation Research » Volume 18
Integrated Single-Cell and Spatial Transcriptomic Analysis Identifies ISR-Related Genes Driving Immune Regulation in Parkinson’s Disease
Authors Jiang H, Zhang X , Feng S, Feng W
Received 10 February 2025
Accepted for publication 1 July 2025
Published 15 July 2025 Volume 2025:18 Pages 9321—9341
DOI https://doi.org/10.2147/JIR.S521744
Checked for plagiarism Yes
Review by Single anonymous peer review
Peer reviewer comments 4
Editor who approved publication: Professor Ning Quan
Hua Jiang,1 Xiaotian Zhang,2,3 Shengyu Feng,2,3 Wei Feng2,3
1Clinical Laboratory, Beijing Tiantan Hospital, Capital Medical University, Beijing, People’s Republic of China; 2Department of Anesthesiology, The Affiliated Hospital of Qingdao University, Qingdao, Shandong, People’s Republic of China; 3Laboratory of Anesthesia and Brain Function, The Affiliated Hospital of Qingdao University Qingdao, Shandong, People’s Republic of China
Correspondence: Wei Feng, Department of Anesthesiology, The Affiliated Hospital of Qingdao University, Qingdao, Shandong, People’s Republic of China, Email [email protected] Shengyu Feng, Department of Anesthesiology, The Affiliated Hospital of Qingdao University, Qingdao, Shandong, People’s Republic of China, Email [email protected]
Background: Parkinson’s disease (PD) is a progressive neurodegenerative disorder marked by motor dysfunction and dopaminergic neuron loss. Although its genetic and molecular underpinnings have been increasingly studied, the pathways driving PD progression remain unclear. The integrated stress response (ISR), a conserved mechanism activated by cellular stress, has been linked to several neurological diseases, but its role in PD and the key ISR-related genes involved are still poorly understood.
Materials and Methods: We used publicly available transcriptomic data from GEO, including single-cell RNA sequencing and spatial transcriptomics, to identify ISR-related genes involved in PD progression. ISR scores were compared across brain cell types, and differentially expressed genes in microglia were further screened using Lasso regression and random forest algorithms. Enrichment analyses (GSEA and GSVA) revealed their involvement in immune-related pathways. CIBERSORT was applied to assess immune cell infiltration, while spatial transcriptomics mapped the regional expression of key genes. Finally, DDIT4 expression was validated in PD cell and mouse models.
Results: We identified four key ISR-related genes (DDIT4, GNA13, HSPA1B, and SLC7A5) that were differentially expressed in PD microglia. Functional enrichment analysis revealed that these genes were predominantly involved in immune-related signaling pathways, including JAK-STAT, NF-κB, and Notch, suggesting their potential role in regulating neuroinflammation. Spatial transcriptomics revealed distinct regional expression patterns of these ISR-related genes across brain tissues. In vitro and in vivo experiments confirmed the upregulation of DDIT4 in PD models, and its silencing alleviated neurotoxicity and reduced α-synuclein aggregation, highlighting its potential role in PD pathogenesis.
Conclusion: This study provides new insights into the molecular mechanisms of PD and highlights DDIT4 as a promising therapeutic target. Its regulatory role in immune signaling and cellular stress pathways may offer novel avenues for clinical intervention and personalized treatment strategies in PD.
Plain Language Summary: Parkinson’s disease (PD) is a brain disorder that causes movement problems and nerve cell damage. While scientists understand some of its causes, the key pathways driving PD progression are still unclear. The Integrated Stress Response (ISR) helps cells cope with stress and is linked to neurodegenerative diseases, but its role in PD is not well known. In this study, we used advanced transcriptomic techniques, including single-cell RNA sequencing and spatial transcriptomics, to analyze gene expression patterns in PD. These methods allowed us to identify four key ISR-related genes (DDIT4, GNA13, HSPA1B, and SLC7A5) that may affect PD progression, mainly through immune-related pathways. Further experiments in cell and mouse models confirmed that DDIT4 is highly expressed in PD, and reducing its levels helped protect nerve cells. These findings improve our understanding of PD and may help in developing new treatments.
Keywords: Parkinson’s disease, integrated stress response, single-cell transcriptomics, spatial transcriptomics, bioinformatics, DDIT4
Introduction
Parkinson’s Disease (PD) is a progressive neurodegenerative disorder. It is marked by the degeneration of dopaminergic neurons in the substantia nigra. This neuronal loss leads to motor impairments as well as a range of non-motor symptoms. Recent studies estimate that PD affects approximately 1% of individuals over the age of 60. The disease is more prevalent in men than in women.1–3 Pathologically, PD is defined by the presence of Lewy bodies, intracellular inclusions primarily composed of aggregated α-synuclein, which are strongly associated with the progression of the disease.4–6 Established risk factors for PD include genetic mutations in genes such as SNCA and LRRK2, as well as environmental exposures like pesticides and heavy metals.7–10 Despite advances in understanding its etiology, the interplay between genetic susceptibility and environmental triggers in PD remains incompletely understood.11,12 Diagnosing PD can be challenging as early symptoms are often subtle and non-specific, making it difficult to detect before significant neuronal loss has occurred.13 As PD advances, motor symptoms become more pronounced. These include bradykinesia, rigidity, and tremors. In addition to motor issues, patients often experience disabling non-motor symptoms. Common non-motor features include cognitive decline, sleep disturbances, and autonomic dysfunction.14,15 Current treatments for PD mainly aim to manage symptoms. Dopamine replacement therapies, such as levodopa, offer significant relief in the early stages. However, their effectiveness tends to decline as the disease progresses.16,17 Surgical interventions, including deep brain stimulation (DBS), are typically reserved for advanced cases but are associated with considerable risks and limitations.18,19 Current treatment strategies for PD remain inadequate, with no therapies proven to effectively halt or reverse disease progression. The absence of a definitive cure underscores the need for further research into the underlying mechanisms of PD and the development of innovative therapeutic approaches.
The immune microenvironment is increasingly recognized as a critical contributor to neurodegenerative pathogenesis, including PD. Microglia, the brain’s resident immune cells, are activated in response to α-synuclein aggregation and release pro-inflammatory cytokines, contributing to chronic neuroinflammation and neuronal damage.14–16 Astrocytes and infiltrating peripheral immune cells further exacerbate the inflammatory milieu, creating a self-perpetuating cycle of neuroinflammation and neuronal loss.17,18 Immune dysregulation not only drives disease progression but also opens new avenues for therapeutic intervention, as targeting inflammatory pathways may provide neuroprotection and slow disease progression.19
The integrated stress response (ISR) has emerged as a key focus in neurodegenerative disease research,20 a conserved cellular pathway that modulates protein synthesis and stress adaptation. The ISR is activated by various cellular stressors, including oxidative stress and protein aggregation, both of which are hallmarks of PD.21,22 Through phosphorylation of eIF2α and activation of downstream factors such as ATF4, the ISR regulates the expression of genes involved in restoring homeostasis or triggering apoptosis when stress is unresolved.20 Dysregulated ISR has been implicated in several neurodegenerative diseases,23,24 Although dysregulated ISR has been implicated in several neurodegenerative conditions, there is currently a lack of systematic studies identifying and validating ISR-regulatory genes that truly contribute to PD progression. In particular, the signaling pathways through which these ISR-related genes influence the course of PD remain poorly understood. To address this gap, the present study integrates public single-cell and spatial transcriptomic data with machine learning–based screening approaches to identify and validate key ISR-related genes. We aim to elucidate how these genes contribute to PD pathogenesis through specific molecular pathways and to provide a foundation for future ISR-targeted therapeutic strategies.
In recent years, advancements in bioinformatics and high-throughput sequencing technologies have facilitated deeper insights into disease-related molecular mechanisms.25,26 Single-cell transcriptomics enables the exploration of gene expression at the cellular level, revealing cell-type-specific gene profiles and cellular heterogeneity within tissues.6 Coupled with spatial transcriptomics, which retains spatial context information, researchers can now investigate gene expression patterns and cell interactions in situ.27,28 This integrated approach is valuable for studying neurodegenerative diseases, where interactions between neurons, glial cells, and immune cells significantly contribute to disease pathology.29,30
In this study, we performed an integrated analysis of public single-cell and spatial transcriptomic data to identify key ISR-related genes involved in PD. Four genes—DDIT4, GNA13, HSPA1B, and SLC7A5—were highlighted as potential contributors to disease progression. Among them, DDIT4 showed consistent upregulation across analyses and experimental validation. These genes were linked to immune-related signaling pathways, suggesting that ISR may influence PD through immune modulation. Our findings provide a foundation for exploring ISR as a potential therapeutic target in PD.
Materials and Methods
Study Design Overview
A schematic overview of the study design is provided in Figure S1. Briefly, we performed a multi-step integrative analysis involving scRNA-seq, spatial transcriptomics, and experimental validation to identify and characterize ISR-related genes associated with PD. The analytical workflow included differential expression analysis, machine learning-based feature gene selection, functional enrichment, immune cell infiltration assessment, and validation in both cellular and animal models.
Cell Lines
The SH-SY5Y cell line (CL-0208) was purchased from Procell Life Science & Technology Co., Ltd. and cultured in SH-SY5Y-specific growth medium (CM-0208) according to the manufacturer’s instructions. Cells were maintained in a humidified incubator with 95% air and 5% CO2 at 37°C and passaged at a ratio of 1:3 to 1:4 two to three times per week. Mycoplasma contamination was routinely tested monthly to ensure cell line quality and experimental reliability. To establish an in vitro PD model, SH-SY5Y cells were cultured until 70–80% confluence and treated with 200 nmol/L ouabain solution for 24 hours.
siRNA Knockdown
For siRNA transfection, cells were seeded into 12-well plates and grown to approximately 60–70% confluence. The siRNA targeting DDIT4 (#1siRNA, sense: 5′-UUGUUUCAUGCU ACAGUACUG-3′, antisense: GUACUGUAGCAUGAAACAAAG. #2siRNA, sense: 5′-AAAAUAAUAAGGUACAUGCUA-3′, antisense: GCAUGUACCUUAUUAUUUUUG) and a non-targeting scrambled control siRNA (sense: 5′-UUCUCCGAACGUGUCACGUTT-3′ and antisense: 5′-ACGUGACACGUUCGGAGAATT-3’) were used (Genepharma, China). Transfection was performed using Lipofectamine RNAiMAX reagent (Invitrogen, USA) according to the manufacturer’s protocol. Briefly, siRNA and Lipofectamine RNAiMAX were diluted separately in Opti-MEM Reduced Serum Medium (Thermo Fisher Scientific, USA) and incubated for 5 minutes at room temperature. The diluted siRNA and reagent were then mixed and incubated for 20 minutes at room temperature to form transfection complexes. The complexes were added dropwise to the cells, and the plates were gently rocked to ensure even distribution. After 48–72 hours of incubation, transfection efficiency was evaluated by qPCR.
Mice
All animal procedures were conducted in accordance with the National Institutes of Health (NIH) Guide for the Care and Use of Laboratory Animals. The study was conducted according to the guidelines of the Declaration of Helsinki, and approved by the Affiliated Hospital of Qingdao University Animal Care and Use Committee (AHQU-MAL20317436FW). Male C57BL/6J mice (23–25 g) were purchased from the Comparative Medicine Center of Yangzhou University (Yangzhou, China). Mice were housed in a specific pathogen-free (SPF) environment under controlled conditions, including a 12-hour light/dark cycle, a temperature of 20–22°C, and a relative humidity of 45 ± 5%. Food and water were provided ad libitum, and all mice were acclimated to the laboratory environment for one week prior to experimentation.
The PD model was established using intraperitoneal injections of MPTP (Aladdin, M132847). Briefly, mice in the PD group received intraperitoneal injections of MPTP (30 mg/kg, free base) dissolved in 0.9% saline once every 24 hours for seven consecutive days.31,32 The climbing pole test and immunohistochemical analysis were used to confirm successful establishment of the PD mouse model, with significantly altered climbing behavior and increased α-synuclein expression in brain tissues. In the climbing pole test, each mouse was placed head-downward at the top of a vertical iron rod (1 cm diameter, 50 cm height) wrapped in gauze, and the time taken to descend was recorded. Prolonged descent times were considered indicative of motor deficits associated with PD.
Data Acquisition
Single-cell RNA sequencing (scRNA-seq) data (GSE202210) and spatial transcriptome data (GSE232910)33 were obtained from the NCBI GEO database. The scRNA-seq dataset included 12 samples, with six from the disease group and six from the control group, while the spatial transcriptome dataset comprised five samples. Additionally, transcriptome data (GSE68719)34 was downloaded, including data from 73 patients, of which 44 belonged to the control group and 29 to the disease group.
Quality Control
Quality control was conducted using the Seurat package. Cells were filtered based on the total number of UMIs per cell, the number of genes expressed, and the mitochondrial and ribosomal expression ratios. Cells with high mitochondrial and ribosomal gene expression were excluded due to low RNA integrity. DoubletFinder was employed to remove double cells, resulting in a dataset containing 59,621 cells for analysis.
Data Normalization and Cell Annotation
Data were normalized using the LogNormalize method, adjusting total cell expression to 10,000 and applying a logarithmic transformation. Highly variable genes were identified, and principal component analysis (PCA) was applied for linear dimensionality reduction, followed by UMAP for nonlinear dimensionality reduction. Batch effects across the 12 single-cell RNA-seq samples (6 PD and 6 control) were removed using the Harmony integration algorithm implemented in Seurat. Harmony was applied after PCA to align cells across samples while preserving biological heterogeneity. The effectiveness of batch correction was evaluated by visualizing cells in Harmony embedding space, confirming that cells from different samples were well integrated and not clustered by sample origin, and cell clusters were annotated by comparing literature-based markers with data from the CellMarker database.35 SingleR was used for automatic cell-type annotation to determine cell types and their marker genes within each tissue.
Ligand-Receptor Interaction Analysis
Intercellular communication was analyzed using CellChat,36 which utilizes network analysis to infer the signaling inputs and outputs of cells. Standardized single-cell expression data and cell subtype information were used to assess the intensity and frequency of cell-to-cell interactions, providing insight into cellular communication within the disease context.
Feature Selection via Lasso Regression and Random Forest
Key diagnostic markers were selected using Lasso logistic regression and the random forest algorithm. Lasso regression was performed using the glmnet package, while the random forest approach used decision trees based on bootstrapped samples. The top ten important features from the random forest algorithm and the genes identified by Lasso regression were intersected, resulting in four key genes for further study.
Pathway Enrichment Analysis
Pathway enrichment was performed with Gene Set Enrichment Analysis (GSEA), categorizing patients into high and low gene expression groups. The background gene set was sourced from MsigDB, and pathways with pvalue_adj < 0.05 were considered significant. Additionally, Gene Set Variation Analysis (GSVA) was conducted to evaluate pathway-level changes using data from the Molecular Signatures Database.
Immune Infiltration Analysis
The CIBERSORT algorithm was used to assess the immune microenvironment, deconvoluting immune cell types within tissue samples. Using a signature matrix of 547 biomarkers, the relative proportions of 22 immune cell types were quantified, allowing correlation analysis between immune infiltration levels and key gene expression.
Spatial Transcriptome Data Analysis and Deconvolution
UMI count matrices, imaging data, and cell coordinates were processed using the Seurat package,37 with SCTransform used for normalization. PCA and UMAP were applied sequentially for dimensionality reduction and clustering. The spacexr package was used for cell-type deconvolution in spatial transcriptomic data, determining the dominant cell type in each region.
Spatial Cell Interaction Analysis
MISTy was employed to investigate spatial cell interactions, with intracellular and intercellular relationships analyzed to provide a deeper understanding of marker interactions. This tool allowed identification of functionally relevant relationships within distinct spatial environments, including pathway activity and intercellular signaling.
Quantitative PCR
Total RNA was extracted from both cells and the prefrontal cortex of mice using TRIzol reagent (Invitrogen, 15596026), according to the manufacturer’s protocol. The RNA was then reverse-transcribed into cDNA using the High-Capacity cDNA Reverse Transcription Kit (Vazyme, R302). Quantitative PCR (qPCR) was performed with SYBR Green Master Mix (Vazyme, Q111) on an ABI 7500 Real-Time PCR System. The thermal cycling conditions included an initial denaturation at 95°C for 10 minutes, followed by 40 cycles of denaturation at 95°C for 15 seconds and annealing/extension at 60°C for 1 minute. Gene expression levels were normalized to GAPDH as an internal control, and relative expression was calculated using the 2−ΔΔCt method. The primer sequences for qPCR are listed in Supplementary Table 1.
Immunofluorescence (IF)
SH-SY5Y cells were fixed in 4% paraformaldehyde for 10 minutes at room temperature, followed by permeabilization with 0.1% Triton X-100 for 10 minutes. After blocking with 5% BSA for 30 minutes, cells were incubated overnight at 4°C with primary antibody anti-α-SYN (1:500, Abcam, ab138501). After washing, cells were incubated with Alexa Fluor® 488-conjugated goat anti-rabbit IgG (1:200, Abcam, ab150077) for 1 hour at room temperature in the dark. Nuclei were counterstained with DAPI for 5 minutes, and fluorescence was visualized using a fluorescence microscope.
Immunohistochemistry (IHC)
Mouse brain tissues were fixed in formalin, embedded in paraffin, and sectioned at 5 μm. After deparaffinization and rehydration, sections underwent antigen retrieval using EDTA buffer (pH 8.0) in a microwave for 15 minutes, followed by blocking with 3% H2O2 and 5% BSA for 10 and 20 minutes, respectively. Sections were incubated overnight at 4°C with the following primary antibodies: anti-DDIT4 (1:100, Abcam, ab106356) and anti-α-SYN (1:100, Abcam, ab212184). After washing, sections were incubated with HRP-conjugated goat anti-rabbit IgG (1:200, Abcam, ab6721) for 30 minutes. Signal detection was performed using DAB, and sections were counterstained with hematoxylin, dehydrated, cleared in xylene, and mounted. Images were captured using a light microscope.
Statistical Analysis
Differences between two groups were analyzed using Student’s t-test, P value of < 0.05 (two-tailed) was considered statistically significant. Data were expressed as mean ± standard deviation (mean ± SD). Bioinformatics analyses were performed in R (version 4.3.2), with statistical significance set at P < 0.05.
Results
Preliminary Processing of Single-Cell Expression Data
This analysis utilized expression profiles from 12 Parkinson’s disease brain samples. Initially, the data were imported using the Seurat package, and cells were filtered based on criteria including total UMIs, number of genes expressed, and the percentage of mitochondrial reads. A value more than 3 MAD (Median Absolute Deviation) from the median was considered an outlier and removed. DoubletFinder was then applied to eliminate doublets, leaving 59,621 cells for further analysis (Figure S2a and b). The 10 genes with the highest standard deviation were highlighted (Figure S2c).
Single-Cell Data Subpopulation Annotation and AUCell-Based Evaluation of Pathway Activity Across Cell Types
The optimal number of PCs was observed through ElbowPlot: 20 (Figure S2d); PCA dimensionality reduction analysis found that there was a batch effect between samples (Figure S2e), and Harmony analysis was further used to reduce the dimensionality and remove the batch (Figure S2f), and finally 15 subtypes were obtained through UMAP (Figure 1a). This study further annotated each subtype, and 15 clusters were annotated to 8 cell categories, including Astrocytes, Endothelial cells, Microglias, Oligodendrocytes, Oligodendrocyte precursor cells, Excitatory neurons, Inhibitory neurons, and T cells (Figure 1b). Additionally, bubble plots of classic markers for these 8 cell types (Figure 1c) and their grouping proportions (Figure 1d) are presented. We used AUCell to quantify and score genes related to metabolism pathways in single cells, and used the software package pheatmap to group the metabolic pathway matrix according to the activity of cell subtypes to obtain a heat map (Figure 2a). The results showed that Oligodendrocytes, T cells, etc. had low activity in most pathways.
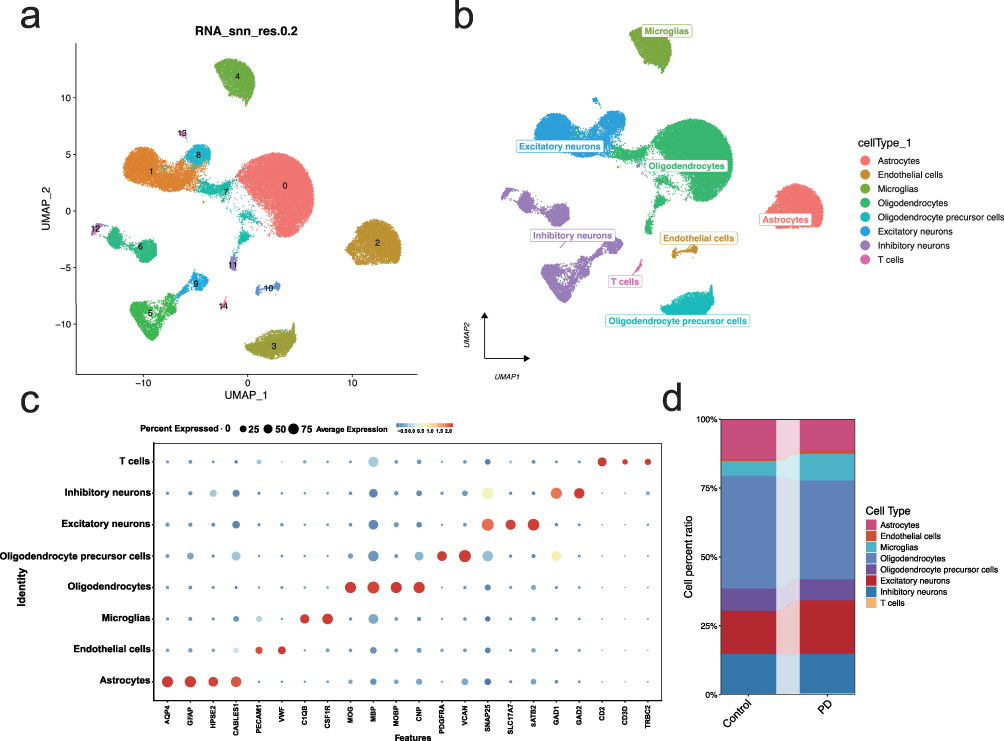 |
Figure 1 Single-cell RNA sequencing reveals cell-type-specific clustering and annotation in PD. (a) UMAP plot showing the clustering of 15 cell subtypes based on single-cell RNA sequencing data. Each cluster is labeled numerically. (b) Annotation of the 15 clusters into 8 major cell types, including astrocytes, endothelial cells, microglia, oligodendrocytes, oligodendrocyte precursor cells, excitatory neurons, inhibitory neurons, and T cells. (c) Bubble plot showing the expression of canonical marker genes used to annotate each cell type, with bubble size representing the percentage of cells expressing the gene and color indicating average expression levels. (d) Proportional distribution of the 8 major cell types in the control and PD groups, highlighting significant changes in cell population dynamics in PD. |
 |
Figure 2 Analysis of Integrated Stress Response profiling across cell types. (a) Heatmap of pathway activity scores (Z-scores) across different cell types, showing significant differences in metabolic and stress-related pathways. (b) UMAP plot and boxplots (c) of ISR scores across cell types in the control and disease groups. Microglia cells show significantly higher ISR scores in the disease group (*p<0.05, ****p < 0.0001, ns = no significance). (d) Volcano plot of DEGs in microglia based on ISR scores, highlighting key upregulated genes (eg, DDIT4, SPP1, and FTH1) and downregulated genes (eg, AC008691.1 and P2RY12). |
Integrated Stress Response Profiling Across Cell Types
After the initial cell subpopulation annotation and metabolic pathway analysis, we shifted our focus to the ISR because of its known role in neurodegenerative diseases, including PD. Previous studies have shown that ISR is activated in response to cellular stress, which plays a key role in neuronal dysfunction and degeneration in PD.20,38,39 Given the potential link between ISR and PD pathology, we hypothesized that analyzing ISR-related genes could help identify critical mechanisms and biomarkers involved in disease progression. Thus, we sought to explore the expression patterns of ISR genes across different cell types in PD and control samples. We obtained 129 integrated stress response-related genes from the literature,40 and used AUCell to quantify the expression of these genes in single cells. Our analysis revealed that the integrated stress response score of microglia was significantly higher in PD samples compared to controls, making it not only the most significantly different but also the most markedly changed cell subtype, which was selected for further analysis (Figure 2b and c). We then classified microglia into high and low ISR score groups for differential expression gene analysis, applying the following screening criteria: pvalue_adj < 0.05 and |avg_log2FC| > 0.25 (Figure 2d). As a result, a total of 93 DEGs were identified.
To investigate the cell-cell interactions in PD, we used the CellChat package to analyze the ligand-receptor relationships between these two microglia groups. The results highlighted complex interaction patterns between the subtypes (Figure 3a), with the ligands for High_Microglias and Low_Microglias shown in Figure 3b. These findings suggest that differential ligand-receptor interactions may underlie the functional heterogeneity of microglia subtypes, contributing to their distinct roles in the progression of Parkinson’s Disease.
 |
Figure 3 Cell-cell communication analysis of microglia and other cell types. (a) Network diagram illustrating the cellular interactions among eight different cell types, with edge thickness representing the probability and strength of communication between cells. (b) Bubble chart showing receptor-ligand interactions between cell types. The size and color intensity of the bubbles correspond to the communication probability and statistical significance of the interactions, respectively. |
Identification of Key PD Genes Through Lasso Regression and Random Forest
To identify key genes associated with PD among the candidate genes, we performed gene screening using both Lasso regression and random forest methods. Lasso regression identified 25 genes as characteristic of PD (Figure 4a and b), while random forest analysis highlighted the top 10 genes (Figure 4c). By taking the intersection of the genes identified by both methods, we obtained 4 common genes (Figure 4d). These 4 genes—DDIT4, GNA13, HSPA1B, and SLC7A5—were selected as key targets for further investigation. Additionally, we retrieved PD-related genes with the highest relevance scores (Top 3) from the GeneCards database (https://www.genecards.org/). Correlation analysis was then performed to construct co-expression networks between the selected key genes and the PD-related genes (Figure S3–S6). We can clearly observe a strong correlation between the screened key genes and the PD-related genes. These findings highlight the robust association of the identified key genes with PD.
 |
Figure 4 Identification of key genes in PD through feature selection. (a) Lasso regression results showing the fraction of deviance explained by selected genes, with 25 candidate genes identified as potential markers. (b) Cross-validation plot for Lasso regression, showing the misclassification error rates for different values of lambda (log(λ)), with optimal lambda minimizing the error. (c) Relative importance of the top 10 genes selected by the random forest algorithm, highlighting DDIT4, GNA13, HSPA1B, and SLC7A5 as highly ranked genes. (d) Venn diagram illustrating the intersection of genes identified by Lasso regression and random forest, resulting in four key genes (DDIT4, GNA13, HSPA1B, and SLC7A5) for further investigation. |
Signaling Pathways Involved in Key PD-Related Genes and Their Role in Disease Progression
To investigate the specific signaling pathways associated with the key genes, we explored the potential molecular mechanisms by which these genes may influence PD progression. GSEA analysis revealed that DDIT4 was enriched in pathways such as the IL-17, JAK-STAT and Notch signaling pathways (Figure 5a). GNA13 was found to be enriched in the JAK-STAT, NF-κB and Notch signaling pathways (Figure 5b). HSPA1B was predominantly enriched in the IL-17 pathways, JAK-STAT and NF-κB (Figure S7a), while SLC7A5 was enriched in the JAK-STAT, NF-κB and Notch signaling pathways (Figure S7b). Further GSVA analysis revealed that DDIT4 was associated with the IL6_JAK_STAT3 signaling and P53 pathways (Figure 6a). GNA13 was enriched in the TGF-β signaling and INTERFERON_GAMMA_RESPONSE pathways (Figure 6b). HSPA1B was linked to the INFLAMMATORY_RESPONSE and WNT_BETA_CATENIN signaling pathways (Figure 6c), while SLC7A5 was enriched in the IL6_JAK_STAT3 signaling and INTERFERON_GAMMA_RESPONSE pathways (Figure 6d). These results suggest that the key genes may influence PD progression through these signaling pathways, highlighting their significant impact on immune processes. For example, the JAK-STAT pathway has been widely reported to mediate neuroinflammatory responses and glial cell activation in PD, contributing to progressive dopaminergic neuron loss.41 The NF-κB signaling pathway is known to regulate pro-inflammatory cytokine production, such as TNF-α and IL-1β, which are elevated in the PD brain and associated with microglial activation.42 Additionally, the IL-17 signaling pathway, primarily driven by Th17 cells, has been implicated in peripheral immune dysregulation and neuroinflammation in PD patients.43 These findings support the hypothesis that ISR-related genes may contribute to PD pathology by modulating these immune-related pathways.
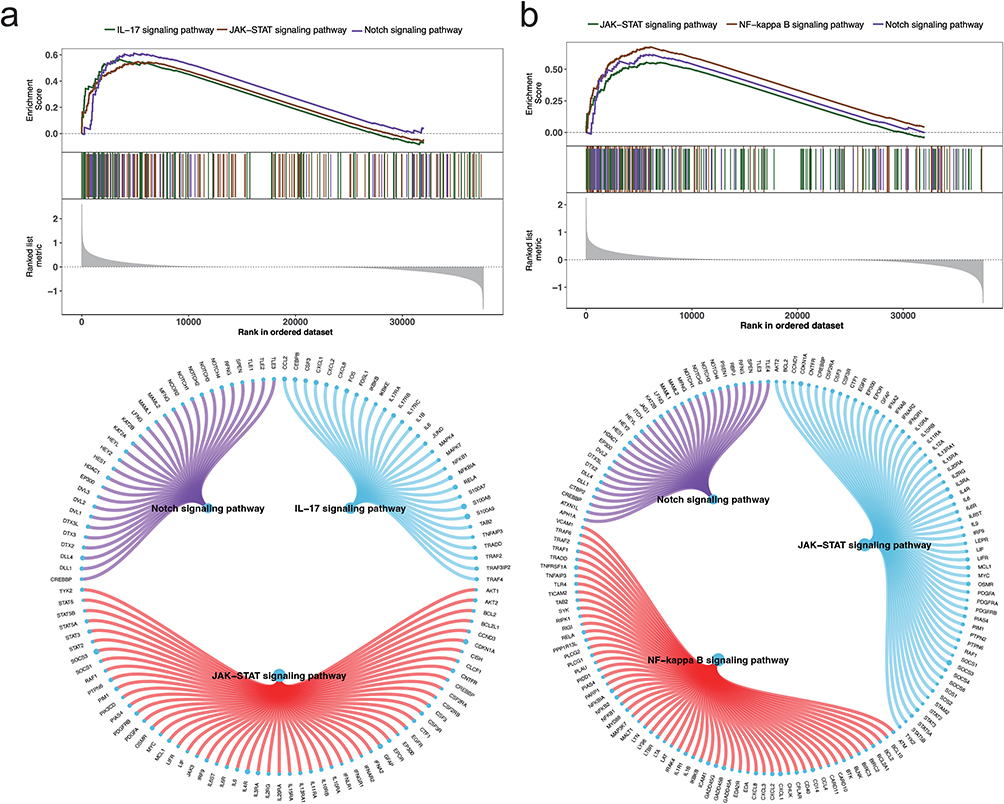 |
Figure 5 GSEA Pathway enrichment analysis for high and low expression groups of key genes. (a) GSEA results for DDIT4, showing enrichment in the JAK-STAT signaling pathway, NF-kappa B signaling pathway, and Notch signaling pathway. The circular plot highlights the connections of DDIT4 with genes involved in these pathways. (b) GSEA results for GNA13, demonstrating significant enrichment in the same pathways as DDIT4, with corresponding gene interactions shown in the circular plot. |
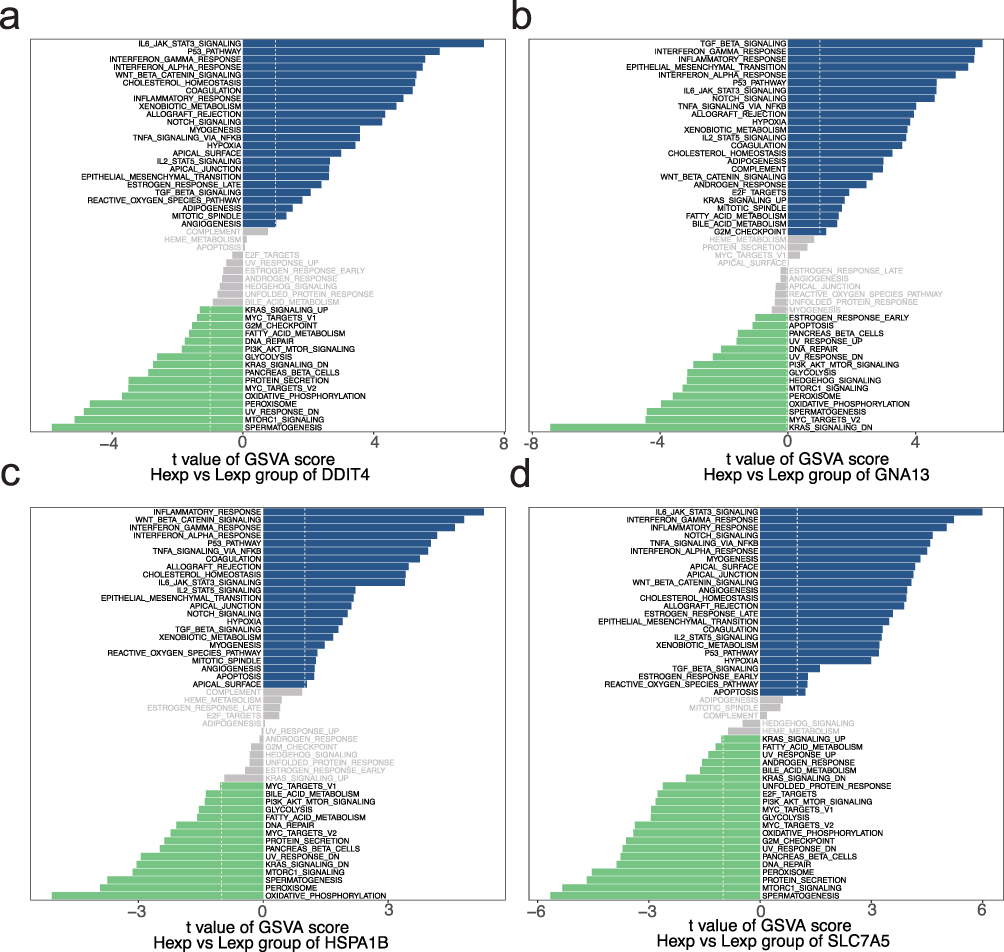 |
Figure 6 GSVA pathway enrichment analysis for high and low expression groups of key genes. (a) GSVA results for DDIT4, showing significant pathway activity differences between high-expression (Hexp) and low-expression (Lexp) groups. (b) GSVA results for GNA13, highlighting enriched pathways. (c) GSVA results for HSPA1B, highlighting enriched pathways. (d) GSVA results for SLC7A5, highlighting enriched pathways. |
Immune Infiltration and Correlation with Key PD-Related Genes
Based on the identified key genes involved in immune regulation, we further investigated the immune microenvironment in PD. The microenvironment consists primarily of fibroblasts, immune cells, extracellular matrix, various growth factors, inflammatory mediators, and distinct physical and chemical properties. It plays a crucial role in influencing disease diagnosis, survival prognosis, and responsiveness to clinical treatments.44–46 Initially, we examined and visualized the distribution of immune infiltration levels and the correlations between immune cell populations in PD (Figure 7a and b). Compared to the control group, the PD group exhibited significantly higher levels of M2 macrophages and monocytes, while the level of CD8+ T cells was significantly lower (Figure 7c). Further analysis of the relationships between key genes and immune cells revealed that DDIT4 was significantly positively correlated with resting NK cells and neutrophils, while it was significantly negatively correlated with CD8+ T cells and M0 macrophages (Figure 7d). GNA13 showed a significant positive correlation with resting NK cells and neutrophils, and a significant negative correlation with CD8+ T cells and activated NK cells (Figure 7e). HSPA1B was significantly positively correlated with resting NK cells and neutrophils, and significantly negatively correlated with CD8+ T cells (Figure 7f). SLC7A5 was significantly positively correlated with M2 macrophages and resting NK cells, but significantly negatively correlated with M0 macrophages (Figure 7g). These findings highlight the complex interactions between key genes and immune cell subsets in the PD microenvironment, suggesting that immune cell distribution and their correlations with specific genes play a crucial role in the progression and immune modulation of PD.
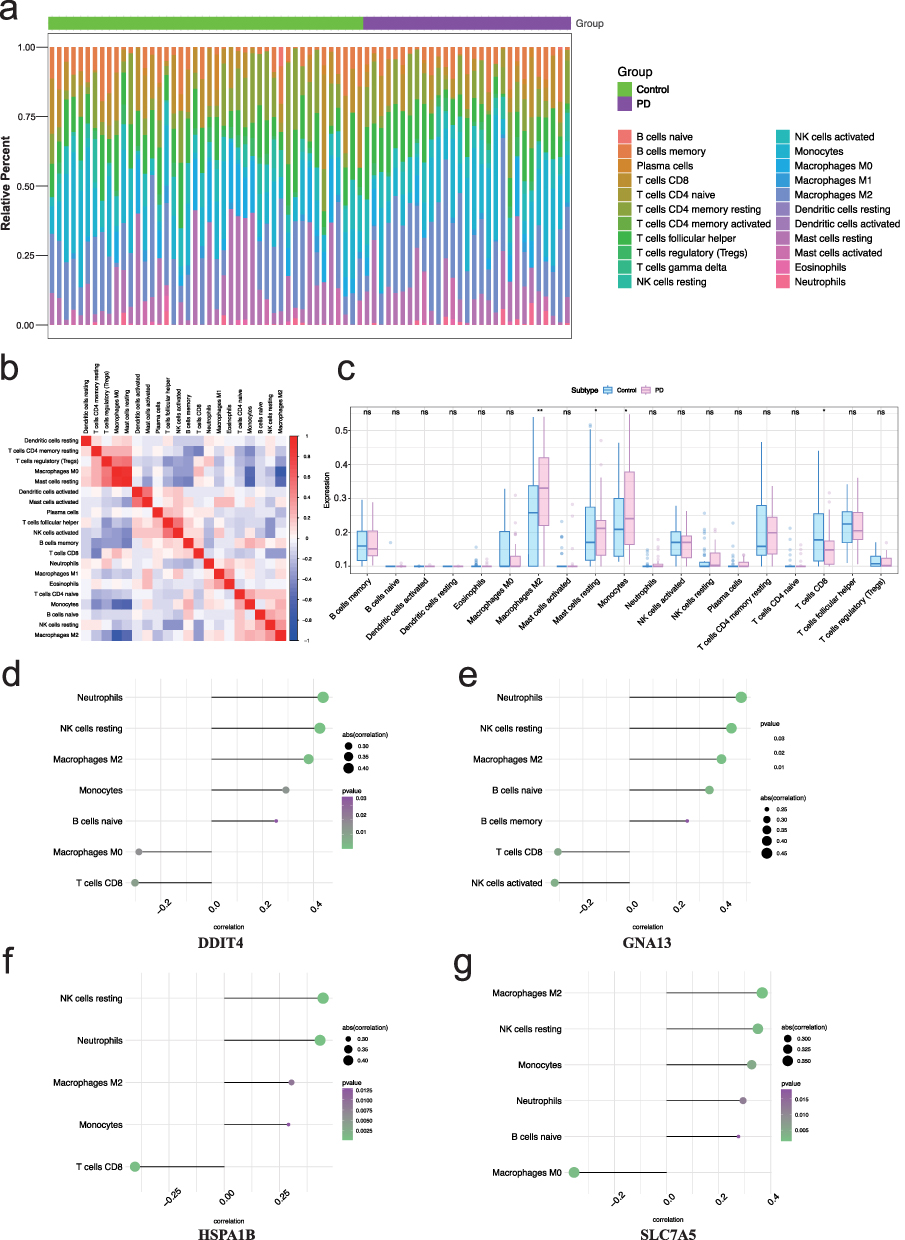 |
Figure 7 Immune cell infiltration analysis in PD and correlation with key genes. (a) Relative proportions of immune cell subtypes in control and PD groups. (b) Heatmap illustrating the correlations between different immune cell types. Red indicates positive correlations, while blue represents negative correlations. (c) Boxplots comparing immune cell subtype proportions between control and PD groups, highlighting significant differences in macrophages M2 (*p < 0.05, **p < 0.01, ns = no significance). (d) Correlation analysis between immune cell subtypes and DDIT4 expression, showing significant associations with macrophages M2 and NK resting cells. (e) Correlation analysis between immune cell subtypes and GNA13 expression, with notable correlations observed for T cells CD8 and NK resting cells. (f) Associations of immune cell subtypes with HSPA1B expression, revealing significant correlations with monocytes and neutrophils. (g) Correlation analysis for SLC7A5 expression, indicating strong associations with macrophages M2 and neutrophils. |
Spatial Transcriptome Analysis and Deconvolution of Cell Types in PD
Spatial transcriptomics is an emerging technique that enables the analysis of gene expression within the spatial context of tissues, providing valuable insights into how cellular architecture and local microenvironments influence biological processes. This analysis utilized spatial transcriptome samples from five post-mortem brain of PD patients. First, the distribution of UMI counts across the five samples was examined (Figure S8), with higher UMI counts typically indicating epithelial regions. The data were then standardized and normalized, followed by PCA for linear dimensionality reduction, UMAP for nonlinear dimensionality reduction, and Louvain clustering. As a result, 12 subgroups were identified across the five samples (Figure 8a). To further investigate the cell composition of each spot, we performed deconvolution analysis on the spatial transcriptome data using the spacexr package, which combined single-cell data to determine the dominant cell type in each spot (Figure 8b). To validate the accuracy of this deconvolution, we applied the FindAllMarkers function to identify marker genes for each cell category (Figure 8c).
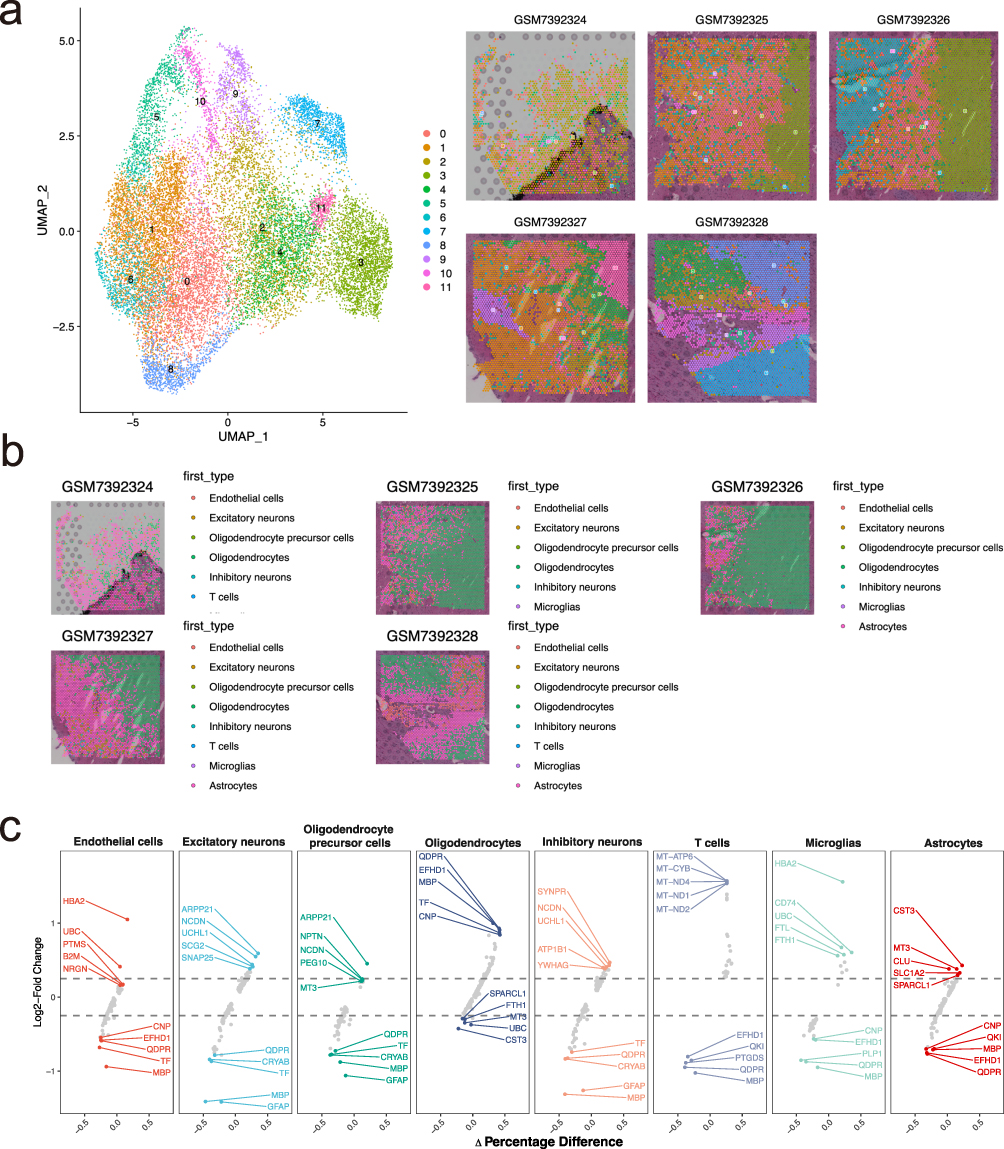 |
Figure 8 Spatial transcriptomics analysis reveals cell-type-specific expression patterns. (a) UMAP plot of spatial transcriptomic data, illustrating clustering of 12 cell subtypes across the tissue sections, with spatial feature plots demonstrating the localization of these clusters within the tissues. (b) Spatial mapping of various cell types across tissue sections, identifying different cell populations in sample regions. (c) Differential gene expression analysis for each cell type, showing log2 fold change and percentage differences between the control and disease groups, highlighting key upregulated and downregulated genes. |
Spatial ISR Scoring and Cellular Interaction Analysis in PD
We applied the AUCell scoring method to quantify the ISR gene set in the spatial transcriptome data to further investigate the impact of the ISR on PD, the distribution of ISR scores across different regions can be clearly observed (Figure 9a). MISTy was then used to analyze both intracellular and intercellular interactions, providing deeper insights into marker interactions. By performing cell interaction analysis on the annotated cell identities after deconvolution, we generated intracellular interaction heatmaps and network diagrams (Figure 9b and c). The results revealed that astrocytes, excitatory neurons, and oligodendrocytes exhibited high levels of cell interaction. These findings suggest that these cell types play central roles in the cellular communication network, potentially contributing to the regulation of microenvironmental dynamics in PD. Further investigation into these interactions may uncover novel targets for modulating disease progression.
 |
Figure 9 Spatial cell interaction analysis reveals intercellular communication patterns. (a) Spatial mapping of ISR scores across PD transcriptomic data spots in different sample regions. (b) Heatmap of predictive correlations between cell types. The predictive importance between various cell types is indicated by color intensity, with darker shades denoting higher importance. Each cell represents the relationship where one cell type is a predictor and another as the target. (c) Network diagram of intercellular interactions. Nodes represent different cell types and edges indicate the importance of predictive correlations. Distinct colored areas around groups of cell types highlight major interaction networks. |
Spatial Distribution of Key Genes and Their Activities in Immune and Metabolic Pathways in PD
The spatial transcriptome data was analyzed to examine the expression patterns of key genes, revealing the spatial distribution of DDIT4, GNA13, HSPA1B, and SLC7A5 across the five samples (Figure 10a–d). Building on the previous findings, which highlighted the crucial roles of these four key genes in immune regulation, we further examined their activity in immune and metabolism-related pathways. We used AUCell to quantify pathway scores in single cells. Bubble charts were then used to illustrate the differences in pathway activity for key genes. The results revealed that HSPA1B exhibited higher activity in pathways such as the reactive oxygen species pathway, DDIT4 showed increased activity in the notch signaling pathway, GNA13 was highly active in notch signaling, and SLC7A5 had elevated activity in the hedgehog signaling pathway (Figure 10e). These findings underscore the diverse functional roles of the key genes in modulating immune and metabolic pathways, further emphasizing their potential involvement in the pathogenesis of PD.
 |
Figure 10 Spatial expression patterns and pathway associations of key genes. (a–d) Spatial feature plots showing the expression levels of DDIT4 (a), GNA13 (b), HSPA1B (c), and SLC7A5 (d) across tissue sections (GSM7392324–GSM7392328). Higher expression levels are observed in specific tissue regions, highlighting their spatial localization in PD. (e) Bubble plot depicting pathway enrichment analysis for the four key genes, with bubbles representing log2FC and FDR values. Pathways are categorized into immune, metabolism, signaling, and proliferation-related classifications, emphasizing the diverse functional roles of these genes in PD. |
Validation of Key Gene Expression in Cellular and Mouse Models of PD
To validate the roles of the key genes identified in our bioinformatics analysis, we established PD models using the SH-SY5Y cell line and a mouse model. First, we successfully constructed the cellular model of PD. In the control group, cells exhibited dense growth with long, slender neurites. In contrast, the PD model group displayed significant morphological changes, including shortened neurites and an increased number of swollen, rounded cells (Figure 11a). Quantitative PCR analysis revealed that mRNA levels of DDIT4, GNA13, and HSPA1B were significantly elevated in the PD model, with DDIT4 showing the most pronounced increase, consistent with our bioinformatics findings (Figure 11b). Given the upregulation of DDIT4 in PD, its precise role—whether protective or detrimental—remains unclear, especially considering that its downregulation has been shown to benefit Alzheimer’s disease. To address this, we knocked down DDIT4 in a PD cellular model (Figure 11c), which notably resulted in significant improvements in cell morphology (Figure 11d). Furthermore, the DDIT4 knockdown was associated with a significant reduction in the PD marker α-SYN (Figure 11e), indicating that DDIT4 may contribute to PD pathology, and its downregulation could have therapeutic potential. We further validated these findings in our mouse model of PD, observing similar upregulation of DDIT4 at the mRNA level (Figure 11f). The climbing pole test confirmed successful PD model establishment in the mice, as evidenced by altered climbing behavior (Figure 11g). Immunohistochemistry also demonstrated significantly increased expression of DDIT4 in the PD mouse model (Figure 11h). These results corroborate our bioinformatics analysis, underscoring the accuracy of our computational predictions. They also highlight the pivotal role of DDIT4 in PD progression, indicating its potential as a therapeutic target.
 |
Figure 11 Validation of key gene expression and functional roles of DDIT4 in cellular and mouse PD model. (a) Representative images of cell morphology in the control (CTRL) and PD SH-SY5Y cell models. PD cells exhibit shortened neurites and swollen, rounded cell bodies (scale bar: 100µm). (b) Relative mRNA expression levels of DDIT4, GNA13, HSPA1B, and SLC7A5 in the control and PD cell models. DDIT4 shows the most significant upregulation (*p<0.05, **p<0.01, ****p < 0.0001, ns = no significance). All data points are mean ± standard error (n = 6). (c) Relative mRNA expression levels of DDIT4 after two siRNA treatment (**p<0.01, ns = no significance). All data points are mean ± standard error (n = 3). (d) Representative images of cell morphology after DDIT4 knockdown in the PD cell model, showing morphological improvement with elongated neurites (scale bar: 100µm). (e) Immunofluorescence images demonstrating α-SYN expression in control, PD, and PD(#1siRNA) cell models. DDIT4 knockdown reduces α-SYN levels in PD cells (scale bar: 100µm). (f) Relative mRNA expression of Ddit4, Gna13, Hspa1b, and Slc7a5 in control and PD mouse models. Ddit4 is significantly upregulated in PD mice (*p<0.05, ****p < 0.0001, ns = no significance). All data points are mean ± standard error (n = 5). (g) Pole climbing test results showing prolonged climbing time in PD mice compared to controls (****p < 0.0001), All data points are mean ± standard error (n = 5). (h) Immunohistochemistry images of α-SYN and Ddit4 expression in control and PD mouse brain tissues, demonstrating significant upregulation of Ddit4 in PD (scale bar: 100µm). |
Discussion
PD is a common neurodegenerative disorder with increasing prevalence among individuals over 60, especially men, due to population aging.2,47 Characterized by progressive motor dysfunction, PD significantly reduces quality of life and presents substantial management challenges.48 Current treatments, including pharmacological and surgical approaches, are limited to symptom relief and require continuous adjustment to address the disease’s progression and impact on mental health. Identifying key genes involved in PD is essential for advancing beyond symptomatic care and developing targeted therapies that could modify disease progression.
The ISR process is a conserved cellular mechanism that modulates protein synthesis and promotes stress adaptation. It plays a pivotal role in various diseases, yet its involvement in PD has not been thoroughly explored. Given the significant role of ISR in immune regulation and cellular homeostasis, investigating its contribution to PD may provide insights into disease mechanisms and reveal novel therapeutic targets. By leveraging publicly available single-cell RNA-sequencing data, we systematically analyzed the ISR gene set across various brain cell subtypes. Our analysis revealed significant differences in ISR scores within microglia between PD and control groups. Further differential expression analysis of microglia identified 93 DEGs, of which four key ISR-related genes—DDIT4, GNA13, HSPA1B, and SLC7A5—were identified using Lasso regression and random forest algorithms. Correlation analysis confirmed strong associations between these genes and PD-related genes, highlighting their crucial role in PD pathogenesis.
Functional enrichment analysis demonstrated that the identified ISR-related genes significantly impact immune regulatory pathways involved in PD progression, including JAK-STAT, NF-κB, and Notch signaling. Immune infiltration analysis further revealed strong correlations between these genes and specific immune cell populations—most notably, positive associations with resting NK cells and neutrophils and negative associations with CD8+ T cells and M0 macrophages. These observations suggest that ISR-related genes may play dual roles in modulating both intracellular stress adaptation and extracellular immune interactions. Given that many of these genes were differentially expressed in microglia, a key immune cell type in the central nervous system (CNS), their altered expression may influence the activation status and inflammatory phenotype of glial cells. Additionally, the enrichment of these genes in IL-17 and interferon-γ response pathways further underscores their involvement in establishing a sustained pro-inflammatory environment. Together, these findings highlight the possibility that ISR activation may exacerbate neuroinflammation by reprogramming the immune microenvironment, thereby accelerating dopaminergic neurodegeneration. This integrated interpretation provides a functional link between stress signaling, immune regulation, and PD progression.
Spatial transcriptomics provided deeper insights into the spatial expression patterns of the identified key genes, enabling us to map ISR distribution across brain regions affected by PD. This analysis also shed light on intercellular interactions in the PD microenvironment, revealing complex communication networks between astrocytes, oligodendrocytes, and excitatory neurons, which likely contribute to disease progression.
In addition to bioinformatic analyses, experimental validation in PD cell and mouse models confirmed the differential expression of DDIT4 at the mRNA level, highlighting its potential relevance as a therapeutic target. DDIT4, also known as REDD1, is a stress-response gene primarily involved in the regulation of cellular metabolism and homeostasis under conditions of hypoxia, oxidative stress, and inflammation.49–51 Previous studies have shown that DDIT4 plays a critical role in modulating the mTOR signaling pathway, which is essential for maintaining cellular energy balance and reducing cellular stress.50,52 Dysregulation of mTOR signaling has been implicated in neurodegenerative diseases, including Parkinson’s disease, due to its involvement in autophagy, apoptosis, and synaptic plasticity.53,54 Moreover, DDIT4 has been linked to cellular responses to neuroinflammatory signals, which are key drivers of AD pathology.54 Importantly, knockdown of DDIT4 in the PD cell model significantly improved cell morphology and reduced α-synuclein levels, a hallmark of PD pathology. These findings suggest that DDIT4 acts as a contributor to PD pathology, and its downregulation could mitigate disease progression by alleviating cellular stress responses. Mechanistically, DDIT4 is known to inhibit mTORC1 signaling by promoting TSC1/2 complex activity, leading to suppressed protein synthesis and enhanced autophagy.51 In the context of PD, this regulation may initially serve a protective role, but chronic overactivation could impair cellular homeostasis, contribute to synaptic dysfunction, and exacerbate neurodegeneration. Moreover, DDIT4 is transcriptionally activated by ATF4 under ISR conditions and is also responsive to pro-inflammatory cytokines such as TNF-α and IL-6, linking it to both stress and immune signaling cascades.55,56 Our findings that DDIT4 knockdown alleviates neuronal damage suggest that its overexpression may perpetuate a detrimental feedback loop involving mTOR suppression, impaired autophagy, and immune activation in PD. Further studies are warranted to explore the detailed molecular mechanisms underlying DDIT4’s effects and its interactions with other pathways involved in PD. Additionally, investigating environmental factors that influence DDIT4 expression could provide a more comprehensive understanding of its role in PD pathogenesis and therapeutic potential.
These findings not only deepen our understanding of the molecular mechanisms underlying PD but also offer potential clinical implications. For example, ISR-related genes such as DDIT4 may serve as candidate biomarkers for neuroinflammation-associated PD subtypes or as therapeutic targets to mitigate cellular stress and immune dysregulation. Furthermore, the application of single-cell and spatial transcriptomic data in our study highlights the value of transcriptomic profiling in identifying cell type-specific gene expression patterns, which could support patient stratification and the development of personalized treatment strategies in the future.
Limitation
One limitation of our study is the use of an acute MPTP-induced PD model, which may not fully represent the progressive nature of PD. Moreover, the in vitro experiments were conducted using SH-SY5Y neuronal cells rather than microglia, where the key ISR-related genes were initially identified. While this model allowed us to evaluate the impact of ISR-related genes on neuronal stress responses, future studies using microglia-specific systems and chronic or transgenic PD models will be essential to validate their cell-type–specific and long-term effects. Additionally, our findings have not yet been verified in human PD tissue samples. Although we observed consistent trends across public datasets and experimental models, validation in clinical specimens is needed to confirm the translational relevance of these ISR-related genes, particularly DDIT4.
Conclusion
Collectively, our study identified four key ISR-related genes (DDIT4, GNA13, HSPA1B, and SLC7A5) using multiple screening methods based on single-cell transcriptomic data. These genes were closely associated with immune regulation and cellular stress responses, suggesting their involvement in PD pathogenesis. Spatial transcriptomics provided further insights into their regional expression and potential intercellular interactions. Among them, DDIT4 exhibited robust and consistent upregulation, and its knockdown alleviated PD-related cellular stress, supporting its potential role in disease progression. This study is the first to systematically investigate ISR-related genes in PD, offering novel perspectives on disease mechanisms. Importantly, ISR-related genes—particularly DDIT4—may serve as biomarkers for immune-related PD subtypes or as therapeutic targets for modulating neuroinflammation and cellular stress, providing a foundation for future precision medicine strategies in neurodegenerative diseases.
Data Sharing Statement
The datasets used and analyzed during the current study available from the corresponding author (Shengyu Feng) on request.
Ethics Approval and Informed Consent
The study was conducted according to the guidelines of the Declaration of Helsinki. The animal experiments were approved by the Animal Care and Use Committee of the Affiliated Hospital of Qingdao University (Approval No. AHQU-MAL20317436FW). For the human data used in this study, all transcriptomic datasets were obtained from the publicly accessible GEO database and contain only de-identified information. According to Item 1 of Article 32 of the Measures for Ethical Review of Life Science and Medical Research Involving Human Subjects (issued by the Ministry of Science and Technology of the People’s Republic of China, effective February 18, 2023), studies using legally and publicly available human data without involving personally identifiable information are exempt from ethical review. Therefore, separate approval from our institutional ethics committee was not required.
Consent for Publication
We confirm that all images, recordings, and other content included in this article have obtained the consent of the individuals involved for publication.
Acknowledgments
We sincerely thank the Intramural Research Program of the Affiliated Hospital of Qingdao University for their financial support, and the GEO database for providing publicly available sequencing data.
Author Contributions
All authors made a significant contribution to the work reported, whether in the conception, study design, execution, acquisition of data, analysis and interpretation, or in all these areas. All authors took part in drafting, revising, or critically reviewing the article; gave final approval of the version to be published; have agreed on the journal to which the article has been submitted; and agree to be accountable for all aspects of the work.
Funding
This project was financially supported by The Intramural Research Program of the Affiliated Hospital of Qingdao University (grant number 4901).
Disclosure
The authors declare that they have no competing interests.
References
1. Balestrino R, Schapira AHV. Parkinson disease. Eur J Neurol. 2020;27(1):27–42. doi:10.1111/ene.14108
2. Bloem BR, Okun MS, Klein C. Parkinson’s disease. Lancet. 2021;397(10291):2284–2303. doi:10.1016/s0140-6736(21)00218-x
3. Tolosa E, Garrido A, Scholz SW, Poewe W. Challenges in the diagnosis of Parkinson’s disease. Lancet Neurol. 2021;20(5):385–397. doi:10.1016/s1474-4422(21)00030-2
4. Breydo L, Wu JW, Uversky VN. Α-synuclein misfolding and Parkinson’s disease. Biochim Biophys Acta. 2012;1822(2):261–285. doi:10.1016/j.bbadis.2011.10.002
5. Emin D, Zhang YP, Lobanova E, et al. Small soluble α-synuclein aggregates are the toxic species in Parkinson’s disease. Nat Commun. 2022;13(1):5512. doi:10.1038/s41467-022-33252-6
6. Aldridge S, Teichmann SA. Single cell transcriptomics comes of age. Nat Commun. 2020;11(1):4307. doi:10.1038/s41467-020-18158-5
7. Xu W, Tan L, Yu JT. Link between the SNCA gene and parkinsonism. Neurobiol Aging. 2015;36(3):1505–1518. doi:10.1016/j.neurobiolaging.2014.10.042
8. Chen V, Moncalvo M, Tringali D, et al. The mechanistic role of alpha-synuclein in the nucleus: impaired nuclear function caused by familial Parkinson’s disease SNCA mutations. Hum Mol Genet. 2020;29(18):3107–3121. doi:10.1093/hmg/ddaa183
9. Tolosa E, Vila M, Klein C, Rascol O. LRRK2 in Parkinson disease: challenges of clinical trials. Nat Rev Neurol. 2020;16(2):97–107. doi:10.1038/s41582-019-0301-2
10. Deniston CK, Salogiannis J, Mathea S, et al. Structure of LRRK2 in Parkinson’s disease and model for microtubule interaction. Nature. 2020;588(7837):344–349. doi:10.1038/s41586-020-2673-2
11. Haaxma CA, Bloem BR, Borm GF, et al. Gender differences in Parkinson’s disease. J Neurol Neurosurg Psychiatry. 2007;78(8):819–824. doi:10.1136/jnnp.2006.103788
12. Vaidya B, Dhamija K, Guru P, Sharma SS. Parkinson’s disease in women: mechanisms underlying sex differences. Eur J Pharmacol. 2021;895:173862. doi:10.1016/j.ejphar.2021.173862
13. Weintraub D, Aarsland D, Chaudhuri KR, et al. The neuropsychiatry of Parkinson’s disease: advances and challenges. Lancet Neurol. 2022;21(1):89–102. doi:10.1016/s1474-4422(21)00330-6
14. Ho MS. Microglia in Parkinson’s Disease. Adv Exp Med Biol. 2019;1175:335–353. doi:10.1007/978-981-13-9913-8_13
15. Stefanova N. Microglia in Parkinson’s Disease. J Parkinsons Dis. 2022;12(s1):S105–s112. doi:10.3233/jpd-223237
16. Isik S, Yeman Kiyak B, Akbayir R, Seyhali R, Arpaci T. Microglia mediated neuroinflammation in Parkinson’s Disease. Cells. 2023;12(7):1012. doi:10.3390/cells12071012
17. Booth HDE, Hirst WD, Wade-Martins R. The role of astrocyte dysfunction in Parkinson’s disease pathogenesis. Trends Neurosci. 2017;40(6):358–370. doi:10.1016/j.tins.2017.04.001
18. Chen K, Wang H, Ilyas I, Mahmood A, Hou L. Microglia and astrocytes dysfunction and key neuroinflammation-based biomarkers in Parkinson’s disease. Brain Sci. 2023;13(4):634. doi:10.3390/brainsci13040634
19. Adamu A, Li S, Gao F, Xue G. The role of neuroinflammation in neurodegenerative diseases: current understanding and future therapeutic targets. Front Aging Neurosci. 2024;16:1347987. doi:10.3389/fnagi.2024.1347987
20. Costa-Mattioli M, Walter P. The integrated stress response: from mechanism to disease. Science. 2020;368(6489). doi:10.1126/science.aat5314
21. Espay AJ, Vizcarra JA, Marsili L, et al. Revisiting protein aggregation as pathogenic in sporadic Parkinson and Alzheimer diseases. Neurology. 2019;92(7):329–337. doi:10.1212/wnl.0000000000006926
22. Irvine GB, El-Agnaf OM, Shankar GM, Walsh DM. Protein aggregation in the brain: the molecular basis for Alzheimer’s and Parkinson’s diseases. Mol Med. 2008;14(7–8):451–464. doi:10.2119/2007-00100.Irvine
23. Bond S, Lopez-Lloreda C, Gannon PJ, Akay-Espinoza C, Jordan-Sciutto KL. The integrated stress response and phosphorylated eukaryotic initiation factor 2α in neurodegeneration. J Neuropathol Exp Neurol. 2020;79(2):123–143. doi:10.1093/jnen/nlz129
24. Korneeva NL. Integrated stress response in neuronal pathology and in health. Biochemistry. 2022;87(Suppl 1):S111–s127. doi:10.1134/s0006297922140103
25. Hofmann-Apitius M, Ball G, Gebel S, et al. Bioinformatics mining and modeling methods for the identification of disease mechanisms in neurodegenerative disorders. Int J Mol Sci. 2015;16(12):29179–29206. doi:10.3390/ijms161226148
26. Sanches PHG, de Melo NC, Porcari AM, de Carvalho LM. Integrating molecular perspectives: strategies for comprehensive multi-omics integrative data analysis and machine learning applications in transcriptomics, proteomics, and metabolomics. Biology. 2024;13(11):848. doi:10.3390/biology13110848
27. Moses L, Pachter L. Museum of spatial transcriptomics. Nat Methods. 2022;19(5):534–546. doi:10.1038/s41592-022-01409-2
28. Tian L, Chen F, Macosko EZ. The expanding vistas of spatial transcriptomics. Nat Biotechnol. 2023;41(6):773–782. doi:10.1038/s41587-022-01448-2
29. Piwecka M, Rajewsky N, Rybak-Wolf A. Single-cell and spatial transcriptomics: deciphering brain complexity in health and disease. Nat Rev Neurol. 2023;19(6):346–362. doi:10.1038/s41582-023-00809-y
30. Chen WT, Lu A, Craessaerts K, et al. Spatial transcriptomics and in situ sequencing to study Alzheimer’s disease. Cell. 2020;182(4):976–991.e19. doi:10.1016/j.cell.2020.06.038
31. Jackson-Lewis V, Przedborski S. Protocol for the MPTP mouse model of Parkinson’s disease. Nat Protoc. 2007;2(1):141–151. doi:10.1038/nprot.2006.342
32. Meredith GE, Sonsalla PK, Chesselet MF. Animal models of Parkinson’s disease progression. Acta Neuropathol. 2008;115(4):385–398. doi:10.1007/s00401-008-0350-x
33. Vicari M, Mirzazadeh R, Nilsson A, et al. Spatial multimodal analysis of transcriptomes and metabolomes in tissues. Nat Biotechnol. 2024;42(7):1046–1050. doi:10.1038/s41587-023-01937-y
34. Dumitriu A, Golji J, Labadorf AT, et al. Integrative analyses of proteomics and RNA transcriptomics implicate mitochondrial processes, protein folding pathways and GWAS loci in Parkinson disease. BMC Med Genomics. 2016;9:5. doi:10.1186/s12920-016-0164-y
35. Zhang X, Lan Y, Xu J, et al. CellMarker: a manually curated resource of cell markers in human and mouse. Nucleic Acids Res. 2019;47(D1):D721–d728. doi:10.1093/nar/gky900
36. Jin S, Guerrero-Juarez CF, Zhang L, et al. Inference and analysis of cell-cell communication using cellchat. Nat Commun. 2021;12(1):1088. doi:10.1038/s41467-021-21246-9
37. Satija R, Farrell JA, Gennert D, Schier AF, Regev A. Spatial reconstruction of single-cell gene expression data. Nat Biotechnol. 2015;33(5):495–502. doi:10.1038/nbt.3192
38. Calakos N, Caffall ZF. The integrated stress response pathway and neuromodulator signaling in the brain: lessons learned from dystonia. J Clin Invest. 2024;134(7). doi:10.1172/jci177833
39. Fernandes HJR, Patikas N, Foskolou S, et al. Single-cell transcriptomics of Parkinson’s disease human in vitro models reveals dopamine neuron-specific stress responses. Cell Rep. 2020;33(2):108263. doi:10.1016/j.celrep.2020.108263
40. Han S, Lee M, Shin Y, et al. Mitochondrial integrated stress response controls lung epithelial cell fate. Nature. 2023;620(7975):890–897. doi:10.1038/s41586-023-06423-8
41. Hong H, Wang Y, Menard M, et al. Suppression of the JAK/STAT pathway inhibits neuroinflammation in the line 61-PFF mouse model of Parkinson’s disease. J Neuroinflammation. 2024;21(1):216. doi:10.1186/s12974-024-03210-8
42. Guo DK, Zhu Y, Sun HY, et al. Pharmacological activation of REV-ERBα represses LPS-induced microglial activation through the NF-κB pathway. Acta Pharmacol Sin. 2019;40(1):26–34. doi:10.1038/s41401-018-0064-0
43. Liu Z, Qiu AW, Huang Y, et al. IL-17A exacerbates neuroinflammation and neurodegeneration by activating microglia in rodent models of Parkinson’s disease. Brain Behav Immun. 2019;81:630–645. doi:10.1016/j.bbi.2019.07.026
44. Yan Z, Yang W, Wei H, et al. Dysregulation of the adaptive immune system in patients with early-stage Parkinson disease. Neurol Neuroimmunol Neuroinflamm. 2021;8(5). doi:10.1212/nxi.0000000000001036
45. Roodveldt C, Bernardino L, Oztop-Cakmak O, et al. The immune system in Parkinson’s disease: what we know so far. Brain. 2024;147(10):3306–3324. doi:10.1093/brain/awae177
46. Bjarnsholt T, Whiteley M, Rumbaugh KP, Stewart PS, Jensen P, Frimodt-Møller N. The importance of understanding the infectious microenvironment. Lancet Infect Dis. 2022;22(3):e88–e92. doi:10.1016/s1473-3099(21)00122-5
47. Ben-Shlomo Y, Darweesh S, Llibre-Guerra J, Marras C, San Luciano M, Tanner C. The epidemiology of Parkinson’s disease. Lancet. 2024;403(10423):283–292. doi:10.1016/s0140-6736(23)01419-8
48. Alarcón F, Maldonado JC, Cañizares M, Molina J, Noyce AJ, Lees AJ. Motor dysfunction as a prodrome of Parkinson’s Disease. J Parkinsons Dis. 2020;10(3):1067–1073. doi:10.3233/jpd-191851
49. Wang B, Peng L, Ouyang H, et al. Induction of DDIT4 impairs autophagy through oxidative stress in dry eye. Invest Ophthalmol Vis Sci. 2019;60(8):2836–2847. doi:10.1167/iovs.19-27072
50. Gharibi B, Ghuman M, Hughes FJ. DDIT4 regulates mesenchymal stem cell fate by mediating between HIF1α and mTOR signalling. Sci Rep. 2016;6:36889. doi:10.1038/srep36889
51. Zhang F, Liu G, Li D, Wei C, Hao J. DDIT4 and associated lncDDIT4 modulate Th17 differentiation through the DDIT4/TSC/mTOR pathway. J Immunol. 2018;200(5):1618–1626. doi:10.4049/jimmunol.1601689
52. Wang Y, Han E, Xing Q, et al. Baicalein upregulates DDIT4 expression which mediates mTOR inhibition and growth inhibition in cancer cells. Cancer Lett. 2015;358(2):170–179. doi:10.1016/j.canlet.2014.12.033
53. Zhu Z, Yang C, Iyaswamy A, et al. Balancing mTOR signaling and autophagy in the treatment of Parkinson’s disease. Int J Mol Sci. 2019;20(3):728. doi:10.3390/ijms20030728
54. Cui W, Yang X, Chen X, et al. Treating LRRK2‐related Parkinson’s disease by inhibiting the mTOR signaling pathway to restore autophagy. Adv Funct Mater. 2021;31(38):2105152. doi:10.1002/adfm.202105152
55. Mu N, Lei Y, Wang Y, et al. Inhibition of SIRT1/2 upregulates HSPA5 acetylation and induces pro-survival autophagy via ATF4-DDIT4-mTORC1 axis in human lung cancer cells. Apoptosis. 2019;24(9–10):798–811. doi:10.1007/s10495-019-01559-3
56. Pan X, Zhang Z, Liu C, et al. Circulating levels of DDIT4 and mTOR, and contributions of BMI, inflammation and insulin sensitivity in hyperlipidemia. Exp Ther Med. 2022;24(5):666. doi:10.3892/etm.2022.11602
 © 2025 The Author(s). This work is published and licensed by Dove Medical Press Limited. The
full terms of this license are available at https://www.dovepress.com/terms.php
and incorporate the Creative Commons Attribution
- Non Commercial (unported, 4.0) License.
By accessing the work you hereby accept the Terms. Non-commercial uses of the work are permitted
without any further permission from Dove Medical Press Limited, provided the work is properly
attributed. For permission for commercial use of this work, please see paragraphs 4.2 and 5 of our Terms.
© 2025 The Author(s). This work is published and licensed by Dove Medical Press Limited. The
full terms of this license are available at https://www.dovepress.com/terms.php
and incorporate the Creative Commons Attribution
- Non Commercial (unported, 4.0) License.
By accessing the work you hereby accept the Terms. Non-commercial uses of the work are permitted
without any further permission from Dove Medical Press Limited, provided the work is properly
attributed. For permission for commercial use of this work, please see paragraphs 4.2 and 5 of our Terms.
Recommended articles
Network Analysis of Osteoarthritis Progression Using a Steiner Minimal Tree Algorithm
Xie Y, Shao F, Ji Y, Feng D, Wang L, Huang Z, Wu S, Sun F, Jiang H, Miyamoto A, Wang H, Zhang C
Journal of Inflammation Research 2024, 17:3201-3209
Published Date: 18 May 2024
Integrated Bioinformatics Analysis for Revealing CBL is a Potential Diagnosing Biomarker and Related Immune Infiltration in Parkinson’s Disease
Chen Y, Tu Y, Yan G, Ji X, Chen S, Niu C, Liao P
International Journal of General Medicine 2024, 17:2371-2386
Published Date: 22 May 2024