")
Back to Journals » Journal of Inflammation Research » Volume 17
Interpretable Machine Learning Model Based on Superb Microvascular Imaging for Non-Invasive Determination of Crescent Status of IgAN
Authors Tang Y, Liu X, Zhou W , Qin X
Received 4 May 2024
Accepted for publication 28 August 2024
Published 2 September 2024 Volume 2024:17 Pages 5943—5955
DOI https://doi.org/10.2147/JIR.S476716
Checked for plagiarism Yes
Review by Single anonymous peer review
Peer reviewer comments 2
Editor who approved publication: Dr Tara Strutt
Yan Tang,1,* Xiaoling Liu,1,* Wang Zhou,2 Xiachuan Qin3
1Department of Ultrasound, Beijing Anzhen Hospital Nanchong Hospital, Nanchong Central Hospital, The Second Clinical Medical College, North Sichuan Medical College (University), Nan Chong, Sichuan, 637000, People’s Republic of China; 2Department of Ultrasound, The First Affiliated hospital of Anhui medical University, Hefei, Anhui, 230022, People’s Republic of China; 3Department of Ultrasound, Chengdu Second People’s Hospital, Chengdu, Sichuan, 610000, People’s Republic of China
*These authors contributed equally to this work
Correspondence: Xiachuan Qin, Department of Ultrasound,Chengdu Second People’s Hospital,Chengdu, Sichuan, 610000, People’s Republic of China, Tel +86 18113917878, Email [email protected]
Purpose: To assess the crescentic status of IgA nephropathy (IgAN) non-invasively using a superb microvascular imaging (SMI)-based radiomics machine learning (ML) model.
Patients and Methods: IgAN patients who underwent renal biopsy from June 2022 to October 2023, with two-dimensional ultrasound (US) and SMI examinations conducted one day prior to the renal biopsy. The patients selected were divided randomly into a training group and a test group in a 7:3 ratio. Radiomic features were extracted from US and SMI images, then radiomic features were constructed and ML models were further established using logistic regression (LR) and extreme gradient boosting (XGBoost)XGBoost to determine the crescentic status. The utility of the proposed model was evaluated using receiver operating characteristics, calibration, and decision curve analysis. The SHapley Additive exPlanations (SHAP) was utilized to explain the best-performing ML model.
Results: A total of 147 IgAN patients were included in the study, with 103 in the training group and 44 in the test group .Among them, the US-SMI based XGBoost model achieved the best results, with an the area under the curve (AUC) of 0.839 (95% CI,0.756– 0.910) and an accuracy of 78.6% in the training group.In the test group, the AUC was 0.859 (95% CI,0.721– 0.964), and the accuracy was 81.8%, significantly surpassing the ML model of a single modality and the clinical model established based on occult blood. Additionally, the decision curve analysis (DCA) demonstrated that the XGBoost model provided a higher overall net benefit in the both groups.
Conclusion: The SMI radiomics ML model has the capability to accurately predict the crescentic status of IgAN patients, providing effective assistance for clinical treatment decisions.
Keywords: IgA nephropathy, crescent, ultrasound, superb microvascular imaging, radiomics
Introduction
IgA nephropathy (IgAN) is recognized as the most common primary glomerulonephritis worldwide, especially in Asia.1,2 It is characterized by the deposition of IgA in the mesangial area of glomeruli, with the risk of end-stage renal disease (ESRD) ranging from 5% to 60% within 10 years.3 Pathological results are often required to guide the determination of appropriate treatment methods aims at preventing the progression. While various pathological classification systems for IgAN exist, the Oxford classification of IgAN is widely acknowledged.4,5 In 2016, the crescent were incorporated into the updated Oxford classification of IgAN, which states that a score of C1 identifies patients who are at an increased risk of poor outcomes without immunosuppression,5 the crescent are defined as two or more layers of proliferating cells in Bowman’s space, serving as a and are a hallmark of inflammatory active glomerulonephritis and a histologic marker of severe glomerular injury.6 From an immunological perspective, complement activation may be involved in the formation of crescents and disease activity, and crescents may be a pathological manifestation of immune activity in IgAN patients.7 Crescent formation occurs in about 20–50% of IgAN patients.8 The crescent, as an independent predictive risk factor for IgAN progression, may undergo changes over time.9–11 Meanwhile, the value of crescents as a progression marker benefiting from immunosuppressive methods.12 Therefore, non-invasive understanding of the crescent state of IgAN patients can effectively guide clinical treatment plans. Currently, renal biopsy is the sole means to obtain the crescentic status of IgAN patients. However, as an invasive procedure, renal biopsy may give rise to complications such as bleeding, fistula, and even death.13,14 Some patients harbor fear and resistance towards renal biopsy, and despite the evolving pathological characteristics, repeating renal biopsy pose challenges.15
In the past decade, the application of machine learning (ML) in the medical field has experienced explosive growth.16,17 ML aims to solve tasks by learning patterns from data rather than using manually encoded rules. The advancements in computer vision ML have been applied to medical imaging and have shown great potential in quickly and accurately analyzing various imaging patterns in clinical settings. Radiomics involves the conversion of medical images into exploitable high-throughput quantitative features,18,19 assessing the heterogeneity of lesions by utilizing information related to their phenotype, such as shape, intensity, wavelet, texture, and other features. Recently, it has been found in multiple studies that ultrasound radiomics can effectively identify biomarkers for subclinical changes in the kidneys based on ultrasound images.20,21 In our previous research, radiomics features were extracted from two-dimensional ultrasound (US) images of the kidneys, and an ML model was established to predict the crescent state of IgAN. A result of an AUC of 82.2 was obtained in the test group.21 However, the diagnostic value provided by a single modality is often limited. Therefore, a radiomics ML model was established based on superb microvascular imaging (SMI) imaging in an attempt to detect the crescent state of IgAN non-invasively.
Materials and Methods
This retrospective cohort study complied with the Declaration of Helsinki, Our research was reviewed and approved by the Ethics Committee of Nanchong Central Hospital (Approval number: 2022(NO091)). As the data used for this research were anonymized, removing all personal identifiers, the requirement for written informed consent was waived. From May 2022 to October 2023,147 IgAN patients who underwent renal biopsy were prospectively collected. The patient underwent ultrasound examination one day before renal biopsy. The inclusion criteria were as follows: 1. Optical microscope specimens with more than 10 glomeruli; 2. Over 18 years old; 3. The distance between the kidneys and the skin is less than 5cm. The exclusion criteria were: 1. The patients who could not cooperate with breath hold instructions; 2. Presence of acute kidney injury, heart valve disease, or heart failure; 3. Urinary tract obstruction; 4. Kidney cysts or tumors; 5. Doppler mode indicating renal artery stenosis.22 Furthermore, the patients were randomly divided into a training group and a test group in a 7:3 ratio. The research flowchart is shown in Figure 1.
 |
Figure 1 Patient flowchart. |
Previous studies have found that microscopic hematuria indicates active renal inflammation and could serve as a substitute biomarker for crescents.21,23 Therefore, a clinical prediction model was established based on microscopic hematuria.
Renal Pathology
Renal biopsy was performed within one day after renal ultrasound measurement. The pathological variables of IgAN were scored according to the Oxford Classification MEST-C standard, which includes increased mesangial cells, increased intracellular count in capillaries, segmental glomerulosclerosis, tubular atrophy/interstitial fibrosis, and crescent shaped glomerular degeneration. Cellular or fibrocellular crescents were assessed based on the percentage of glomeruli with them:C0 indicating absence, C1 indicating 0–25% of glomeruli, and C2 indicating ≥25% of glomeruli.24 Due to a limited number of samples, C1 and C2 cases were combined into one group.
Ultrasound Image Collection
The US and SMI images were collected by three experienced radiologists (with 6.10 and 16 years of experience in renal ultrasound examination) using the ultrasound diagnostic instrument (Canon Medical Systems, Otawara, Japan Aplio 700), equipped with a 3.5MHz convex array probe (i8C1).
The patient fasted for more than 8 hours before undergoing ultrasound examination. During the ultrasound examination, the patient was instructed to hold breath at the end of inhalation. The ultrasound probe was gently positioned on the lateral abdomen in an oblique projection manner, positioning it on the posterior axillary line. Once the maximum longitudinal section of the kidney was obtained, the settings on the ultrasound diagnostic device were switched to SMI mode. The SMI specific area of interest box was placed throughout the entire kidney, instructing the patient to hold their breath to obtain the optimal blood flow section of the kidney. The mechanical index was 1.6, the frame rate was 25–35 frames/s, the dynamic range was 65–75 dB, and the SMI speed was 3.5 cm/s.
Image Segmentation
All ultrasound images of patients were directly exported and stored in DICOM format from the ultrasound diagnostic instrument. Firstly,the target kidney US and SMI were imported into ITK-SNAP (version 3.8.0), http://www.itksnap.org/pmwiki/pmwiki.php?n=Downloads.SNAP3), with target renal cortex labeled as region of interest(ROI). Figure 2 showed the workflow of an SMI-based ultrasound radiomics model. Ultrasound images from 50 patients were randomly selected, and ROI segmentation was performed by two radiologists (radiologist 1, with 9 years of experience in abdominal ultrasound, and radiologist 2,with 7 years of experience in abdominal ultrasound), who were unaware of crescent results. Intra-group and inter-group correlation coefficients(ICC) were used to evaluate the inter-group consistency of features. Two weeks later, radiologist 1 repeated the same steps to evaluate the intra-group consistency of feature extraction. An ICC value of ≥0.75 indicated good consistency in the extracted features, and features with an ICC<0.75 were excluded from subsequent analysis. Then, the remaining image segmentation was performed separately by radiologist 1.
 |
Figure 2 The ultrasound radiomics flow chart of the study. |
Ultrasound Radiomics Feature Extraction
To reduce data variability and accurately quantify radiomics features, we first standardized the image grayscale to ensure a consistent grayscale distribution across the image. Subsequently, we implemented image-denoising techniques to mitigate potential noise interference during the feature extraction process. Furthermore, we resampled the images using a linear interpolation algorithm to obtain a standardized voxel spacing of 1 × 1 × 1 mm (x,y,z).
Radiomics feature extraction is achieved using Pyradiomics in Python (version 2.2.0,http://www.radiomics.io/pyradiomics.htm), enabling the extraction of features from ultrasound images through encoding feature algorithms. The filters utilized include original image, wavelets, squares, square roots, logarithms, exponents, gradients, and local binary pattern 2D and 3D. The types of features extracted encompass a range of statistical and morphological attributes, such as First Order Statistics, Shape-based features, Gray Level Co-occurrence Matrix, Gray Level Run Length Matrix, Gray Level Size Zone Matrix, Neighbouring Gray Tone Difference Matrix, and Gray Level Dependence Matrix. The steps for selecting ultrasound radiomics features were as follows: Firstly, features with ICC≥0.75 were retained in the training group. Secondly, single-factor rank sum test was employed to screen out statistically significant differences in features between the C0 and C1/2 group in the training group. Subsequently, Spearman correlation analysis was performed on the remaining radiomics features to eliminate redundant features with correlation coefficients>0.90. Fourthly, the Elastic-network regression algorithm was applied to the radiomics features to select the most valuable ones25.
Establishment of Machine Learning Models
Two ML algorithms were trained based on the results of radiomics feature selection, including logistic regression(LR) and extreme gradient boosting(XGBoost). They were adjusted using the grid search method and ten-fold cross-validation in the training group, respectively. In each loop, the hyperparameters with the best AUC in the training group were retained.
The Interpretability of the Model
SHAP was utilized to visualize the importance of features in the best performing ML model.26 Firstly, the SHAP Feedback graph was employed to provide a global explanation of the model, demonstrating the importance of all features. SHAP values for each sample were plotted, with the y-axis representing each feature and the x-axis representing the SHAP values. SHAP values measure the contribution of each feature to the model’s predictions. Positive values indicated positive correlation, while negative values indicate negative correlation. Each dot represents the SHAP values of a single sample, with the color of the dots representing the size of the feature values. Subsequently, SHAP was employed to display the SHAP values of individual samples, aiding in understanding how each feature affects the output of a single model and achieving visual interpretation of individual samples. The number above the graph represented the output value of the model, and the number below the arrow in the graph represents the characteristic value of the patient.High predicted features are represented in red, while low predicted features are represented in blue. The longer the arrow,the greater the impact of the features on the output. The increase or decrease in the influence of the features could be observed through the scale value on the x-axis.
Statistical Analysis
All statistical analyses were conducted using SPSS 26.0 (IBM Corp., Armonk, NY, USA) and Python 2.7 (Python Software Foundation, Beaverton, OR, USA). Quantitative data with a normal distribution was represented as mean±standard deviation, and analyzed using independent samples t-test, while non-normally distributed quantitative data was represented as media interquartile range, and the Mann–Whitney U-test was used. Meanwhile, categorical variables were represented in numbers and percentages and analyzed using the chi-square test or Fisher’s exact test.A P<0.05 was considered statistically significant. To compare the predictive performance of ML models in the training and test groups for detecting crescentic bodies in IgAN patients, the receiver operating characteristic (ROC) curves were constructed, and their area under the curve (AUC) values were calculated. The cut-off values obtained from the ROC curves were utilized to divide the data between the training and test groups, and calculated the accuracy, specificity, sensitivity, negative predictive value (NPV), and Positive predictive value (PPV) for detecting crescentic.
Results
The study included 147 IgAN patients for renal biopsy, comprising 71 males and 76 females, aged 39.3±11.6 (range 18–71 years), 81 patients with C0, and 66 patients with C1/2. In the training group, which consisted of 103 patients, there were 46 males and 57 females, aged 39.7±11.5 (range 18–70 years), with 57 patients having C0 and 46 patients having C1/2. The test group comprised 44 patients, including 25 males and 19 females, aged 38.5±11.9 (range 18–71 years), with 24 patients having C0 and 20 patients having C1/2.The clinical characteristics of IgAN patients are shown in Table 1.
 |
Table 1 Clinical Factors in the Training and Testing Group |
Diagnostic Performance of ML Models Based on US Radiomics
A total of 873 ultrasound radiomics features were extracted from ultrasound images. After ICC analysis, significant differences in 692 ultrasound radiomics features were identified between the two groups. Single factor and Spearman correlation analysis were conducted on radiomics features, resulting in the identification of 13 relevant features. Finally, an Elastic-logistic analysis was performed to generate the 10 most valuable ultrasound radiomics features (logs)(λ) = - 3.429,α=0.3).
Two different ML models were constructed using different algorithms. The diagnostic performance of these ML models is shown in Table 2. The ROC and the decision curve analysis (DCA) curves of the two models based on the training and test groups are shown in Figure 3. The XGBoost model exhibited the best performance in assessing the crescent in IgAN patients: the AUC of the training group was 0.777 (95% CI,0.682–0.860), with an accuracy of 72.8%, sensitivity of 58.7%, specificity of 84.2%, PPV of 75% and NPV of 71.6%. The AUC of the test group was 0.756 (95% CI,0.602–0.891), with an accuracy of 68.2%, sensitivity of 55%, specificity of 79.2%, PPV of 68.8% and NPV of 67.9%.
 |
Table 2 Performance of Six Radiomics ML Models in the Training and the Testing Group |
 |
Figure 3 The ROC and DCA curves of the six models in the training and test group. (A–C) show the ROC and DCA curves of the six models in the training group. (B–D) represent the ROC and DCA curves of six models in the test group. |
Diagnostic Performance Based on SMI Radiomics ML Model
A total of 873 SMI radiomics features were extracted from US images. After ICC analysis, it was found that there were significant differences in 633 ultrasound radiomics features between the two groups. After conducting single factor and Spearman correlation analysis on radiomics features,10 relevant features were obtained. Finally, an Elastic-logistic analysis was conducted to generate the 9 most valuable ultrasound radiomics features (logs)(λ) = - 3.872,α=0.3).
Two different ML models were constructed using different algorithms. The diagnostic performance of these ML models is shown in Table 2. The ROC and DCA curves of the two models based on the training and test groups are shown in Figure 3. The XGBoost model had the best performance in assessing the crescent in IgAN patients: the AUC of the training group was 0.757 (95% CI,0.655–0.843), with an accuracy of 71.8%, sensitivity of 69.6%, specificity of 73.7%, PPV of 68.1% and NPV of 75%. The AUC of the test group was 0.765 (95% CI,0.602–0.899), with an accuracy of 70.5%, sensitivity of 80%, specificity of 62.5%, PPV of 64% and NPV of 78.9%.
Diagnostic Efficiency of Joint Models
The obtained SMI and US features were merged, and an Elastic-logistic analysis was performed on the radiomics features. Analysis of the remaining 18 radiomics features yielded (log(λ) =- 4.809,α=0)(Table 3). In the training group, the AUC was 0.839 (95% CI,0.756–0.910), with an accuracy of 78.6%, sensitivity of 73.9%, specificity of 82.5%, PPV of 77.3%, and NPV of 79.7%. Similarly, in the test group, the AUC was 0.859 (95% CI,0.721–0.964), with an accuracy of 81.8%, sensitivity of 75%, specificity of 87.5%, PPV of 83.3% and NPV of 80.8% (Table 2 and Figure 3). Moreover, in both the training and test groups,DCA demonstrated that XGBoost had a higher overall net profit (Figure 3). The performance of the joint XGBoost model was better than that of LR model and single mode model.
 |
Table 3 Coefficients of Selected Features in the US+SMI Radiomics Model |
The Interpretability of Machine Learning Models
A Beeswarm plot was utilized to rank the importance of features (Figure 4), where the top ten important ultrasound radiomics features were ranked. SMI accounts for 50% (5/10), while US accounted for the remaining 50% (5/10). Additionally, two patients (patients A and B) were randomly selected to illustrate the individual prediction of the model using the SHAP plot method. As shown in the figure, the plot generated by SHAP (Figure 5) showed positive values in red and negative values in blue. The impact of each feature on the model’s classification output can be observed through the scale values on the X-axis.
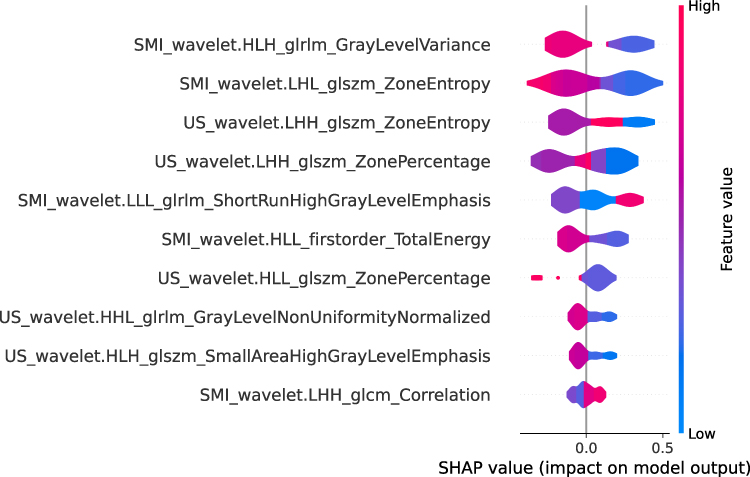 |
Figure 4 The global interpretation of the SHAP Beeswarm diagram. It can be noted that SMI occupies six of the ten features, and US occupies six of the ten features. |
 |
Figure 5 Individual prediction of the model using the SHAP plot method. (A).Patient A is C0 (B). Patient B is C1/2. |
Discussion
A meta-analysis involving 3893 IgAN patients revealed a correlation between crescentic bodies and an increase in renal failure events.27 Recently,Dingxin Di’s study found that even if the proportion of crescents in IgAN patients was only 10% of the glomerulus, it still was an independent risk factor for predicting kidney survival.8 Research by Qing Jia’s suggests that immunosuppressive therapy can decelerate the rate of renal function decline in IgAN patients with C1.10 However, renal biopsy currently remains the sole method to assess the crescent state of IgAN patients. As an invasive diagnostic tool, it imposes physical and emotional distress on patients. Hence, there is an urgent need for a non-invasive diagnostic approach for determining the crescent state of IgAN patients, which can effectively guide clinical treatment strategies. In this study, radiomics features were extracted from US-SMI images, and an XGBoost ML model was established. The non-invasive crescent state detection model in IgAN patients exhibited satisfactory predictions for both the training and test groups, with AUCs of ROC being 0.839 and 0.859, respectively. The diagnostic performance of bimodal models surpassed that of unimodal models and clinical models based on hematuria. The results demonstrate the feasibility of using an SMI-based radiomics ML model to assess the crescent state of IgAN. To the best of our knowledge, this study represents the first attempt to employ a radiomics ML model using US-SMI images for determine the crescent state of IgAN. Our model can accurately and non invasively understand the crescent state of IgAN, providing guidance to clinical doctors on whether to use immunosuppressants.
Previous studies have mostly used clinical parameters to predict the crescent state of IgAN.7,28 Renal ultrasound is a routine method for outpatient follow-up of kidney changes, which can detect morphological changes in the kidneys.29 Qin established an ML model based on renal US images to predict the crescent state of IgAN, and obtained the result of AUC0.81 in the test group, which represents the potential crescent biological prediction index of IgAN patients’ kidneys and quantifies the heterogeneity within renal tissue. However, the information provided by a single US image is often limited.21 In recent years, SMI has been widely adopted as a novel non-invasive blood flow imaging mode in clinical practice. It utilizes filters distinct from color Doppler ultrasound(CDUS) to minimize motion artifacts. Even without the use of any contrast agents, SMI can enhance the visibility of low-speed blood flow and improve sensitivity to detecting small vessel signals.30,31 Compared with traditional CDUS, SMI can sensitively detect low-speed blood flow and provide more detailed microvascular information.32 The features perceivable by the human eye from the kidney images are limited, and many internal details of the image may do unrecognized. Ultrasound radiomics, in contrast, can extract microscopic features of ROI in medical images, transforming medical images related to pathological and physiological information of lesions into high-dimensional data that can be analyzed.33 In recent years, researchers have explored the application of ultrasound radiomics in diagnosing kidney disease. LILI ZHU extracted ultrasound radiomics features from US images to evaluate renal function of transplanted kidneys through various ML methods. The results indicated that ultrasound radiomics based on US exhibits good discriminative ability for renal function. It is believed that ultrasound radiomics can detect pathological changes in conventional US images that may not be directly perceptible to the human eye.34 Ali Abbasian Ardakani’s study demonstrated a significant correlation between ultrasound radiomics texture features and serum creatinine levels in kidney transplant patients. The study also suggested that ultrasound radiomics can identify pathological changes not detectable by conventional ultrasound.35 Qin et al extracted a total of 1550 ultrasound radiomics features from kidney US images, retaining ten ultrasound radiomics features after screening, and established five ML models for non-invasive diagnosis of lupus nephropathy. Among them, the MLP model exhibited the best performance: the AUC of the ROC curve in the training group was 0.891, with an accuracy of 81.7%; The AUC and accuracy of the ROC curve in the validation group were 0.822 and 73.3%, respectively.20 Radiomics features were simultaneously extracted from both US and SMI images of patients, demonstrating imaging features extracted in both types of images. This also verified that two-dimensional ultrasound and renal fine blood flow display can serve as potential biological markers for assessing crescents.Based on these fifteen ultrasonic radiomics characteristics, five ML prediction models were established. Among them, the XGBoost model yielded optimal results. The AUC of ROC curve in the validation group and the test group was 0.839 and 0.859, respectively, outperforming single-mode ML models. These results suggest that the ultrasound radiomics model processes robust data processing capabilities for high-throughput data and can identify biomarkers of subclinical changes based on ultrasound images.
Renal perfusion is characterized by abundance, highly vascularized, and structurally complex, typically accounting for 25% of cardiac output.36 Focal rupture in the glomerulus basement membrane can lead to crescent formation.37 This phenomenon also explain why pre-treatment hematuria may serve as an alternative marker for predicting the presence of cellular/fibroblast crescents,38 Hematuria reflects ongoing kidney inflammation, closely associated with crescent formation.23 However, clinical measurements of hematuria lack sufficient reliability as biomarkers for determining the status of crescents. We hypothesized that crescents may influence renal microvascular flow. SHAP is utilized to visualize the importance of model features by assigning values, known as SHAP values, reflecting the relationship between features and outputs. It assigns specific predicted importance values to each feature, thereby enhancing transparency and interpretability for ML models.26 In this study, a total of 1746 ultrasound radiomics features were extracted from US and SMI images. Following data dimensionality reduction analysis, 18 highly correlated ultrasound radiomics features associated with crescent height of IgAN patients were obtained, comprising 9 for US and 9 for SMI. These texture features depict microscopic characteristics in ultrasound images imperceptible to the human eye. Additionally, a Beeswarm plot was employed to demonstrate the importance of all features. Among the top 10 most contributing features, SMI accounted to 5, reaffirming the crucial role of SMI in determining crescent in IgAN patients.
Our research possesses certain limitations: 1. The sample size of this study is relatively limited, potentially introducing bias into the results. So, the large number of patients will be needed to prove the robustness and accuracy of this ML model; 2. This study is conducted at a single center, and multi center validation could enhance generalization performance validation; 3. Although the XGBoost model has achieved high diagnostic performance, the information provided by still images is still limited. In future research, we will further investigate the role of video in evaluating the crescent state in IgAN.
Conclusion
In summary, the crescentic state of IgAN can be effectively detected by the radiomics XGBoost model based on US-SMI image of the kidney. This model has high accuracy, discriminative power, and predictive ability.The performance of the model was better than that of LR model and single mode model in assessing the crescent in IgAN patients. The model provides an easy-to-use and personalized tool for non-invasive diagnosis of IgA crescents, which can help doctors develop more favorable treatment plans for patients, and clinical screening of high-risk patients.
Abbreviation
IgAN, IgA nephropathy; SMI, superb microvascular imaging; ML, machine learning; US, two-dimensional ultrasound; LR, logistic regression; XGBoost, extreme gradient boosting; SHAP, The SHapley Additive exPlanations; AUC, area under the curve; DCA, decision curve analysis; ESRD, end-stage renal disease; ICC, Intra-group and inter-group correlation coefficients; NPV, negative predictive value; PPV, Positive predictive value; CDUS, color Doppler ultrasound.
Data Sharing Statement
The study data may be provided by contacting the corresponding author.
Ethical Statement
Our research was reviewed and approved by the Ethics Committee of Nanchong Central Hospital (Approval number: 2022(NO091)).
Funding
This study has received funding from the Science and Technology Project of Nanchong City (22JCYJPT0004).
Disclosure
The authors declare that they have no competing interests in this work.
References
1. Pattrapornpisut P, Avila-Casado C, Reich HN. IgA Nephropathy: core Curriculum 2021. American j Kidn Dis. 78(3):429–441. doi:10.1053/j.ajkd.2021.01.024
2. IgA nephropathy. Nature Reviews Disease Primers. 2023;9(1):68. doi:10.1038/s41572-023-00483-w
3. Barbour SJ, Coppo R, Zhang H, et al. Evaluating a New International Risk-Prediction Tool in IgA Nephropathy. JAMA Intern Med 2019. 179(7):942–952. doi:10.1001/jamainternmed.2019.0600
4. Roberts IS, Cook HT, Troyanov S, et al. The Oxford classification of IgA nephropathy: pathology definitions, correlations, and reproducibility. Kidney Int. 2009;76(5):546–556. doi:10.1038/ki.2009.168
5. Trimarchi H, Barratt J, Cattran DC, et al. Oxford Classification of IgA nephropathy 2016: an update from the IgA Nephropathy Classification Working Group. Kidney Int. 2017;91(5):1014–1021. doi:10.1016/j.kint.2017.02.003
6. Trimarchi H. Crescents in primary glomerulonephritis: a pattern of injury with dissimilar actors. A pathophysiologic perspective. Pediatric Nephr. 2022;37(6):1205–1214. doi:10.1007/s00467-021-05199-1
7. Zhang Q, Pan H, Bian XY, et al. Crescent calculator: a webtool enabling objective decision-making for assessment of IgA nephropathy immune activity throughout the disease course. Clin Chim Acta 2024. 555:117783. doi:10.1016/j.cca.2024.117783
8. Di D, Liu L, Wang Y, Yang Y, Jiang S, Li W. Crescents proportions above 10% are associated with unfavorable kidney outcomes in IgA nephropathy patients with partial crescent formation. Renal Failure. 2023;45(1):2226257. doi:10.1080/0886022x.2023.2226257
9. Coppo R, Davin JC. The difficulty in considering modifiable pathology risk factors in children with IgA nephropathy: crescents and timing of renal biopsy. Pediatric Nephrology. 2015;30(2):189–192. doi:10.1007/s00467-014-2954-9
10. Jia Q, Ma F, Yang X, et al. Long-term outcomes of IgA nephropathy patients with less than 25% crescents and mild proteinuria. Clin experi nephr. 2022;26(3):257–265. doi:10.1007/s10157-021-02154-0
11. Shen XH, Liang SS, Chen HM, et al. Reversal of active glomerular lesions after immunosuppressive therapy in patients with IgA nephropathy: a repeat-biopsy based observation. J Nephro. 2015;28(4):441–449. doi:10.1007/s40620-014-0165-x
12. Haas M, Verhave JC, Liu ZH, et al. A Multicenter Study of the Predictive Value of Crescents in IgA Nephropathy. J American Soci Nephr. 2017;28(2):691–701. doi:10.1681/asn.2016040433
13. Whittier WL, Korbet SM. Timing of complications in percutaneous renal biopsy. J Am Soc Nephrol. 2004;15(1):142–147. doi:10.1097/01.asn.0000102472.37947.14
14. Webster AC, Nagler EV, Morton RL, Masson P. Chronic Kidney Disease. Lancet. 2017;389(10075):1238–1252. doi:10.1016/s0140-6736(16)32064-5
15. Jullien P, Laurent B, Berthoux F, et al. Repeat renal biopsy improves the Oxford classification-based prediction of immunoglobulin A nephropathy outcome. Neph Dial Transpl. 35(7):1179–1186. doi:10.1093/ndt/gfy341
16. Swanson K, Wu E, Zhang A, Alizadeh AA, Zou J. From patterns to patients: advances in clinical machine learning for cancer diagnosis, prognosis, and treatment. Cell. 2023;186(8):1772–1791. doi:10.1016/j.cell.2023.01.035
17. Haug CJ, Drazen JM. Artificial Intelligence and Machine Learning in Clinical Medicine, 2023. New England J Med. 388(13):1201–1208. doi:10.1056/NEJMra2302038
18. Lambin P, Leijenaar RTH, Deist TM, et al. Radiomics: the bridge between medical imaging and personalized medicine. Nat Rev Clin Oncol. 2017;14(12):749–762. doi:10.1038/nrclinonc.2017.141
19. Bi WL, Hosny A, Schabath MB, et al. Artificial intelligence in cancer imaging: clinical challenges and applications. CA. 69(2):127–157. doi:10.3322/caac.21552
20. Qin X, Xia L, Zhu C, et al. Noninvasive Evaluation of Lupus Nephritis Activity Using a Radiomics Machine Learning Model Based on Ultrasound. J inflamm rese. 16:433–441. doi:10.2147/jir.S398399
21. Qin X, Xia L, Hu X, et al. A novel clinical-radiomic nomogram for the crescent status in IgA nephropathy. Front Endocr. 14:1093452. doi:10.3389/fendo.2023.1093452
22. Kliewer MA, Tupler RH, Carroll BA, et al. Renal artery stenosis: analysis of Doppler waveform parameters and tardus-parvus pattern. Radiology. 1993;189(3):779–787. doi:10.1148/radiology.189.3.8234704
23. Bobart SA, Alexander MP, Shawwa K, et al. The association of microhematuria with mesangial hypercellularity, endocapillary hypercellularity, crescent score and renal outcomes in immunoglobulin A nephropathy. Nephrolo Dialys Transplan. 36(5):840–847. doi:10.1093/ndt/gfz267
24. Markowitz G. Glomerular disease: updated Oxford Classification of IgA nephropathy: a new MEST-C score. Nature Reviews Neph. 13(7):385–386. doi:10.1038/nrneph.2017.67
25. Zou H. Some Perspectives of Sparse Statistical Modeling. Stanford University; 2005.
26. Lundberg SM, Lee S-I. A unified approach to interpreting model predictions. Adv Neural Info Proce Syst. 30.
27. Lv J, Shi S, Xu D, et al. Evaluation of the Oxford Classification of IgA nephropathy: a systematic review and meta-analysis. Amer J Kid Dise. 2013;62(5):891–899. doi:10.1053/j.ajkd.2013.04.021
28. Lin Z, Feng L, Zeng H, et al. Nomogram for the prediction of crescent formation in IgA nephropathy patients: a retrospective study. BMC Nephrol. 2023;24(1):262. doi:10.1186/s12882-023-03310-2
29. Petrucci I, Clementi A, Sessa C, Torrisi I, Meola M. Ultrasound and color Doppler applications in chronic kidney disease. J Nephr. 31(6):863–879. doi:10.1007/s40620-018-0531-1
30. Collaku E, Simonini R, Balbi M, et al. Superb Microvascular Imaging (SMI) Compared with Color Doppler Ultrasound for the Assessment of Hepatic Artery in Pediatric Liver Transplants: a Feasibility Study. Diagnostics. 2022;12:(6). doi:10.3390/diagnostics12061467
31. Jeon SK, Lee JY, Kang HJ, Han JK. Additional value of superb microvascular imaging of ultrasound examinations to evaluate focal liver lesions. European j radiolo. 152:110332. doi:10.1016/j.ejrad.2022.110332
32. Mao Y, Mu J, Zhao J, Yang F, Zhao L. The comparative study of color Doppler flow imaging, superb microvascular imaging, contrast-enhanced ultrasound micro flow imaging in blood flow analysis of solid renal mass. Cancer imagi. 22(1):21. doi:10.1186/s40644-022-00458-2
33. Gillies RJ, Kinahan PE, Hricak H. Radiomics: images Are More than Pictures, They Are Data. Radiology. 2016;278(2):563–577. doi:10.1148/radiol.2015151169
34. Zhu L, Huang R, Li M, et al. Machine Learning-Based Ultrasound Radiomics for Evaluating the Function of Transplanted Kidneys. Ultrasound Med Biol. 2022;48(8):1441–1452. doi:10.1016/j.ultrasmedbio.2022.03.007
35. Abbasian Ardakani A, Mohammadi A, Khalili Najafabad B, Abolghasemi J. Assessment of Kidney Function After Allograft Transplantation by Texture Analysis. Iranian j Kidney Disea. 11(2):157–164.
36. Carlström M, Wilcox CS, Arendshorst WJ. Renal autoregulation in health and disease. Physiol Rev. 2015;95(2):405–511. doi:10.1152/physrev.00042.2012
37. Roberts IS. Pathology of IgA nephropathy. Nature Revi Neph. 10(8):445–454. doi:10.1038/nrneph.2014.92
38. Nagai M, Kobayashi N, Izumi N, Ohbayashi T, Hotta O, Hamano T. Pre-treatment hematuria and crescents predict estimated glomerular filtration rate trajectory after methylprednisolone pulse therapy with tonsillectomy for IgA nephropathy. J Neph. 2022;35(2):441–449. doi:10.1007/s40620-021-01064-4
 © 2024 The Author(s). This work is published and licensed by Dove Medical Press Limited. The
full terms of this license are available at https://www.dovepress.com/terms.php
and incorporate the Creative Commons Attribution
- Non Commercial (unported, 3.0) License.
By accessing the work you hereby accept the Terms. Non-commercial uses of the work are permitted
without any further permission from Dove Medical Press Limited, provided the work is properly
attributed. For permission for commercial use of this work, please see paragraphs 4.2 and 5 of our Terms.
© 2024 The Author(s). This work is published and licensed by Dove Medical Press Limited. The
full terms of this license are available at https://www.dovepress.com/terms.php
and incorporate the Creative Commons Attribution
- Non Commercial (unported, 3.0) License.
By accessing the work you hereby accept the Terms. Non-commercial uses of the work are permitted
without any further permission from Dove Medical Press Limited, provided the work is properly
attributed. For permission for commercial use of this work, please see paragraphs 4.2 and 5 of our Terms.