")
Back to Journals » Journal of Inflammation Research » Volume 17
Investigation and Confirmation of PYCARD as a Potential Biomarker for the Management of Psoriasis Disease
Authors Xu B , Yu B, Xu Z, Ye S, Qing Y, Sun H, Zhao B, Wu N, Wu J
Received 21 May 2024
Accepted for publication 29 August 2024
Published 16 September 2024 Volume 2024:17 Pages 6415—6437
DOI https://doi.org/10.2147/JIR.S468746
Checked for plagiarism Yes
Review by Single anonymous peer review
Peer reviewer comments 2
Editor who approved publication: Dr Tara Strutt
Bingyang Xu,1 Biao Yu,2 Zining Xu,1 Shuhong Ye,1 Yuxin Qing,1 Hong Sun,3 Bin Zhao,4 Na Wu,5 Jiawen Wu1
1Department of Dermatology, The Second Affiliated Hospital of Xi’an Jiaotong University, Xi’an, People’s Republic of China; 2Department of Dermatology, Taihe Hospital, Hubei University of Medicine, Shi’yan, People’s Republic of China; 3Department of Neurology, The Second Affiliated Hospital of Xi’an Jiaotong University, Xi’an, People’s Republic of China; 4Department of Dermatology, Xi’an International Medical Center Hospital, Xi’an, People’s Republic of China; 5Department of Nursing, Xi’an Jiaotong University Medical School, Xi’an, People’s Republic of China
Correspondence: Jiawen Wu, Department of Dermatology, The Second Affiliated Hospital of Xi’an Jiaotong University, Xi’an, People’s Republic of China, Email [email protected]
Purpose: Psoriasis is not yet completely curable, and its etiology and pathogenesis are unclear. Necroptosis, also known as programmed necrosis, is a regulated mode of necrotic cell death. The interaction between inflammatory diseases and necrotic apoptosis has recently attracted significant attention. We explored the molecular mechanisms of necrotic apoptosis-related genes in psoriasis using bioinformatics methods to identify potential biomarkers for psoriasis.
Patients and Methods: In this study, we screened psoriasis differentially expressed genes from the datasets GSE13355 and GSE14905 and took intersections with necrotic apoptosis-related genes for the next analysis. We used multiple machine learning algorithms to screen key genes and perform enrichment analysis. In addition, we performed an immune infiltration analysis. Transcription factors were predicted by the R package “RcisTarget”. We also observed the cellular clustering of key genes in different cell types at the single-cell sequencing level. We used real-time fluorescence-based quantitative-polymerase chain reaction, Western blot, and immunohistochemistry to analyze gene expression in clinical samples. We constructed an imiquimod-induced psoriasis-like dermatitis model in mice for further validation.
Results: Seven key genes were screened as follows: AIM2, CARD6, HPSE, MYD88, PYCARD, RAI14, and TNFSF10. Enrichment analysis showed that the key genes were mainly involved in inflammatory pathways. Immune infiltration analysis showed significantly higher levels of CD8 T cells, CD4 initial T cells, and CD4 memory-activated T cells in the disease group’s samples than in the normal patients’ samples. The key gene expression in single cells analyzed showed that PYCARD was significantly expressed in keratinocytes. PYCARD was selected for gene expression analysis; the results showed that its expression was significantly elevated in the skin lesion tissues of patients with psoriasis. We also verified that PYCARD might play a vital role in the development of psoriasis skin lesions using animal experiments.
Conclusion: PYCARD plays a vital role in psoriasis development and is a potential biomarker for psoriasis.
Keywords: necrotic apoptosis-related gene, bioinformatics, inflammatory disease, immune disease
Introduction
Psoriasis is a genetically, environmentally, and immunologically mediated chronic inflammatory skin disease with a prevalence of approximately 2%. Skin damage is papular, scaly, or even blisters, with erythema or pustules in addition to papules and scales. Psoriasis is a skin disease that also involves other organs. Patients with psoriasis usually have hypertension, diabetes, metabolic syndrome, and other diseases.1 Furthermore, Damiani et al observed an increased likelihood of airway inflammation in patients with psoriasis.2 Accordingly, during treatment, it is necessary to not only treat the disease but also pay attention to associated comorbidities. Early identification and treatment of comorbidities is critical.3 The disease duration is long due to its high incidence and easy recurrence, and patients and society experience a heavy burden. The 2019 Global Burden of Disease study revealed a decreasing incidence of psoriasis worldwide. However, the regional differences suggested that targeted prevention and treatment remain important to reduce the global burden of the disease.4 However, its pathogenesis is poorly understood. Therefore, better technologies are urgently needed to elucidate the pathogenesis of psoriasis and identify key biomarkers.
The pathogenesis of psoriasis is not completely clear. Psoriasis is caused by the over-proliferation of epidermal keratinocytes, followed by inflammatory infiltration of the skin. T-cell aggregates have been observed in early psoriasis lesions, suggesting a sustained immune response. This response is mediated by the release of host defense proteins and chemokines, leading to large accumulations of T cells, macrophages, neutrophils, and dendritic cells in skin lesions.5 Research into the mechanisms of psoriasis has progressed over the past two decades.6 Recent studies show that cell-mediated adaptive immune responses are crucial in psoriasis.7 The intrinsic and adaptive cutaneous immune response is disrupted in psoriasis and is the most common cause. Immune response disorders contribute to the development of inflammation in psoriasis.8,9 Psoriasis develops because of the interaction of multiple cell types with inflammatory cytokines.10 Antimicrobial peptides released following keratinocyte stress trigger and maintain inflammatory pathways in psoriasis.11,12 The maintenance of psoriasis is primarily mediated by the tumor necrosis factor-alpha (TNF-α)/interleukin (IL)-23/IL-17 axis. Although IL-17, IL-23, and TNF are considered the major cytokines involved in developing psoriasis,13 attention has recently been focused on the role of inflammatory vesicle complex activation in psoriasis pathogenesis.14,15 Inflammatory vesicles are complexes comprising multiple proteins that are important components of the natural immune system. Several types of inflammasomes have been identified, including NOD-like receptor protein (NLRP) 1, NLRP3, NLRC4, and absent in melanoma 2 (AIM2). The NLRP3 inflammatory vesicle has been the most studied. It is a macromolecular multiprotein complex comprising apoptosis-associated speck-like protein (ASC) (encoded by the PYCARD gene), cysteinyl aspartate specific proteinase-1 (caspase-1), and NLRP3, which senses external pathogens or injury and transmits signals to the immune system to initiate an inflammatory response or induce apoptosis.16,17
The interaction between the inflammatory response and necrotic apoptosis has attracted considerable attention. Necrotic apoptosis, also known as programmed necrosis, is an alternative mode of programmed cell death that occurs when the normal apoptotic pathway is inhibited and is similar to and distinct from apoptosis and necrosis. This pathway involves primarily receptor-interacting protein kinase (RIPK) 1, RIPK3, and a mixed-spectrum kinase structural domain-like pseudokinase (MLKL).18 Several stimuli can initiate programmed necrosis, including cytokines, biological factors, viral infections, and chemicals.19 TNF-α is the most commonly identified programmed necrosis cytokine. It may trigger programmed necrosis and is considered a major cytokine in psoriasis pathogenesis. When cells die due to necrotic apoptosis, they release chemical signals that elicit an active inflammatory immune response. Therefore, necrotic apoptosis is believed to play a vital role in inflammatory diseases.
Sequencing technologies and the application of genomic data in diseases have become widespread. Microarray technology has been widely used in biological research, and the data it generates, such as mRNA datasets, are a powerful tool for identifying key factors in disease development.20,21 Therefore, this study aimed to analyze data from gene expression databases (GEO)22 using bioinformatics methods to identify potential biomarkers for psoriasis.
Materials and Methods
The Psoriasis-Related Datasets Were Downloaded from the GEO Database
The GSE13355 and GSE14905 datasets (Supplementary Table 1) were obtained from the GEO database (https://www.ncbi. nlm.nih.gov/geo). GSE13355 included expression profiling data for 122 groups of samples as follows: 64 and 58 from patients in the healthy control group and the psoriatic lesion tissue, respectively. In contrast, GSE14905 included the expression profiles of 82 groups of samples, with 49 cases in the healthy control group and 33 in the psoriasis group.
Differentially Expressed Necrotic Apoptosis-Related Genes in Psoriasis
Differentially expressed genes (DEGs) were further identified in the control and disease groups using the limma package23 (P<0.05, |logFC| >1). We identified 667 necrotic apoptosis-associated genes from the GeneCards database (https://www.genecards.org/). The intersection of DEGs with necrotic apoptosis genes was selected to obtain intersecting genes.
Gene Ontology and Kyoto Encyclopedia of Genes and Genomes Analyses were Used to Analyze their Biological Functions
Gene ontology (GO)24 and Kyoto Encyclopedia of Genes and Genomes (KEGG)25 analyses were performed on DEGs using the Metascape database26 (www.metascape.org). Minimum overlap of ≥3 and P≤0.01 were considered statistically significant.
Identification of Potential Disease Biomarkers
The least absolute shrinkage and selection operator (LASSO) logistic regression and Support Vector Machine (SVM) algorithms were used to identify disease markers; the LASSO algorithm was developed using the “glmnet” software package. SVM recursive feature elimination (SVM-RFE)27 is an SVM-based machine learning method. Receiver operating characteristic (ROC) curves were plotted using the pROC software package, and the area under the curve (AUC) was calculated to determine the predictive value of the key genes. Co-expression between key genes was analyzed using Pearson’s correlation test.
Immune Cell Infiltration Analysis Was Used to Determine the Composition of Immune Cells
Immune infiltration was calculated using the web-based tool Cell-type Identification by Estimating Relative Subsets of RNA Transcripts (CIBERSORT).28 The patient data were analyzed using the CIBERSORT algorithm, which was used to infer the types and relative proportions of the 22 immune-infiltrating cells. A Spearman correlation analysis was performed on the gene expression and immune cell content.
Key Gene Enrichment Analysis to Evaluate Biological Functions
Molecular mechanisms of the core genes in the two groups of patients were explored by comparing the differences in signaling pathways in the high- and low-expression groups using gene set enrichment analysis (GSEA).29 We used the Gene Set Variation Analysis (GSVA) algorithm to score each gene set comprehensively and assess potential biological functional changes across samples. The metabolic pathways were quantified using the single-sample gene set enrichment analysis (ssGSEA) algorithm of the GSVA package and visualized using the heatmap package.
Regulatory Network Analysis of Key Genes to Predict Transcription Factors
Transcription factors (TFs) regulating key genes were predicted using the R package “RcisTarget”. All calculations performed using the RcisTarget were based on motifs. The normalized enrichment score (NES) of a motif depends on the total number of motifs in the database. Additionally, the NES for each motif was calculated based on the distribution of the AUCs for all motifs in the gene set. We set rcistarget.hg19. motifdb. cisbpont 0.500bp for the gene motif ranking database.
Single-Cell Sequencing Analysis
GSE162183 single-cell sequencing data were downloaded from the GEO database for six samples, comprising three controls and three psoriasis cases. First, gene expression profiles were read using the Seurat package to screen out cells with abnormal expression. Subsequently, the gene expression was normalized and subjected to principal component analysis (PCA). The positional relationship between different clusters was investigated using the t-distributed Stochastic Neighborhood Embedding (t-SNE) method.
Sample Collection
Twenty skin lesion tissues of adult patients with psoriasis and healthy control volunteers each were collected from the Department of Dermatology of the Second Affiliated Hospital of Xi’an Jiaotong University (Supplementary Table 2). All participants provided written informed consent. All studies were approved by the Ethics Committee of the Second Affiliated Hospital of Xi’an Jiaotong University (2024 LUN review 008). The study was conducted in accordance with the Declaration of Helsinki.
RNA Isolation and Real-Time Fluorescence Quantitative PCR
Total RNA was extracted using the TRIzol reagent (Kangwei Century; Beijing, China). cDNA was synthesized in an RNA reverse transcription reaction using TransScript® One-Step gDNA Removal and cDNA Synthesis SuperMix (TransGen Biotech; Beijing, China). Next, TransScript® Top Green qPCR SuperMix (TransGen Biotech; Beijing, China) was used for real-time fluorescence-based quantitative PCR (qRT-PCR) detection. Glyceraldehyde 3-phosphate dehydrogenase (GAPDH) was used as an internal reference. All qRT-PCR primer sets are presented in Supplementary Table 3.
Western Blot Assay
After the indicated treatments, cells were collected and washed two times with phosphate-buffered saline (PBS). Subsequently, they were lysed in radioimmunoprecipitation assay (RIPA) cell lysis buffer (Bioworld Technology, Co., Ltd., Nanjing, China) containing protease inhibitors. Protein concentrations were determined using a bicinchoninic acid (BCA) protein quantification kit (Biopped; Beijing, China). Proteins were separated using sodium dodecyl sulfate-polyacrylamide gel electrophoresis (SDS-PAGE) and transferred onto polyvinylidene difluoride (PVDF) membranes. The membranes were blocked using Tris Buffered Saline+Tween-20 (TBST) containing 5% skim milk for 1 h at room temperature, followed by incubation with the primary antibody overnight at 4 °C. The blots were washed three times with TBST and incubated with the secondary antibody for 1 h at room temperature. Finally, the washed membranes were treated with an enhanced chemiluminescence (ECL) reagent and detected in a chemiluminescent apparatus. Anti-PYCARD and ant-GAPDH were the primary antibodies. The secondary antibody was horseradish peroxidase-conjugated goat anti-rabbit Immunoglobulin G (Three Eagles; Wuhan, China). Finally, the protein bands were analyzed using ImageJ software.
Immunohistochemical Staining
Tissue samples were fixed overnight in 4% paraformaldehyde (BioSharp; Hefei, China), wrapped in wax, and sectioned. Baked slices were subjected to gradient deparaffinization. Antigenic repair was performed using a citric acid repair solution. Endogenous peroxidase was blocked using a 3% hydrogen peroxide solution. Subsequently, the sections were incubated with configured primary antibodies overnight at 4 °C. An Sp kit (ZSGB-Bio; Beijing, China) was used to perform the secondary antibody and chromogenic reactions. Finally, the sections were re-stained with hematoxylin and photographed under a microscope (Leica; Germany).
Animal Experimental Validation
Thirty-two male BALB/c mice weighing 18–21 g were purchased from Xi’an Keao Biotechnology Co., Ltd. Animals were housed in a controlled environment at a temperature of 23±2°C with ad libitum access to food and water. The experimental mice were 8–10 weeks old. Thirty-two BALB/c mice were randomly categorized into four groups (n=8 each) as follows: (i) the normal healthy group (PYCARD+/++Vaseline), (ii) the psoriasis group (PYCARD+/++ imiquimod [IMQ]), (iii) group of healthy mice with knockout of PYCARD (PYCARD−/−+Vaseline), and (iv) group of psoriasis mice with PYCARD knockout (PYCARD−/− + IMQ). Mice were administered 5% IMQ cream (62.5 mg) once daily for 7 days to establish a psoriasis-like mouse model; the control group was treated with the same dose of Vaseline. The body weight of the mice and the psoriasis area and severity index (PASI) score (Supplementary Table 4) of the skin on their backs were recorded daily throughout the application of IMQ. After euthanasia, samples of skin, spleen, and lymph node tissues were collected for further experiments. All experimental protocols involving mice followed the Guide for the Care and Use of Laboratory Animals and were approved by the Biomedical Ethics Committee of the Health Science Center of Xi’an Jiaotong University (No. XJTUAE2023-1910).
Statistical Analysis
Bioinformatics statistical analyses were performed using R language (version 4.0). Statistical analyses were performed using GraphPad version 7.0 (GraphPad, La Jolla, CA, USA) and SPSS Statistics for Windows, version 18.0 (SPSS Inc., Chicago, Ill., USA). Results are expressed as mean ± standard deviation. Comparisons between two groups were performed using the t-test; comparisons between multiple groups were performed using one-way analysis of variance. Statistical significance was set at P<0.05.
Results
Identification of Differentially Expressed Genes in Psoriasis
The downloaded datasets included the expression profile data of 204 patients (113 and 91 in the normal and disease groups, respectively). The chips were corrected using the combat algorithm, and PCA plots were used to compare the differences before and after correction (Figure 1A and B). The limma package was further used to calculate the DEGs between the two groups of patients. A total of 729 differential genes were screened (Supplementary Table 5.1), among which 498 and 231 were upregulated and downregulated, respectively (Supplementary Tables 5.2 and S5.3). Figure 1C shows the volcano diagram.
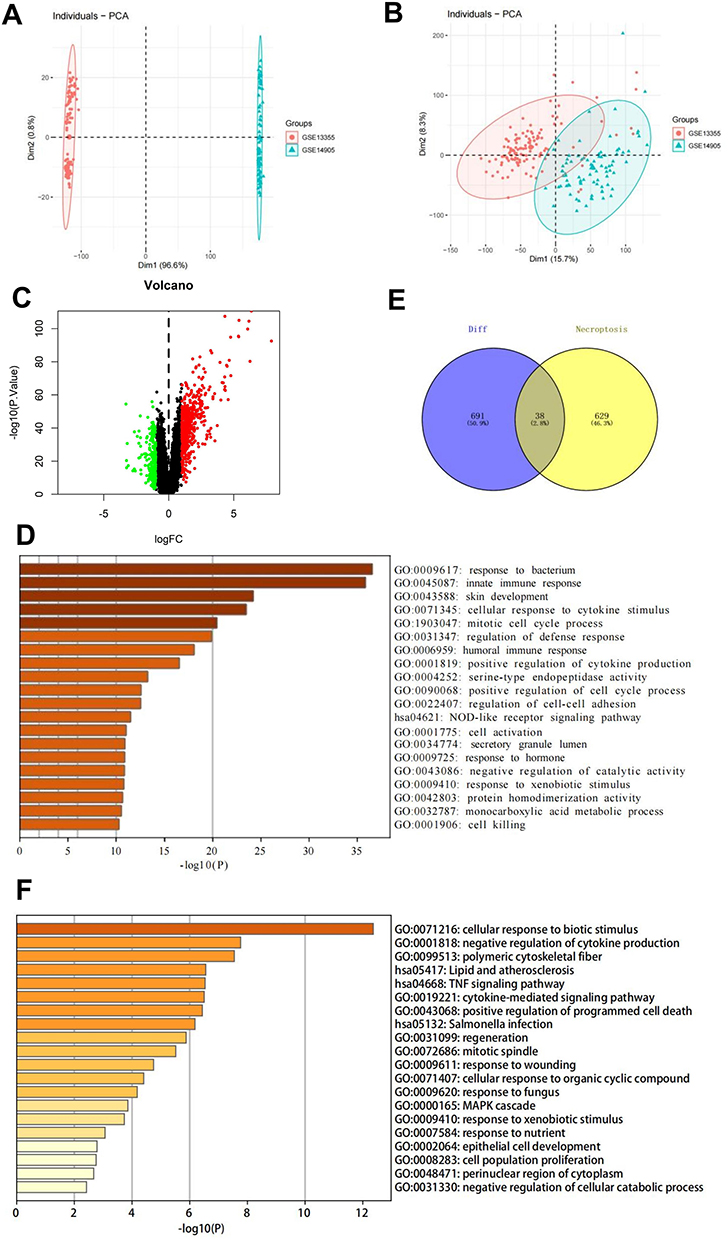 |
Figure 1 Identification and analysis of necrotic apoptotic differential genes in psoriasis. (A and B) PCA plots showing differences in the GSE13355 and GSE14905 datasets before and after correction with the combat algorithm. (C) Volcano plot of DEGs. (D) GO analysis of 729 DEGs in psoriasis. (E) Venn diagram of psoriasis DEGs intersecting with necrotic apoptosis genes. (F) GO analysis of the intersecting genes of psoriasis DEGs and necrotic apoptosis genes. Abbreviations: PCA, principal component analysis; DEGs, differentially expressed genes; GO, Gene Ontology. |
Functional Enrichment Analysis of Psoriasis Differentially Expressed Genes
GO analysis was performed on the 729 psoriasis DEGs to determine their biological functions. The DEGs were enriched mainly for pathways, such as the response to bacteria and innate immune response (Figure 1D).
Functional Enrichment Analysis of Psoriatic Necrotic Apoptosis Differential Genes
The intersection of 729 differential genes with 667 necrotic apoptosis genes was selected to obtain 38 intersecting genes (Supplementary Table 6 and Figure 1E). GO analysis performed on these genes showed their enrichment mainly in the cellular response to biotic stimulus, polymeric cytoskeletal fiber, negative regulation of cytokine production, lipid and atherosclerosis, and TNF signaling pathways (Figure 1F).
Screening for Key Genes
The LASSO regression and SVM feature selection algorithms were used to screen 38 intersecting genes to investigate key genes affecting psoriasis. LASSO regression identified 11 genes as characteristic genes in psoriasis (Figure 2A, B and Supplementary Table 7). These characteristic genes were evaluated using the SVM-RFE algorithm (Supplementary Table 8). Seven intersecting genes were identified by taking the intersection of the top eight feature genes with the lowest error rate and genes identified by the LASSO regression algorithm (Figure 2C and 2D). The seven key genes (AIM2, CARD6, HPSE, MYD88, PYCARD, RAI14, and TNFSF10) were used in subsequent studies. Correlation co-expression circle plots were analyzed for the key genes (Figure 2E). We used the ROC curve to explore the predictive efficacy of key genes; greater AUC values indicated better predictive efficacy. The AUC values of the AIM2, CARD6, HPSE, MYD88, PYCARD, RAI14, and TNFSF10 genes were 0.974 (0.953–0.995), 0.961 (0.936–0.986), 0.995 (0.988–1.000), 0.996 (0.992–1.000), 0.976 (0.953–1.000), 0.987 (0.976–0.998), and 0.947 (0.914–0.980), respectively, suggesting their ability to predict disease development (Figure 3A–G).
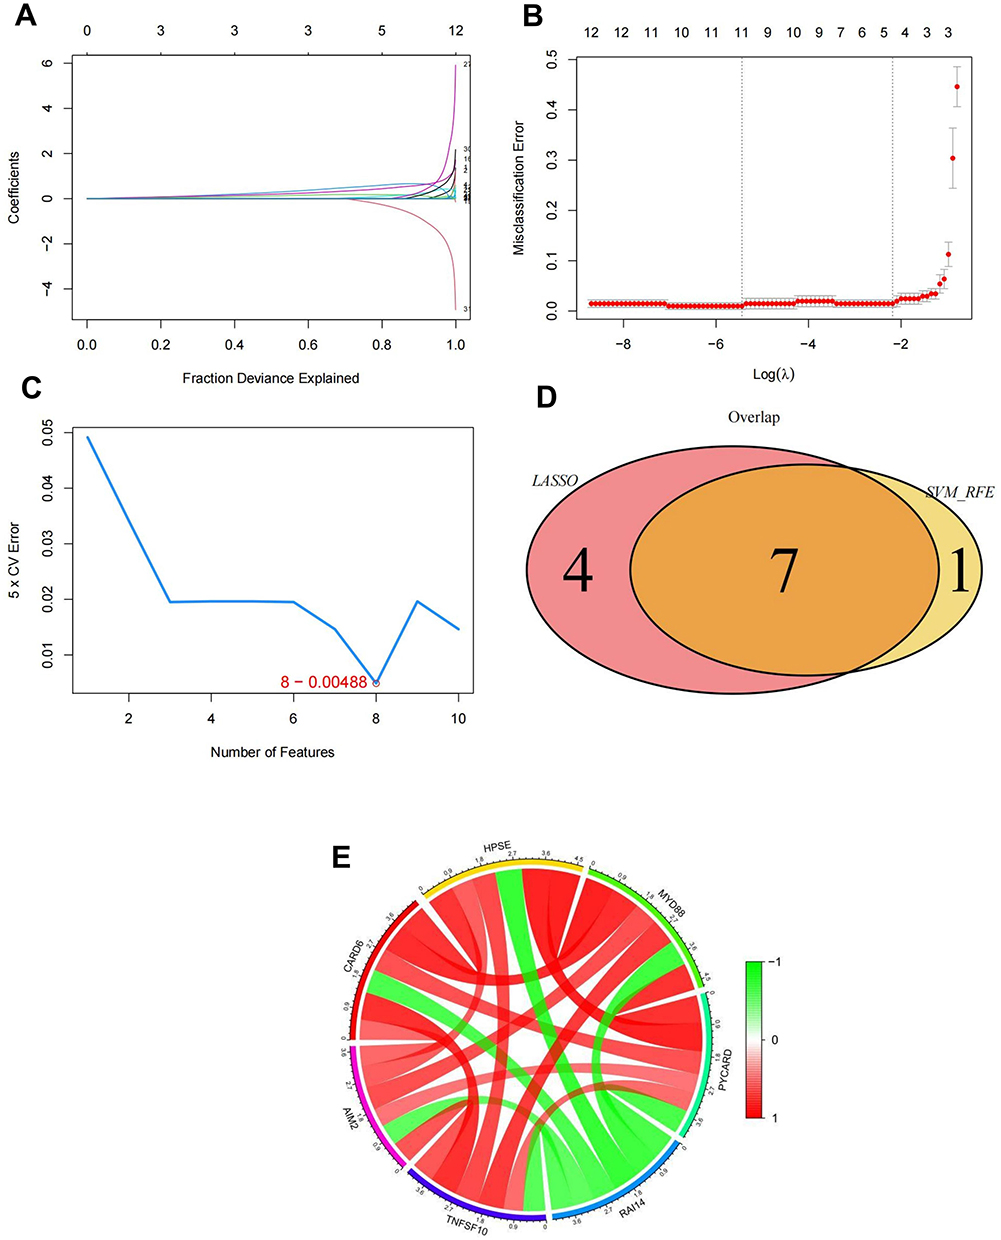 |
Figure 2 Identification of key genes. (A and B) Identification of psoriasis signature genes using LASSO regression. (C) Identification and screening of feature genes using the SVM-RFE algorithm. (D) Wayne diagram of the intersection of feature genes screened using the joint LASSO regression and SVM-RFE algorithms. (E) Relevant co-expression circle diagrams for key genes. Abbreviations: LASSO, least absolute shrinkage and selection operator; SVM-RFE, support vector machine-recursive feature elimination. |
 |
Figure 3 ROC curves for seven key genes. (A) AIM2, (B) CARD6, (C) HPSE, (D) MYD88, (E) PYCARD, (F) RAI14, and (G) TNFSF10. Abbreviation: ROC, receiver operating characteristic. |
Immune Infiltration Analysis
The mechanisms by which key genes influence psoriasis progression were explored by analyzing their relationship with immune infiltration in the disease dataset. Figure 4A shows the immune cell contents of each patient. Multiple correlation pairs were found between immune cell infiltration levels (Figure 4B). The levels of CD8, naive CD4, and activated CD4 memory T cells were significantly greater in samples from the disease group than in those from the normal patient group (Figure 4C). The relationship between key genes and immune cells was explored further, and several key genes were highly correlated with immune cells (Figure 5A–G). Correlations between these key genes and different immune factors, including immunosuppressants, chemokines, immunostimulants, receptors, and major histocompatibility complex (MHC), were obtained from the TISIDB database (Figure 4D). Furthermore, these analyses confirmed that these key genes were closely associated with the amount of immune cell infiltration.
 |
Figure 4 Immune infiltration analysis. (A) Immune cell content of patients. (B) Multiple pairs of significant correlations between immune infiltration levels. (C) Immune cell levels of normal patients and disease group samples. (D) Correlation analysis between key genes and different immune factors. |
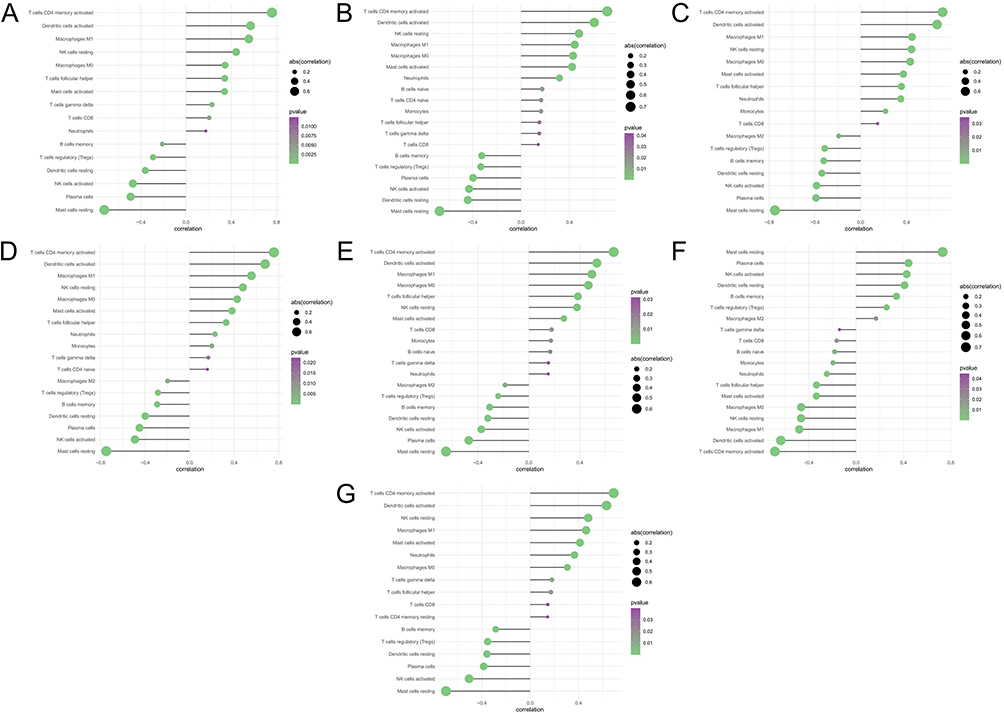 |
Figure 5 Correlation analysis of key genes and immune cells. (A) AIM2, (B) CARD6, (C) HPSE, (D) MYD88, (E) PYCARD, (F) RAI14, and (G) TNFSF10. |
Enrichment Analysis of Key Genes
The specific signaling pathways in which the seven key genes were enriched were investigated to explore how they affect the progression of psoriasis. Figure 6A–G and 7A–G show the GSEA and GSVA results, respectively.
 |
Figure 6 GSEA analysis of key genes. (A) AIM2, (B) CARD6, (C) HPSE, (D) MYD88, (E) PYCARD, (F) RAI14, and (G) TNFSF10. Abbreviation: GSEA, gene set enrichment analysis. |
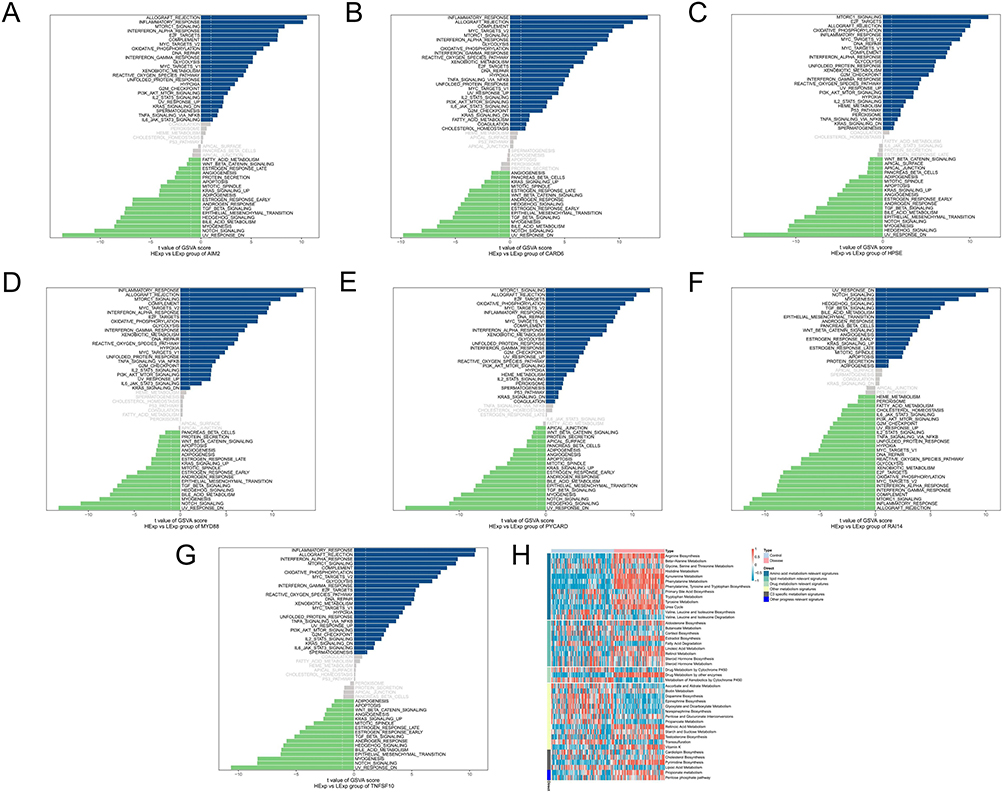 |
Figure 7 GSVA analysis of key genes. (A) AIM2, (B) CARD6, (C) HPSE, (D) MYD88, (E) PYCARD, (F) RAI14, (G) TNFSF10 and (H) metabolic pathway heat map. Abbreviation: GSVA, gene set variation analysis. |
Data from all samples were analyzed using the ssGSEA algorithm, which infers the relative proportions of metabolic pathway cells to derive the metabolic pathway content of the patients. In the metabolic pathway heatmap, the disease samples exhibited higher scores than the control samples for the classifications, such as amino acid metabolism relevant signatures (Figure 7H).
Transcription Factor Analysis of Key Genes
The set of seven key genes was regulated by common mechanisms, including multiple TFs. Enrichment analysis of these TFs was performed using cumulative recovery curves (Figure 8A). The motif-TF annotation and selection analysis of the important genes showed that the motif with the highest NES (6.29) was cisbp__M3990; three genes (AIM2, CARD6, and RAI14) were enriched in this motif. One motif with a similarly high NES (6.22) was cisbp__M3985, and five genes (AIM2, CARD6, MYD88, PYCARD, and RAI14) were enriched in this motif. The motifs with which the key genes were enriched and the corresponding TFs were also identified (Figure 8B). The seven key genes were back-predicted using the miRcode database to obtain 81 miRNAs (Supplementary Table 9) and 235 mRNA–miRNA relationship pairs and visualized using Cytoscape (Figure 8C).
 |
Figure 8 Transcription factor analysis of key genes. (A) Cumulative recovery curves were analyzed for the enrichment of transcription factors regulating key genes. (B) Presentation of motifs and corresponding transcription factors enriched for key genes. (C) Visualization of mRNA–miRNA relationship pairs. |
Single-Cell Sequencing Analysis
We used the t-SNE method to study the positional relationships between different clusters, and the results are shown in Figure 9A. To add annotations to the clusters, we used the annotation file that comes with the celldex package to annotate cell subtypes. This annotation labeled each cluster as a cell type closely related to disease formation. Analysis of the expression of key genes in single cells showed that PYCARD was significantly expressed in keratinocytes, and CARD6, RAI14, and TNFSF10 were significantly expressed in endothelial cells (Figure 9B).
 |
Figure 9 Single-cell sequencing analysis. (A) The t-SNE method to study the positional relationship among different clusters. (B) The expression of key genes in single cells. Abbreviation: t-SNE, t-distributed stochastic neighbor embedding. |
Dataset Validation for Key Genes
The study obtained 4284 psoriasis-associated disease genes from the GeneCards database (https://www.genecards.org/). Analysis of the intergroup differences in disease gene expression showed that AP1S3, CARD14, CDSN, and HLA-C differed between the two patient groups (Figure 10A). Analysis of the levels of the seven key genes and the expression levels of the top 20 genes in the relevance score showed that the seven genes correlated with the expression of several disease-related genes (Figure 10B). Specifically, PYCARD correlated positively with the disease-associated gene CARD14 (r=0.79) (Figure 10C).
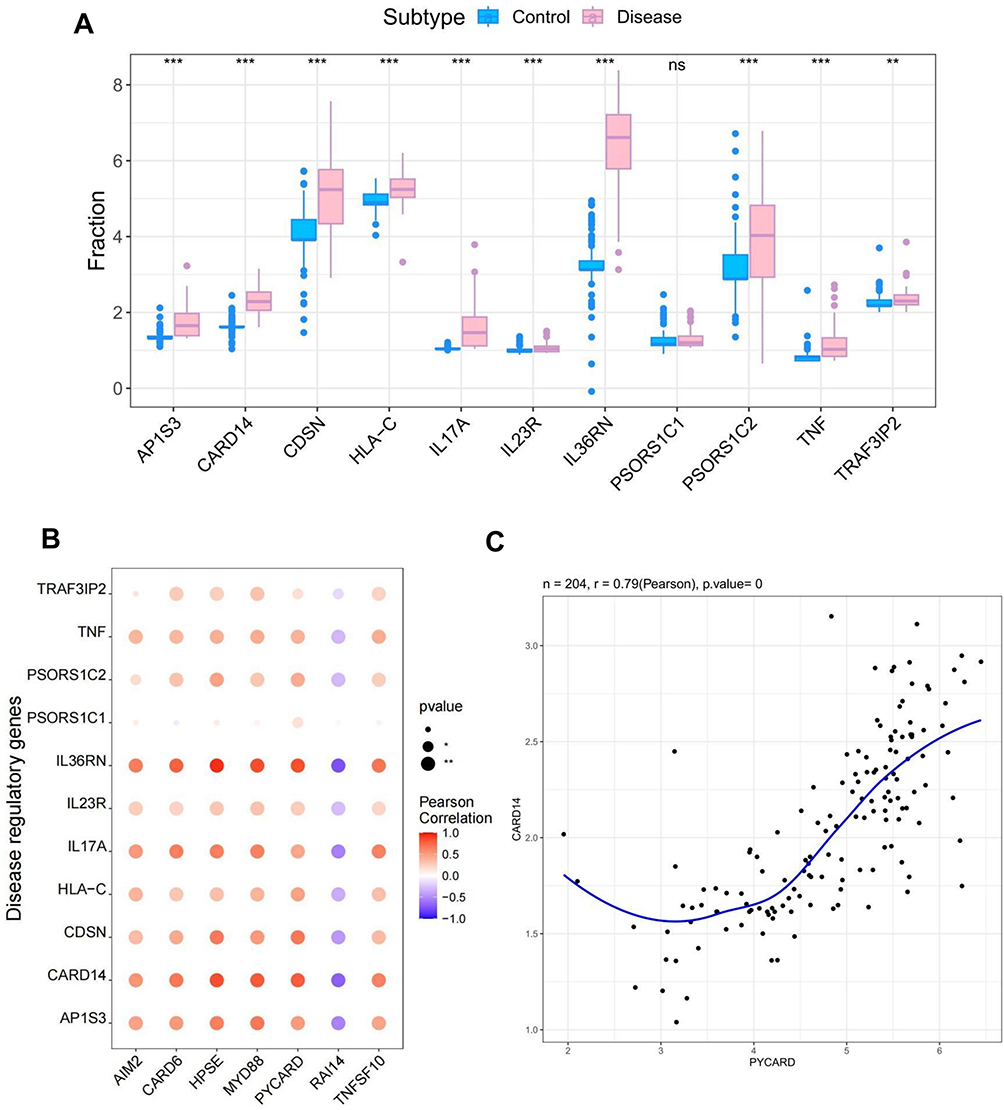 |
Figure 10 Dataset validation of key genes. (A) Analysis of intergroup expression differences of disease genes in the dataset. (B) Correlation analysis of the expression levels of key genes and disease-related genes. (C) Correlation analysis of the key gene PYCARD and the disease-related gene CARD14. *P< 0.05. |
The PYCARD Gene is Highly Expressed in Patients with Psoriasis
The expression of the seven DEGs in patients with psoriasis was compared using qRT-PCR to detect the mRNA of AIM2, CARD6, HPSE, MYD88, RAI14, TNFSF10, and PYCARD in the tissues from 20 patients with psoriasis and 20 healthy controls. PYCARD had the most significant increase in expression compared to the other six DEGs in patients with psoriasis as opposed to the control group (Figure 11A). After reviewing the relevant literature and combining the raw letter analysis and qRT-PCR results, PYCARD was selected for further analysis. Western blot was used to analyze the protein levels of PYCARD; the levels were significantly greater in the skin lesion tissues of the psoriasis group than in the healthy control group (Figure 11B). Immunohistochemical analysis was performed on the tissues of the patients with psoriasis and healthy controls to clarify the expression of PYCARD in the skin lesion tissues of patients with psoriasis. The protein levels of PYCARD were significantly greater in patients with psoriasis than in the healthy control group (Figure 11C).
 |
Figure 11 Key gene expression analysis. (A) qRT-PCR to detect the expression levels of key genes in patients with psoriasis and healthy control tissues. (B) Western blot analysis of key gene PYCARD expression level. (C) Immunohistochemistry showed that the key gene PYCARD was highly expressed in the tissues of patients with psoriasis. *P< 0.05, **P< 0.01. Abbreviations: qRT-PCR, quantitative reverse transcription polymerase chain reaction; CON, control; PSO, psoriasis; N.S, no significance. |
In vivo Expression of the PYCARD Gene and Validation in Animal Experiments
A mouse model of psoriasis was established by administering 5% IMQ cream to mice and knocking down the PYCARD gene to investigate the PYCARD gene’s role in the development of psoriasis. The groups were (i) PYCARD+/++Vaseline, (ii) PYCARD+/++IMQ, (iii) PYCARD−/−+Vaseline, and (iv) PYCARD−/−+IMQ groups. The qRT-PCR analysis of PYCARD mRNA levels in the skin biopsies of mice in the four groups showed that PYCARD mRNA levels were significantly elevated in mouse skin biopsies after IMQ treatment compared to the PYCARD+/++Vaseline group. Whereas, knockdown of PYCARD significantly inhibited the expression of PYCARD (Figure 12A). Observation of the dorsal skin lesions of mice in each group showed that compared with the PYCARD+/++Vaseline group, mice in the PYCARD+/++IMQ group showed obvious skin lesions on day 2, which gradually aggravated and reached a peak on days 6–7. Typical erythema and scales appeared on the dorsal side on day 8, accompanied by obvious thickening of the epidermis and a significant increase in the PASI scores of the skin lesions. Furthermore, knocking down PYCARD in addition to the mice with psoriasis significantly improved the skin lesion quality. Knockdown of PYCARD in mice with psoriasis significantly improved the symptoms of skin lesions, alleviated erythema and scaling, and attenuated the degree of infiltration. However, the knockdown of PYCARD in healthy mice had no significant effect on the skin condition (Figure 12B). We dynamically detected the body weight of mice in each group in real time to exclude the interference of other factors. (Figure 12C). Therefore, these results suggest that PYCARD knockdown significantly improves skin lesion symptoms in mice with psoriasis.
 |
Figure 12 Validation of animal model. (A) mRNA levels of PYCARD in mouse skin biopsy tissues. (B) Dynamic changes in dorsal skin lesion manifestations and PASI scores in each group of mice. (C) Body weight of mice in each group. (D) Hematoxylin-eosin staining of the epidermis of mice in each group. *P< 0.05. Abbreviations: PASI, Psoriasis area and severity index; N.S, no significance. |
We initiated a tissue-level study to further investigate the effects of PYCARD on the development of psoriasis. H&E staining of the epidermis of the four groups of imiquimod-induced psoriasis mice revealed hyperkeratosis with parakeratosis, hypertrophic spinous layer, prolonged epidermal processes, vascular dilatation and congestion and inflammatory cell infiltration in the dermis. Knockdown of PYCARD significantly reduced epidermal thickening and hyperkeratosis, and reduced rete’s ridge-like structures extending into the dermis in psoriatic mice (Figure 12D). Immunohistochemistry showed that the number of Ki-67 and keratin 14, 16, and 17 positive cells in the skin lesions of mice was reduced in the PYCARD−/−+IMQ group compared with the PYCARD+/++IMQ group (Figure 13A). These results suggest that PYCARD expression in skin lesion tissues of mice with psoriasis contributes to the hyperproliferation of keratin-forming cells.
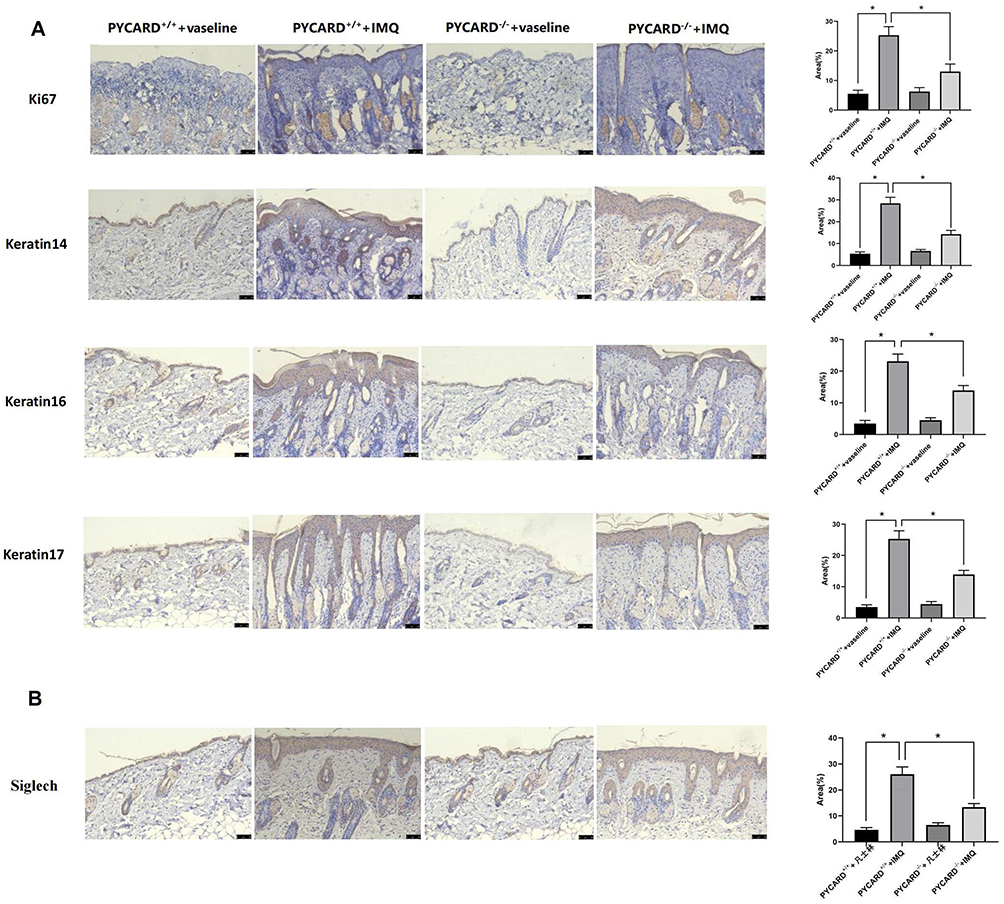 |
Figure 13 Animal experiment validation. (A) Immunohistochemistry was used to analyze the degree of cell proliferation and keratin expression in the epidermis of the four groups of mice. (B) Siglech expression was detected by immunohistochemistry. *P< 0.05. |
Given that psoriasis is a chronic inflammatory skin disease, we explored the effect of PYCARD on inflammatory cell infiltration in mice with psoriasis. Immunohistochemical detection of the dendritic cell marker Siglec H in the mouse epidermis revealed that mice in the PYCARD knockout group had significantly less infiltration of plasma cell-like dendritic cells than those in the psoriasis group (Figure 13B). The proportions of dendritic (CD207+CD103+ migratory dendritic cells), Langerhans, Th1, and Th17 cells in the PYCARD−/−+IMQ group were significantly lower than those in the PYCARD+/++IMQ group according to flow cytometry (Figure 14A). Additionally, the mRNA levels of inflammatory cytokines measured using the qRT-PCR showed that proinflammatory factors IL-12A, IL-23, and interferon‐gamma were reduced in mice in the PYCARD−/−+IMQ group (Figure 14B). Therefore, PYCARD knockdown significantly suppressed inflammation in mice with psoriasis.
 |
Figure 14 Validation of animal experiments. (A) Flow cytometry to detect inflammatory cell expression (They were dendritic cells (CD207+CD103+ migratory dendritic cells), Langerhans cells (LCs), Th1, and Th17 cells, respectively). (B) qRT-PCR to detect inflammatory cytokine expression. *P< 0.05, **P< 0.01, ***P< 0.001. Abbreviation: qRT-PCR, quantitative reverse transcription polymerase chain reaction. |
Collectively, these results suggest that the PYCARD gene may play an important role in the pathogenesis of imiquimod-driven skin inflammation in mice.
Discussion
Psoriasis is a chronic inflammatory disease with high morbidity that causes significant mental and physical stress and pain to patients because of its recurrent episodes, prolonged delay, and long treatment cycle, leading to depression, anxiety, and uneasiness in some patients, which severely affects patients’ standard of living.30 Before the use of biologics, the traditional treatment of psoriasis was poorly effective, with a long treatment cycle and poor therapeutic effect, causing patients to lose confidence in treatment. The emergence of psoriasis biologics is undoubtedly a boon, largely relieving patients’ pain, although prolonged use can lead to immunosuppression and infections.31 Mitigating and avoiding relapses more effectively remains a global challenge due to many unknowns in the mechanism of psoriasis. Necrotic apoptosis, also known as programmed necrosis, is a regulated mode of necrotic cell death.32 Since necrotic apoptosis shows great research potential in inflammatory skin diseases, we attempted to identify and validate potential key necrotic apoptosis-associated genes in psoriasis using a bioinformatics approach to provide new perspectives on the pathogenesis and treatment of psoriasis.
We identified 729 DEGs from the RNA expression profiles of patients with psoriasis. Pathway analyses of these DEGs showed they were enriched mainly in response to bacteria, innate immune responses, and other pathways. Therefore, we selected the intersection of these 729 differential genes with 667 necrotic apoptosis genes to obtain 38 intersecting genes and analyzed their functions. Psoriatic necrotic apoptosis genes were involved mainly in the cellular response to biotic stimuli, negative regulation of cytokine production, polymeric cytoskeletal fiber, lipid and atherosclerosis, the TNF signaling pathway, and other pathways. Most of these pathways have been implicated in psoriasis pathogenesis, particularly the TNF signaling pathway, which is important in the development of psoriasis. Seven key genes were identified using a combination of LASSO regression and SVM feature selection algorithms as follows: AIM2, CARD6, HPSE, MYD88, PYCARD, RAI14, and TNFSF10. GSEA revealed that these key genes were involved mainly in inflammatory pathways. Therefore, these results suggest that psoriatic necrotic apoptosis genes are important in the inflammatory response.
Most of these seven key genes were associated with inflammatory responses. AIM2 and MYD88 play important roles in the development of psoriasis.33–36 However, the relationship between the remaining key genes and the development of psoriasis has not yet garnered numerous relevant reports, which may provide clues for new therapeutic targets for psoriasis. Therefore, we performed an immune cell infiltration analysis to explore the relationship between key genes and immune cells and the dysregulation of inflammatory cells in psoriasis. Psoriatic inflammatory cells involve mainly dendritic cells, macrophages, neutrophils, and T cells.37 For immune infiltration, AIM2, CARD6, HPSE, MYD88, PYCARD, and TNFSF10 correlated positively with activated CD4 memory T and dendritic cells, suggesting that they are associated with the psoriasis inflammatory response and may be pivotal in psoriasis immunomodulation. We also performed an enrichment analysis of multiple TFs regulated by these seven key genes with motif-TF annotation, showing that the motif with the highest NES was cisbp__M3990. The following three genes were enriched in this motif: AIM2, CARD6, and RAI14. In contrast, the motif with similarly high NES (6.22) was cisbp__M3985, in which five genes were enriched as follows: AIM2, CARD6, MYD88, PYCARD, and RAI14. The expression levels of these seven genes and several disease-related genes were significantly correlated. Furthermore, we found that PYCARD was significantly expressed in keratinocytes, and CARD6, RAI14, and TNFSF10 were significantly expressed in endothelial cells according to the single-cell sequencing analysis.
Combining bioinformatics and literature review, we selected PYCARD for further analysis due to several reasons. First, we found multiple psoriasis-related genes through dataset validation, and the expression levels of PYCARD were significantly correlated with those of these disease-related genes. Second, qRT-PCR of the tissues of patients with psoriasis compared to those of healthy control revealed that PYCARD showed the most significant increase in expression in patients with psoriasis compared to the other six DEGs. Third, PYCARD was found to be significantly expressed in keratinocytes via single-cell sequencing, which is one of the main features of psoriasis. Finally, a review of the relevant literature revealed that the role of PYCARD in psoriasis has not been extensively reported, suggesting that PYCARD may be a relatively new potential biomarker.
Examination of the tissues of patients with psoriasis and those of healthy controls using qRT-PCR, Western blot, and immunohistochemistry confirmed that PYCARD was highly expressed in the skin lesion tissues of patients with psoriasis. Establishing an IMQ-induced mouse model and conducting related studies showed that the knockdown of PYCARD improved skin lesion symptoms and attenuated the inflammatory response in mice with IMQ-induced psoriasis. Therefore, this finding suggests that PYCARD is important in the pathogenesis of psoriasis, aggravating the inflammatory response.
PYCARD, also known as ASC, encodes an articulating protein containing two protein–protein interacting structural domains (the n-terminal PYD structural domain and the c-terminal CARD structural domain) and is a key articulating protein for the activation of inflammatory vesicles.38 In normal cells, this protein is localized in the cytoplasm; however, it forms globular aggregates close to the nuclear periphery in cells undergoing apoptosis. ASC is a key protein in the NLRP3 inflammasome,39 which activates cysteine aspartate protease 1 (caspase 1) through the formation of inflammasomes after cellular stimuli (such as viruses and stress). Furthermore, protease 1 (caspase 1) induces the release of proinflammatory cytokines, generating an inflammatory response and inducing apoptosis.38,40–42
The development of psoriasis is closely associated with inflammatory responses. In this study, we identified PYCARD as a potential biomarker of psoriasis. The role of NLRP3 inflammatory vesicles in psoriasis, an autoinflammatory skin disease, has attracted significant attention; NLRP3 is suggested to play a key role in the pathogenesis of psoriasis.43 Cycloastragaloestradiol can inhibit inflammation in psoriasis by suppressing NLRP3-mediated macrophage pyroptosis.41 PYCARD is a potential biomarker for the development of psoriasis and has been validated by gene expression analysis and the establishment of animal models.44 PYCARD expression is upregulated in the epidermis of psoriasis.40,41 PYCARD also plays an important role in other inflammatory diseases. Furthermore, NLRP3 inhibitors block inflammatory vesicle activation and effectively attenuate dyskinesia, nigrostriatal dopaminergic degeneration, and accumulation of α-synuclein aggregates in Parkinson’s disease.45
Psoriasis is a chronic immune-inflammatory skin disease with high incidence, and its etiology and pathogenesis remain unclear. Recent research continues to explore new biomarkers of psoriasis. Studies have suggested that the genes associated with iron metabolism can be used as potential biomarkers in patients with psoriasis.46–48 Lu et al, through bioinformatics analysis, have demonstrated the role of apoptosis-related genes in psoriasis and identified the hub genes.49 Other studies have also highlighted the diagnostic value of autophagy genes in psoriasis.50,51 These advances provide a new perspective on the pathogenesis and management of psoriasis. Unlike previous studies, this study comprehensively analyzed the DEGs in psoriasis and necroptosis-related genes and identified a new key gene, PYCARD, through clinical samples and animal experiments. PYCARD, as a critical gene encoding inflammasomes, also plays a role in immune inflammation. Recent studies have shown that the apoptosis-related gene PYCARD is a potential biomarker for diagnosing and treating the inflammatory disease COPD.52 Su et al demonstrated that PYCARD may serve as a diagnostic and therapeutic biomarker for targeted enhancement of immunotherapy response.53 These studies also confirmed the close relationship between PYCARD, immune response, and inflammatory response. To the best of our knowledge, our study is the first to demonstrate the critical role of the necroptosis-related gene PYCARD in the pathogenesis of psoriasis.
While this research offers valuable insights into potential novel biomarkers of psoriasis, some limitations are important to acknowledge. First, differences between animal models and humans still exist; therefore, more clinical information and experimental validation are needed to verify the key genes. Second, this study preliminarily analyzed and verified the role of PYCARD in the development of psoriasis; however, further experiments are needed to elucidate its specific molecular mechanism.
Conclusion
Bioinformatics was used to identify seven key genes that are mostly associated with necrotic apoptosis and inflammatory responses in psoriasis as follows: AIM2, CARD6, HPSE, MYD88, PYCARD, RAI14, and TNFSF10. PYCARD was selected for further studies, and the result showed that it may be important in psoriasis pathogenesis. Therefore, PYCARD may be a key biomarker for the development of psoriasis. This study provides new perspectives on the pathogenesis and therapeutic options for psoriasis.
Abbreviations
TNF-α, tumor necrosis factor-alpha; IL, interleukin; AIM2, absent in melanoma 2; ASC, apoptosis-associated speck-like protein; AUC, area under the curve; DEGs, differentially expressed genes; GAPDH, glyceraldehyde 3-phosphate dehydrogenase; GEO, gene expression database; GO, Gene ontology; GSEA, gene set enrichment analysis; GSVA, Gene Set Variation Analysis; IMQ, imiquimod; KEGG, Kyoto Encyclopedia of Genes and Genomes; LASSO, least absolute shrinkage and selection operator; NES, normalized enrichment score; NLRP, NOD-like receptor protein; PASI, Psoriasis area and severity index; PCA, principal component analysis; qRT-PCR, real-time fluorescence-based quantitative PCR; ROC, receiver operating characteristic; ssGSEA, single-sample gene set enrichment analysis; SVM, Support Vector Machine; SVM-RFE, Support Vector Machine recursive feature elimination; TBST, Tris Buffered Saline+Tween-20; TFs, transcription factors; t-SNE, t-distributed Stochastic Neighborhood Embedding.
Data Sharing Statement
The data mentioned in the study can be downloaded from the GEO database. GSE13355, GSE14905. Further inquiries can be directed to the corresponding author.
Ethics Statement and Informed Consent
All studies were approved by the Ethics Committee of the Second Affiliated Hospital of Xi’an Jiaotong University (2024 LUN review 008). Written informed consent was obtained from the individual(s)’ and minor(s)’ legal guardian/next of kin to publish any potentially identifiable images or data in this article. All experimental protocols involving mice followed the Guide for the Care and Use of Laboratory Animals and were approved by the Biomedical Ethics Committee of the Health Science Center of Xi’an Jiaotong University (No. XJTUAE2023-1910).
Author Contributions
All authors made a significant contribution to the work reported, whether that is in the conception, study design, execution, acquisition of data, analysis, and interpretation, or in all these areas; took part in drafting, revising, or critically reviewing the article; gave final approval of the version to be published; have agreed on the journal to which the article has been submitted; and agree to be accountable for all aspects of the work.
Funding
This study was supported by the Shaanxi Province Natural Science Basic Research Program (grant no. 2024JC-YBMS-632).
Disclosure
The authors report no conflicts of interest in this work.
References
1. Adamski Z, Kanabaj K, Kuźniak A. The link between psoriasis and other diseases based on epidemiological and genetic analyses. Postepy Dermatol Alergol. 2023;40(4):496–503. doi:10.5114/ada.2023.130518
2. Damiani G, Radaeli A, Olivini A, Calvara-Pinton P, Malerba M. Increased airway inflammation in patients with psoriasis. Br J Dermatol. 2016;175(4):797–799. doi:10.1111/bjd.14546
3. Buja A, Miatton A, Cozzolino C, et al. The prevalent Comorbidome at the onset of psoriasis diagnosis. Dermatol Ther. 2023;13(9):2093–2105. doi:10.1007/s13555-023-00986-0
4. Damiani G, Bragazzi NL, Karimkhani Aksut C, et al. The global, regional, and national burden of psoriasis: results and insights from the global burden of disease 2019 study. Front Med. 2021;8:743180. doi:10.3389/fmed.2021.743180
5. van de Kerkhof PC. From empirical to pathogenesis-based treatments for psoriasis. J Invest Dermatol. 2022;142(7):1778–1785. doi:10.1016/j.jid.2022.01.014
6. Korman NJ. Management of psoriasis as a systemic disease: what is the evidence? Br J Dermatol. 2020;182(4):840–848. doi:10.1111/bjd.18245
7. Griffiths CE, Barker JN. Pathogenesis and clinical features of psoriasis. Lancet. 2007;370(9583):263–271. doi:10.1016/S0140-6736(07)61128-3
8. Di Meglio P, Villanova F, Nestle FO. Psoriasis. Cold Spring Harb Perspect Med. 2014;4(8):a015354. doi:10.1101/cshperspect.a015354
9. Harden JL, Krueger JG, Bowcock AM. The immunogenetics of Psoriasis: a comprehensive review. J Autoimmun. 2015;64:66–73. doi:10.1016/j.jaut.2015.07.008
10. Afonina IS, Van Nuffel E, Beyaert R. Immune responses and therapeutic options in psoriasis. Cell Mol Life Sci. 2021;78(6):2709–2727. doi:10.1007/s00018-020-03726-1
11. Petit RG, Cano A, Ortiz A, et al. Psoriasis: from pathogenesis to pharmacological and nano-technological-based therapeutics. Int J Mol Sci. 2021;22(9):4983. doi:10.3390/ijms22094983
12. Tokuyama M, Mabuchi T. New treatment addressing the pathogenesis of psoriasis. Int J Mol Sci. 2020;21(20):7488. doi:10.3390/ijms21207488
13. Sato Y, Ogawa E, Okuyama R. Role of innate immune cells in psoriasis. Int J Mol Sci. 2020;21(18):6604. doi:10.3390/ijms21186604
14. Jiang W, Zhu FG, Bhagat L, et al. A toll-like receptor 7, 8, and 9 antagonist inhibits Th1 and Th17 responses and inflammasome activation in a model of IL-23-induced psoriasis. J Invest Dermatol. 2013;133(7):1777–1784. doi:10.1038/jid.2013.57
15. Ciążyńska M, Olejniczak-Staruch I, Sobolewska-Sztychny D, Narbutt J, Skibińska M, Lesiak A. The role of NLRP1, NLRP3, and AIM2 Inflammasomes in psoriasis: review: review. Int J Mol Sci. 2021;22(11):5898. doi:10.3390/ijms22115898
16. Wang L, Hauenstein AV. The NLRP3 inflammasome: mechanism of action, role in disease and therapies. Mol Aspects Med. 2020;76:100889. doi:10.1016/j.mam.2020.100889
17. Shao BZ, Xu ZQ, Han BZ, Su DF, Liu C. NLRP3 inflammasome and its inhibitors: a review. Front Pharmacol. 2015;6:262. doi:10.3389/fphar.2015.00262
18. Duan X, Liu X, Liu N, et al. Inhibition of keratinocyte necroptosis mediated by RIPK1/RIPK3/MLKL provides a protective effect against psoriatic inflammation. Cell Death Dis. 2020;11(2):134. doi:10.1038/s41419-020-2328-0
19. Vanlangenakker N, Vanden Berghe T, Vandenabeele P. Many stimuli pull the necrotic trigger, an overview. Cell Death Differ. 2012;19(1):75–86. doi:10.1038/cdd.2011.164
20. Cortés-Ciriano I, Gulhan DC, Lee JJK, Melloni GEM, Park PJ. Computational analysis of cancer genome sequencing data. Nat Rev Genet. 2022;23(5):298–314. doi:10.1038/s41576-021-00431-y
21. Abbott TR, Dhamdhere G, Liu Y, et al. Development of CRISPR as an antiviral strategy to combat SARS-CoV-2 and influenza. Cell. 2020;181(4):865–876.e12. doi:10.1016/j.cell.2020.04.020
22. Clough E, Barrett T. The gene expression omnibus database. Methods Mol Biol. 2016;1418:93–110. doi:10.1007/978-1-4939-3578-9_5
23. Ritchie ME, Phipson B, Wu D, et al. limma powers differential expression analyses for RNA-sequencing and microarray studies. Nucleic Acids Res. 2015;43(7):e47. doi:10.1093/nar/gkv007
24. The Gene Ontology Consortium. Expansion of the Gene Ontology knowledgebase and resources. Nucleic Acids Res. 2017;45(D1):D331–D338. doi:10.1093/nar/gkw1108
25. Kanehisa M, Goto S. KEGG: Kyoto encyclopedia of genes and genomes. Nucleic Acids Res. 2000;28(1):27–30. doi:10.1093/nar/28.1.27
26. Zhou Y, Zhou B, Pache L, et al. Metascape provides a biologist-oriented resource for the analysis of systems-level datasets. Nat Commun. 2019;10(1):1523. doi:10.1038/s41467-019-09234-6
27. Huang ML, Hung YH, Lee WM, Li RK, Jiang BR. SVM-RFE based feature selection and Taguchi parameters optimization for multiclass SVM classifier. ScientificWorldJournal. 2014;2014:795624. doi:10.1155/2014/795624
28. Chen B, Khodadoust MS, Liu CL, Newman AM, Alizadeh AA. Profiling tumor infiltrating immune cells with cibersort. Methods Mol Biol. 2018;1711:243–259. doi:10.1007/978-1-4939-7493-1_12
29. Subramanian A, Tamayo P, Mootha VK, et al. Gene set enrichment analysis: a knowledge-based approach for interpreting genome-wide expression profiles. Proc Natl Acad Sci U S A. 2005;102(43):15545–15550. doi:10.1073/pnas.0506580102
30. Stern RS, Nijsten T, Feldman SR, Margolis DJ, Rolstad T. Psoriasis is common, carries a substantial burden even when not extensive, and is associated with widespread treatment dissatisfaction. J Investig Dermatol Symp Proc. 2004;9(2):136–139. doi:10.1046/j.1087-0024.2003.09102.x
31. Reid C, Griffiths CEM. Psoriasis and treatment: past, present and future aspects. Acta Derm Venereol. 2020;100(3):adv00032. doi:10.2340/00015555-3386
32. Degterev A, Huang Z, Boyce M, et al. Chemical inhibitor of nonapoptotic cell death with therapeutic potential for ischemic brain injury. Nat Chem Biol. 2005;1(2):112–119. doi:10.1038/nchembio711
33. Zhang Y, Xu X, Cheng H, Zhou F. AIM2 and psoriasis. Front Immunol. 2023;14:1085448. doi:10.3389/fimmu.2023.1085448
34. Wang J, Gao J, Huang C, et al. Roles of AIM2 gene and AIM2 inflammasome in the pathogenesis and treatment of psoriasis. Front Genet. 2022;13:929162. doi:10.3389/fgene.2022.929162
35. Callahan JA, Hammer GE, Agelides A, et al. Cutting edge: ABIN-1 protects against psoriasis by restricting MyD88 signals in dendritic cells. J Immunol. 2013;191(2):535–539. doi:10.4049/jimmunol.1203335
36. Rabeony H, Pohin M, Vasseur P, et al. IMQ-induced skin inflammation in mice is dependent on IL-1R1 and MyD88 signaling but independent of the NLRP3 inflammasome. Eur J Immunol. 2015;45(10):2847–2857. doi:10.1002/eji.201445215
37. Grän F, Kerstan A, Serfling E, Goebeler M, Muhammad K. Current developments in the immunology of psoriasis. Yale J Biol Med. 2020;93(1):97–110. doi:10.1038/jid.2012.339
38. Taniguchi S, Sagara J. Regulatory molecules involved in inflammasome formation with special reference to a key mediator protein, ASC. Semin Immunopathol. 2007;29(3):231–238. doi:10.1007/s00281-007-0082-3
39. Schroder K, Tschopp J. The inflammasomes. Cell. 2010;140(6):821–832. doi:10.1016/j.cell.2010.01.040
40. Salskov-Iversen ML, Johansen C, Kragballe K, Iversen L. Caspase-5 expression is upregulated in lesional psoriatic skin. J Invest Dermatol. 2011;131(3):670–676. doi:10.1038/jid.2010.370
41. Tervaniemi MH, Katayama S, Skoog T, et al. NOD-like receptor signaling and inflammasome-related pathways are highlighted in psoriatic epidermis. Sci Rep. 2016;6(1):22745. doi:10.1038/srep22745
42. García-Heredia JM, Carnero A. The cargo protein MAP17 (PDZK1IP1) regulates the immune microenvironment. Oncotarget. 2017;8(58):98580–98597. doi:10.18632/oncotarget.21651
43. Shahi A, Afzali S, Amirzargar A, Mohaghegh P, Salehi S, Mansoori Y. Potential roles of inflammasomes in the pathophysiology of Psoriasis: a comprehensive review. Mol Immunol. 2023;161:44–60. doi:10.1016/j.molimm.2023.06.007
44. Deng G, Chen W, Wang P, et al. Inhibition of NLRP3 inflammasome-mediated pyroptosis in macrophage by cycloastragenol contributes to amelioration of imiquimod-induced psoriasis-like skin inflammation in mice. Int Immunopharmacol. 2019;74:105682. doi:10.1016/j.intimp.2019.105682
45. Gordon R, Albornoz EA, Christie DC, et al. Inflammasome inhibition prevents α-synuclein pathology and dopaminergic neurodegeneration in mice. Sci Transl Med. 2018;10(465):eaah4066. doi:10.1126/scitranslmed.aah4066
46. Wu MN, Zhou DM, Jiang CY, et al. Genetic analysis of potential biomarkers and therapeutic targets in ferroptosis from psoriasis. Front Immunol. 2023;13:1104462. doi:10.3389/fimmu.2022.1104462
47. Zhang D, Li Y, Du C, et al. Evidence of pyroptosis and ferroptosis extensively involved in autoimmune diseases at the single-cell transcriptome level. J Transl Med. 2022;20(1):363. doi:10.1186/s12967-022-03566-6
48. Mao J, Ma X. Bioinformatics identification of ferroptosis-associated biomarkers and therapeutic compounds in psoriasis. J Oncol. 2022;2022:3818216. doi:10.1155/2022/3818216
49. Lu L, Zhang B, Shi M, Liu A. Identification of panoptosis-related biomarkers and immune infiltration characteristics in psoriasis. Med. 2023;102(42):e35627. doi:10.1097/MD.0000000000035627
50. Zou A, Chen Y, Liu T, Yang T, Zhou B. Identification and verification of three autophagy-related genes as potential biomarkers for the diagnosis of psoriasis. Sci Rep. 2023;13(1):22918. doi:10.1038/s41598-023-49764-0
51. Bai S, Cheng H, Li H, Bo P. Integrated bioinformatics analysis identifies autophagy-associated genes as candidate biomarkers and reveals the immune infiltration landscape in psoriasis. Autoimmunity. 2024;57(1):2259137. doi:10.1080/08916934.2023.2259137
52. Shi R, Liang R, Wang F, et al. Identification and experimental validation of Pycard as a crucial panoptosis-related gene for immune response and inflammation in COPD. Apoptosis. 2024. doi:10.1007/s10495-024-01961-6
53. Su JQ, Tian X, Xu WH, et al. The Inflammasomes adaptor protein Pycard is a potential pyroptosis biomarker related to immune response and prognosis in clear cell renal cell carcinoma. Cancers. 2022;14(20):4992. doi:10.3390/cancers14204992
 © 2024 The Author(s). This work is published and licensed by Dove Medical Press Limited. The
full terms of this license are available at https://www.dovepress.com/terms.php
and incorporate the Creative Commons Attribution
- Non Commercial (unported, 3.0) License.
By accessing the work you hereby accept the Terms. Non-commercial uses of the work are permitted
without any further permission from Dove Medical Press Limited, provided the work is properly
attributed. For permission for commercial use of this work, please see paragraphs 4.2 and 5 of our Terms.
© 2024 The Author(s). This work is published and licensed by Dove Medical Press Limited. The
full terms of this license are available at https://www.dovepress.com/terms.php
and incorporate the Creative Commons Attribution
- Non Commercial (unported, 3.0) License.
By accessing the work you hereby accept the Terms. Non-commercial uses of the work are permitted
without any further permission from Dove Medical Press Limited, provided the work is properly
attributed. For permission for commercial use of this work, please see paragraphs 4.2 and 5 of our Terms.