")
Back to Journals » Journal of Inflammation Research » Volume 17
Investigation of Nutritional Factors and Malnutrition Risk Prediction Model in Hospitalized Patients with Systemic Lupus Erythematosus in China
Authors Xia L, Yang F, Hayashi N, Ma Y, Yan B, Du Y, Chen S, Xia Y, Feng F, Ma Z
Received 12 July 2024
Accepted for publication 7 November 2024
Published 16 November 2024 Volume 2024:17 Pages 8891—8904
DOI https://doi.org/10.2147/JIR.S486792
Checked for plagiarism Yes
Review by Single anonymous peer review
Peer reviewer comments 3
Editor who approved publication: Professor Ning Quan
Lijuan Xia,1,2,* Fanxing Yang,3,* Naoko Hayashi,2,* Yuan Ma,4 Bin Yan,4 Yingxin Du,5 Sujuan Chen,1 Yuke Xia,4 Fang Feng,6 Zhifang Ma1
1Department of Radiotherapy, General Hospital of Ningxia Medical University, Yinchuan, Ningxia, People’s Republic of China; 2Department of Oncology Nursing and Palliative Care/ Chronic Illness and Conditions Nursing, St. Luke’s International University, Tokyo, Japan; 3Department of Labor Delivery Recovery Postpartum, People’s Hospital of Zhengzhou, Zhengzhou, Henan, People’s Republic of China; 4Ningxia Medical University, Yinchuan, Ningxia, People’s Republic of China; 5Department of Clinical Nutrition, General Hospital of Ningxia Medical University, Yinchuan, Ningxia, People’s Republic of China; 6Department of Rheumatology and Immunology, General Hospital of Ningxia Medical University, Yinchuan, Ningxia, People’s Republic of China
*These authors contributed equally to this work
Correspondence: Lijuan Xia, Department of Radiotherapy, General Hospital of Ningxia Medical University, 804 Shengli South Street, Xingqing District, Yinchuan City, Ningxia, 750004, People’s Republic of China, Email [email protected]; [email protected], Fang Feng, Email [email protected]
Introduction: Nutritional status is a critical indicator of overall health and immune function, significantly influencing treatment outcomes. Despite its importance, the nutritional status of patients with systemic lupus erythematosus (SLE) often receives insufficient attention. This study aims to evaluate the nutritional status of patients with SLE, identify factors associated with malnutrition, and develop a risk prediction model for malnutrition in this population.
Methods: We collected clinical data from a convenience sample of SLE patients at a general hospital in Ningxia Province, China, between January and December 2022. Univariate and multivariate logistic regression analyses were performed to determine the independent risk factors for malnutrition. A risk prediction model was constructed and evaluated using the receiver operating characteristic (ROC) curve.
Results: This study included 420 patients with SLE (mean age: 41.43 years, 91.7% women), of whom 46.2% were malnourished based on their serum albumin levels. Multivariate logistic regression analysis identified monthly income (OR=0.192, P< 0.05), sleep quality (OR=2.559, P< 0.05), kidney involvement (OR=4.269, P< 0.05), disease activity (OR=2.743, P< 0.05), leukocyte count (OR=1.576, P< 0.05), lymphocyte count (OR=0.393, P< 0.05), hemoglobin (OR=0.972, P< 0.05), complement C3 (OR=0.802, P< 0.05), and complement C4 (OR=0.493, P< 0.05) as independent risk factors for malnutrition. The prediction model showed good predictive value with an area under the ROC curve of 0.895 (95% CI: 0.823– 0.840), sensitivity of 0.907, and specificity of 0.827. The Hosmer-Lemeshow test indicated a good model fit (χ²=10.779, P=0.215).
Discussion: Malnutrition is a significant concern among SLE patients, influenced by a range of socioeconomic and clinical factors. Our risk prediction model, with its high sensitivity and specificity, provides a robust tool for early identification of malnutrition in this population. Implementing this model in clinical practice can guide healthcare providers in prioritizing at-risk patients, enabling proactive nutritional interventions that could potentially improve clinical outcomes, enhance quality of life, and reduce healthcare costs associated with SLE.
Keywords: systemic lupus erythematosus, nutritional status, associated factors, malnutrition, risk prediction model, nomogram
Introduction
Systemic lupus erythematosus (SLE) is a chronic autoimmune disease characterized by its unpredictable course and multi system involvement, affecting vital organs such as the kidneys, skin, joints, hematopoietic system, and central nervous system.1 As the disease progresses, numerous complications may arise, further complicating management and treatment. Globally, the incidence of SLE has been increasing in recent years, posing significant challenges for healthcare systems worldwide.2 In particular, China bears a substantial burden of SLE, with one of the highest incidence rates, universally affecting more than 1 million people.3 The disease predominantly affects women of childbearing age, with a male-to-female ratio of approximately 1:10–12.4
The chronic nature of SLE profoundly impacts the physical and mental health of patients, often resulting in considerable economic burdens for individuals and society. Despite advances in treatment methods and techniques, SLE management remains complicated owing to the biological heterogeneity between patients and the lack of safe and specific targeted therapies. The mortality rate among SLE patients remains markedly elevated compared to that of the general population, underscoring the need for better management strategies.5
Nutrition plays a crucial role in supporting immune function, as nutritional status directly influences the performance of immune organs and cells.6 Therefore, maintaining good nutrition is essential for the proper functioning of the immune system. Malnutrition resulting from a combination of factors is a major concern in patients with SLE.7 Chronic inflammation associated with SLE leads to increased metabolic activity, exacerbating catabolic processes in affected individuals.8 Furthermore, gastrointestinal manifestations such as nausea and vomiting and diarrhea, which are often exacerbated during flare-ups, can compromise nutritional intake, resulting in deficiencies in essential nutrients, including proteins, vitamins, and minerals.9 Additionally, the long-term use of glucocorticoids, a mainstay in the treatment of SLE, can induce metabolic abnormalities, predisposing patients to conditions such as hypertension, diabetes mellitus, hyperlipidemia, and obesity. Studies have shown that the incidence of diabetes in SLE patients is 10.7–15.5%,10 that of hypertension is 14.0–60.0%,11 and that of dyslipidemia is 65.3–84.6%12.These comorbidities not only affect disease progression but also contribute to nutritional imbalances and subsequent complications. Kell et al found that although patients using glucocorticoids had increased body fat, their skeletal muscle tissue significantly decreased, causing sarcopenic obesity.13
Despite the high morbidity and mortality associated with SLE and its tendency to cause nutritional deficiencies, the role of nutritional management as a complementary intervention has not been thoroughly studied, and its relevant impacts have not yet been fully explored. Therefore, this study aimed to assess the nutritional status of patients with SLE, elucidate the factors influencing malnutrition, and construct a risk prediction model. This model could serve as a reference for developing comprehensive systemic strategies and programs aimed at improving the nutritional status of patients with SLE, delaying disease progression, and enhancing overall outcomes.
Materials and Methods
Patients
A convenience sample of patients with SLE was obtained from the Department of Rheumatology and Immunology of General Hospital of Ningxia Medical University, China, between January 2022 and November 2022 for this cross-sectional study, with inclusion criteria of individuals aged 18 years or older and a confirmed diagnosis of SLE based on the 1997 EULAR/ACR diagnostic criteria, and exclusion criteria including severe lupus encephalopathy or cognitive impairment, impaired communication, significant organ failure (such as heart, brain, or kidney), malignant tumors, and pregnancy or lactation.
Definitions
The diagnosis methods for malnutrition vary. In this study, we use serum album (ALB) < 35 g/L as the criterion for evaluating malnutrition, while ALB ≥ 35 g/L indicates normal nutrition.14
Data Collection
Each participant signed an informed consent form prior to participation. The data were collected using self-report questionnaires distributed to participants in a quiet and controlled environment two days after admission. Trained research staff explained each question to participants, who then independently recorded their responses. The questionnaires were collected and checked on the spot to ensure the integrity of the information. Medical records were also reviewed to corroborate the information and obtain additional clinical data.
The study surveyed various demographic and disease characteristics. Detailed demographic profiles, including age, sex, marital status, education level, and place of residence, were meticulously documented. Lifestyle factors, including sleep patterns and exercise frequency, were thoroughly examined. Disease-related variables, such as disease duration, treatment history, and comorbidities, were also comprehensively assessed.
Biochemical markers included serum album (ALB), leukocyte count, lymphocyte count, hemoglobin, blood potassium, blood sodium, blood chlorine, uric acid, creatinine, complement C3, complement C4, erythrocyte sedimentation rate, C-reactive protein, triglycerides, total cholesterol, high-density lipoprotein, and low-density lipoprotein.
The SLE Disease Activity Index 2000 (SLEDAI-2000) was used to evaluate disease activity. This assessment tool is a widely used indicator for assessing disease activity in SLE patients developed by Gladman in 2002.15 It included 24 items, such as seizure, psychosis, organic brain syndrome, visual disturbance, cranial nerve disorder, lupus headache, cerebrovascular accident, vasculitis, arthritis, myositis, urinary casts, hematuria, proteinuria, pyuria, new rash, alopecia, mucosal ulcers, pleurisy, pericarditis, low complement, increased DNA binding, fever, thrombocytopenia, and leukopenia. Scores on this index range from 0 to 105, with higher scores indicating greater disease activity and severity. Disease activity is classified as “inactive” for scores ranging from 0 to 4, “mildly active” for scores ranging from 5 to 9, “moderately active” for scores ranging from 10 to 14, and “severely active” for scores ranging from 15 or higher.
The Pittsburgh Sleep Quality Index (PSQI), developed by Buysse in 1989, was used to evaluate the overall sleep quality of individuals.16 This scale comprises 19 items categorized into seven factors: sleep quality, sleep onset latency, sleep duration, sleep efficiency, sleep disturbances, use of sleep medications, and daytime dysfunction. Each factor is rated on a 4-point scale ranging from 0 to 3, and the cumulative score for all factors yields the total PSQI score, which ranges from 0 to 21. Scores within 0–4 indicate good sleep quality, scores within 5–7 denote fair sleep quality, and scores of 8 or higher signify the presence of a sleep disorder. The scale demonstrated favorable reliability and validity, supported by a Cronbach’s alpha coefficient of 0.84.
Sample Size Estimation
The sample size for the survey was calculated using the formula for estimating the sample size of the overall rate which is shown as follows:  . α=0.05, According to the literature review, with ALB as the standard of evaluation, the overall incidence of malnutrition in patients with SLE was 53.9%.17 Therefore, in this study, the overall rate π was 0.539, the allowable error δ was 0.05, and the sample size was 380 patients; considering that 10% of the questionnaires were invalid, the sample size was 420 patients.
Data Analysis
Data analysis was performed using SPSS version 22.0. Descriptive statistics, including frequency, percentage, mean, and standard deviation, were used to describe the study variables. ANOVA was used to examine differences in nutritional status among participants with different demographics and disease profiles if the data followed a normal distribution. For data that did not conform to a normal distribution, the nonparametric rank sum test and Fisher’s exact probability test were used for comparison. Rank data were compared using the nonparametric rank-sum test, with a P value ≤ 0.05 indicating statistical significance.
Binary logistic regression was used for multifactorial analysis, with malnutrition status (0 = normal nutrition, 1 = malnutrition) among SLE patients as the dependent variable. Variables identified as statistically significant in the univariate analysis were included as independent variables in the binary logistic regression model to establish a prediction model for the risk of malnutrition. A nomogram was generated to visualize the results.
To validate the predictive performance of the model, receiver operating characteristic (ROC) curves and the Hosmer–Lemeshow test were used. The model’s ability to distinguish outcomes was assessed using the concordance index (C-index). Additionally, the bootstrap method was used to generate a calibration curve to evaluate the consistency between the predicted and actual results.
Results
Participant Characteristics
A total of 420 patients who were diagnosed with SLE and aged between 18 and 78 years were included in the study. The average age of the participants was 41.43 years (SD = 12.87). The majority of the participants were female (n = 385) and married (n = 344). More than half of the patients lived in urban areas (n = 231). Regarding educational level, 143 patients (34.0%) had completed elementary school or less, 96 patients (22.9%) had completed middle school, 71 patients (16.9%) had completed high school, and 110 patients (26.2%) had a college degree or higher.
Nutritional Status
The mean serum ALB concentration of the participants was 34.88±7.67 g/L; 226 patients had normal nutritional status (53.8%), and 194 patients had malnutrition (46.2%). Among the participants, 40 patients (9.5%) were classified as underweight (BMI<18.5 kg/m²), 206 patients (49.0%) had a normal weight (18.5≤BMI≤23.9 kg/m²), 93 patients (22.1%) were overweight (24.0≤BMI≤27.9 kg/m²), and 81 patients (19.3%) were obese (BMI ≥28.0 kg/m²) (Table 1).
 |
Table 1 Nutritional Status (n = 420) |
Univariate Analysis of Malnutrition
The results of the univariate analysis revealed several variables significantly associated with malnutrition in SLE patients (Table 2). Notably, patients with a higher education level, specifically those with a college degree or higher, demonstrated a lower incidence of malnutrition than did those with a primary school education or below (P = 0.038). Furthermore, the incidence of malnutrition was highest among patients with a monthly household income of less than 3000 yuan and lowest among those with a monthly household income of 5000 yuan or more (P < 0.001).
 |
Table 2 Univariate Analysis of Factors Associated with Malnutrition (n = 420) |
Additionally, patients who experienced sleep disorders exhibited a greater prevalence of malnutrition than did those with normal sleep patterns (P < 0.001). Regarding the duration of the disease, patients with a disease duration of less than 1 year had the highest incidence of malnutrition, while those with a duration of 10 years or more had the lowest incidence (P = 0.003).
Patients with comorbidities such as hypertension, hyperlipidemia, and metabolic syndrome were significantly more likely to experience malnutrition than were those without these conditions (P < 0.05). Moreover, patients with renal involvement, digestive system involvement, and infections exhibited a significantly greater incidence of malnutrition than did those without such complications (P < 0.05).
Malnutrition was most prevalent among patients with severe disease activity and least prevalent among those with no disease activity, with the difference being statistically significant (P < 0.001). Additionally, the type of treatment played a role: patients treated with pulse corticosteroid therapy had the highest incidence of malnutrition (83.3%), while those treated with low-dose corticosteroid had the lowest incidence (19.2%), with statistically significant differences observed (P < 0.001).
Comparison of Biochemical Markers
The patients were divided into normal nutrition and malnutrition groups based on their ALB levels. The analysis revealed several significant differences between these two groups detailed in Table 3. Specifically, patients in the malnutrition group exhibited significantly different leukocyte and lymphocyte counts, hemoglobin levels, and concentrations of blood potassium, sodium, chloride compared urea nitrogen, complement C3, complement C4, erythrocyte sedimentation rates, C-reactive protein levels, triglyceride levels, and high-density lipoprotein levels to those in the normal nutrition group (P < 0.05). On the other hand, no statistically significant differences were observed between the two groups for creatinine, total cholesterol, or low-density lipoprotein levels (P > 0.05).
 |
Table 3 Comparison of Biochemical Markers in SLE Patients [M (P25, P75)] |
Multivariate Analysis of Malnutrition
The results revealed that several factors significantly affect the nutritional status of SLE patients. These factors include monthly household income, sleep quality, renal involvement, disease activity, leukocyte count, lymphocyte count, hemoglobin level, and levels of complement C3 and C4. These findings, detailed in Table 4.
 |
Table 4 Logistic Regression Analysis of Factors Associated with Malnutrition in SLE Patients |
Construction of the Risk Prediction Model and Nomogram
Based on the results of the binary logistic regression analysis, a risk prediction model for malnutrition was established as follows: logit P=11.2−1.653× (monthly family income≥5000 yuan) +0.940× (sleep disorders) +1.451× (renal involvement) +1.009× (severe disease activity) +0.455× (leukocyte count) −0.935× (lymphocyte count) −0.029×(hemoglobin)−0.220× (complement C3) −0.914× (complement C4).
The nomogram is shown in Figure 1. The nomogram model indicates the following scoring system: monthly family income <5000 yuan is assigned 0 points, while monthly family income <3000 yuan is assigned 22.5 points; good sleep quality is assigned 0 points, while sleep disorders are assigned 20 points; no renal involvement is assigned 0 points, while renal involvement is assigned 10 points; minimal disease activity is assigned 0 points, while severe disease activity is assigned 20 points; for leukocyte count, 0×109/L is assigned 0 points, with an additional 10 points for every increase of 2×10⁹/L; for lymphocyte count, 3.5×10⁹/L is assigned 0 points, with an additional 7.5 points for every decrease of 0.5×10⁹/L; for hemoglobin, 180 g/L is assigned 0 points, with an additional 5 points for every decrease of 10 g/L; for complement C3, 2 g/L is assigned 0 points, with an additional 7.5 points for every decrease of 0.2 g/L; for complement C4, 1.2 g/L is assigned 0 points. Each variable corresponds to a point on the nomogram variable axis. Each variable corresponds to a point on the variable axis of the nomogram. A vertical line was drawn from this point to the scoring scale to obtain the score for that variable. The scores of all variables are summed to obtain the total score. The total score corresponds to a point on the malnutrition risk axis, which represents the patient’s risk of developing malnutrition.
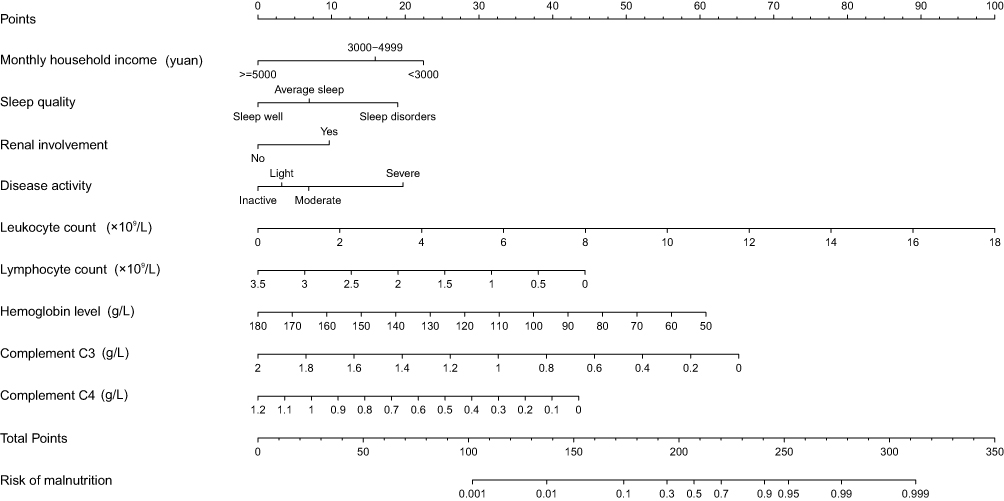 |
Figure 1 Nomogram Model for Predicting Malnutrition Risk in SLE Patients. Each variable on the nomogram corresponds to a point on the variable axis. A vertical line drawn from this point to the scoring scale provides the score for that variable. Summing the scores yields a total score, which indicates the patient’s risk of malnutrition on the malnutrition risk axis. |
Validation of the Risk Prediction Nomogram Model
The area under the ROC curve was 0.895 (95% CI: 0.823–0.840), with an optimal cutoff value of 0.370. The sensitivity and specificity were 0.907 and 0.827, respectively, indicating good differentiation ability of the model, as shown in Figure 2. The Hosmer‒Lemeshow goodness-of-fit test yielded χ2=10.779, P=0.215, suggesting a good fit of the model. The consistency index (C-index) of the model was 0.895, with a standard deviation of 0.031. The bootstrap resampling method was used to resample the data 1000 times. The calibration curve is a straight line with a slope close to 1, indicating that the nomogram model predicts the incidence of malnutrition in SLE patients with good consistency with the actual results. This demonstrates that the model has good calibration ability, as shown in Figure 3.
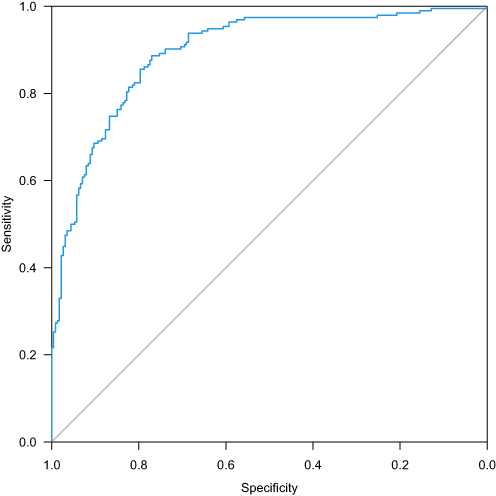 |
Figure 2 ROC Curve of the Nomogram Model for Predicting Malnutrition in SLE Patients. |
 |
Figure 3 Calibration Curve of the Nomogram Model for Predicting Malnutrition in SLE Patients. This calibration curve illustrates the model’s strong calibration ability. The bootstrap method involved resampling the dataset with replacement 1,000 times to generate multiple simulated samples. |
Discussion
Our investigation demonstrated that 46.2% of the population suffers from malnutrition. Wu et al reported a 47.5% prevalence of malnutrition in hospitalized SLE patients aged ≥11 years using the Global Nutrition Leadership Initiative evaluation, closely aligning with our findings.18 Similarly, Ruan et al reported a 46.5% malnutrition rate in hospitalized SLE patients aged ≥11 years according to BMI.19 The slight discrepancies between these studies may be attributed to variations in sample selection and the different nutritional assessment tools used. This research indicated that the nutritional status of SLE patients is unpromising.
The study revealed a significant prevalence of overweight and obesity among SLE patients, reaching 42.4%. This finding aligns with findings from various studies conducted globally. Borges et al reported that 35.3% of SLE outpatient were overweight, with 27.7% obese in Brazil.20 Pocovi et al reported that 43.48% of stable outpatient SLE patients were either overweight or obese in Spain.21 Meza et al observed similar trends in Mexico, with 38.46% of SLE patients being overweight and 31.54% being obese.22 Petrić et al noted an average BMI of 24.1 kg/m² among remission SLE patients in Germany, indicating overweight status.23 Malnutrition in SLE patients can manifest differently from that in general patients. While low protein levels are a common manifestation of malnutrition, SLE patients may also experience obesity and overweight at the same time. This phenomenon may be attributed to the complex pathophysiological processes in SLE, including chronic inflammation, medication effects, and immune dysregulation. The inflammatory response involves the production of proinflammatory cytokines such as interleukin-1 (IL-1) and interleukin-6 (IL-6) by the body in response to stimulation by inflammatory substances. This leads to abnormal synthesis of acute phase response proteins by liver cells, resulting in elevated levels of C-reactive protein (CRP) and decreased levels of ALB, prealbumin, and transferrin. This exacerbates the systemic inflammatory response, leading to increased metabolic levels and energy expenditure in the body.24 The long-term use of corticosteroids can promote the hypertrophy of adipocytes and increase adipogenesis by stimulating the differentiation of preadipocytes into mature adipocytes, leading to lipid metabolism disorders, increased visceral fat, and central obesity.25 Both innate and adaptive immune mechanisms are involved in the development of SLE, which leads to the activation of multiple cell types, inflammatory cascades, complex immunological networks and eventually end-organ tissue damage.26 This highlights the need for comprehensive nutritional assessment and management in SLE patients, taking into account the multifactorial nature of malnutrition in this population.
Furthermore, our study revealed that up to 29.0% of patients met the criteria for metabolic syndrome (MetS) according to the International Diabetes Federation’s specific criteria for Asian populations.27 Additionally, 15.7% of patients with low ALB levels were found to have comorbid MetS. The exact etiology underlying the association between SLE and MetS is not fully understood. However, several factors may contribute to the development of MetS in patients with SLE. First, SLE is characterized by dysregulated immune responses and chronic inflammation, resulting in insulin resistance, dyslipidemia, and hypertension, which are all key components of MetS. Inflammatory cytokines such as tumor necrosis factor-alpha (TNF-α), IL-6, and IL-1 produced in patients with SLE disrupt insulin signaling pathways, impair glucose metabolism, and promote dyslipidemia.28,29 Additionally, both SLE and MetS have strong genetic components, with shared genetic factors predisposing individuals to develop both conditions.30,31 The medications used to manage SLE, such as corticosteroids and immunosuppressants, can affect metabolic parameters. Long-term use of corticosteroid results in insulin resistance and lipid metabolism disorders, ultimately leading to central obesity, a feature of MetS. Last, lifestyle factors such as sedentary behavior and unhealthy dietary habits exacerbate metabolic risk factors.32 These multifaceted factors collectively contribute to the complex interplay between SLE and MetS.33
High monthly household income (≥5000 RMB) was identified as a protective factor against malnutrition in SLE patients (P < 0.001, OR=0.192), which aligns with studies by Versini and Sumner.34,35 The treatment of SLE requires regular hospital visits and long-term medication regimens that impose significant financial burdens on families, potentially leading to impoverishment or the recurrence of poverty. Financial constraints can lead to poor compliance with long-term management, as patients may prioritize short-term treatment outcomes and overlook relative health risks of malnutrition.
Sleep disorders emerged as a significant risk factor for malnutrition in SLE patients (P=0.016, OR=2.559), consistent with findings by Mirbagher et al, emphasizing the role of prolonged sleep disorders in contributing to malnutrition in individuals with SLE.36 Sleep plays a pivotal role in regulating overall health, and studies have indicated a close relationship between sleep quality and various aspects of physical and mental well-being.37 Adequate sleep promotes immune function, whereas sleep disturbances can lead to decreased levels of certain immunoglobulins, complement components, and T lymphocyte subsets, compromising immune competence, increasing susceptibility to infections, and impeding nutrient absorption and disease recovery.38 Furthermore, sleep disorders disrupt immune responses, imbalanced proinflammatory and anti-inflammatory cytokines, heightened inflammatory responses, and increased energy expenditure, consequently leading to malnutrition.38,39
Renal involvement was another significant risk factor for malnutrition in SLE patients (P = 0.007, OR = 4.269) indicated in this study. Chronic or acute inflammatory responses may compromise the glomerular filtration barrier, inducing significant proteinuria. Excess loss of urinary protein reduces plasma colloid osmotic pressure, stimulating hepatocyte synthesis of albumin and increasing lipoprotein synthesis, resulting in hyperlipidemia.40 Furthermore, patients with renal involvement experience abnormal protein metabolism with reduced protein synthesis and absorption, leading to an altered distribution of proteins in the body.7 Patients with renal involvement often develop damage to blood vessel walls and tissues, leading to significant protein loss. These factors could all result in malnutrition and weakened immune responses, making patients highly susceptible to infections.41,42
Severe disease activity was identified as a determinant of malnutrition in SLE patients (P = 0.049, OR = 2.743), consistent with previous research. The heightened disease activity in SLE patients may lead to increased vulnerability to infections and an increase in inflammatory reactions. Inflammatory processes may reduce the synthesis rate of albumin while simultaneously increasing metabolic rate. Consequently, the concentration of ALB decreases, potentially resulting in malnutrition.21 This interplay between disease activity, susceptibility to infections, inflammation, and altered protein metabolism underscores the complex relationship between SLE and nutritional status, highlighting the importance of comprehensive management strategies for SLE patients.43
The correlation between decreased hemoglobin levels and malnutrition in SLE patients was confirmed by the present study (P = 0.002, OR = 0.972), consistent with the findings of Wu et al.18 A reduced hemoglobin content may hinder iron binding and transport functions, exacerbating malnutrition in patients with SLE. Anemia is one of the most common clinical manifestations of SLE, and the cytokines tumor necrosis factor-α, interferon-γ, IL-1, and IL-6 secreted by T cells and macrophages in patients with SLE are the main causes of anemia in SLE patients. These cytokines activate the complement system, leading to inflammatory responses in the body. Proinflammatory cytokines can interfere with erythropoiesis-stimulating factors, affect iron metabolism, and thus inhibit compensatory bone marrow responses.44
Elevated leukocyte count (P<0.001, OR=1.576) and decreased lymphocyte count (P=0.004, OR=0.393) are risk factors for malnutrition in SLE patients. Elevated leukocyte counts in SLE patients are often associated with infections.45,46 Following infection, the body enters a state of stress, exacerbating inflammatory responses and leading to metabolic disturbances and increased consumption. This stress response may also diminish appetite and reduce food intake, thereby negatively affecting the body’s nutritional balance.47 Additionally, a decreased lymphocyte count in SLE patients indicates increased disease activity and inflammatory responses.48 The confluence of these factors creates a vicious cycle: elevated circulating cytokines trigger the activation of protein breakdown metabolism, resulting in weight loss and ultimately culminating in malnutrition. This cascade of events underscores the intricate interplay between inflammatory processes, metabolic disturbances, and nutritional status in individuals with SLE.49 Addressing these interconnected pathways is paramount in breaking this cycle and mitigating the adverse effects on patients’ health and well-being.
Decreased levels of complement C3 (P<0.001, OR=0.802) and complement C4 (P=0.001, OR=0.493) were notable risk factors for malnutrition in SLE patients. This phenomenon might be linked to the heightened disease activity in patients with SLE. Complement proteins, which are essentially proteins found in both serum and tissue fluids, exhibit enzymatic activity upon activation and play a role in mediating immune responses and inflammation.50 In instances of increased disease activity and infections in SLE, substantial amounts of immune complexes are deposited in tissue organs. This prompts the activation of the complement system through the alternative pathway to clear these immune complexes, leading to significant depletion of complement C3 and C4 and their deposition on the skin’s basement membrane.51 Furthermore, complement synthesis primarily occurs in the liver, and when the liver is affected by SLE, its capacity to synthesize proteins diminishes, resulting in decreased synthesis of complement C3 and C4.52
The fit of the nomogram model was evaluated using the Hosmer‒Lemeshow test for goodness-of-fit, which indicated no statistically significant differences, suggesting strong agreement between the model’s predictions and the observed incidence of malnutrition. ROC curve analysis was utilized to evaluate the predictive performance of the model. The results revealed an area under the curve of 0.895, with an optimal cutoff value of 0.370. Interestingly, the model demonstrated a sensitivity of 90.7% and a specificity of 82.7%, indicating favorable sensitivity and specificity. A cutoff value ≥0.370 suggests a high probability of malnutrition in patients, highlighting the need for healthcare professionals to systematically assess disease progression and monitor nutritional status. As the cutoff value approaches 0.370, healthcare professionals should increase their vigilance, develop proactive nursing strategies, and ensure adequate nutritional support for patients. Internal validation using the bootstrap method and calculation of the C index demonstrated that the model’s predictive calibration curve was closely aligned with the ideal curve, indicating the strong predictive ability and precision of the model. Integrating this risk prediction model into clinical practice could facilitate the early identification of SLE patients at high risk of malnutrition, allowing for targeted interventions to prevent malnutrition and improve both quality of life and clinical outcomes.
Strengths and Limitations of the Study
This study offers a comprehensive and insightful exploration of the intricate interplay between malnutrition, inflammation, and immune dysregulation in patients with systemic lupus erythematosus (SLE. It elucidated several factors—such as lifestyle, medication use, and comorbidities—that can influence the nutritional status of SLE patients. Furthermore, it identified both undernutrition and conditions like sarcopenic obesity and metabolic syndrome among these individuals, underscoring the necessity for thorough nutritional assessments. Collectively, the findings have significant implications for enhancing nutritional support and immunomodulatory therapies in SLE.
However, this study acknowledges certain limitations. Notably, the risk prediction model has only undergone internal validation and has yet to be externally validated. A significant factor contributing to this is that many SLE patients admitted to the hospital presented with concurrent COVID-19 conditions following the easing of restrictions last year, which hindered the study’s progress. We are currently working on collecting data for external validation to enhance the robustness of our findings.
Conclusions
Patients with SLE exhibit a heightened incidence of malnutrition, which is influenced by a multitude of interrelated factors, including socioeconomic status, disease activity, and specific laboratory markers. This study identified individuals with monthly family incomes less than 3000 yuan (420 USD), sleep disturbances, renal complications, severe disease activity, elevated leukocyte counts, decreased lymphocyte counts, decreased hemoglobin levels, and reduced complement C3/C4 levels as high-risk individuals for special monitoring. The developed malnutrition risk prediction model based on these factors provides a valuable tool for healthcare professionals to identify at-risk patients and implement targeted nutritional interventions. Given the multifaceted nature of malnutrition in SLE patients, comprehensive interventions emphasizing prevention and management are essential for high-risk, high-needed patients. A multimodal approach should be adopted to achieve optimal outcomes. Integrating the relative management strategies of these findings into clinical practice has the potential to improve the overall outcomes and quality of life of SLE patients, filling an important gap in the management of this complex and challenging disease.
Ethics Approval and Informed Consent
The study protocol was reviewed and approved by Ethics Committee of General Hospital of Ningxia Medical University, China (Approval Code: KYLL-2022-0341). The study was conducted in accordance with the Declaration of Helsinki. Informed consent was obtained from all participants prior to their inclusion in the study.
Author Contributions
All authors made a significant contribution to the work reported, whether that is in the conception and design, data acquisition, or data analysis and interpretation, participated in the drafting of the article or critically revising it for important intellectual content, agreed to submit to the current journal, gave final approval for the version to be published, and agreed to be accountable for all aspects of the work.
Funding
This research was supported by Key Research and Development Plan of Ningxia, grant number 2023BEG03006. The funding body had no role in the design of the study, data collection, analysis, interpretation, or in writing the manuscript.
Disclosure
The authors report no conflicts of interest in this work.
References
1. Moulton VR, Suarez-Fueyo A, Meidan E, Li H, Mizui M, Tsokos GC. Pathogenesis of Human Systemic Lupus Erythematosus: a Cellular Perspective. Trends Mol Med. 2017;23(7):615–635. doi:10.1016/j.molmed.2017.05.006
2. Mu L, Hao Y, Fan Y, et al. Mortality and prognostic factors in Chinese patients with systemic lupus erythematosus. Lupus. 2018;27(10):1742–1752. doi:10.1177/0961203318789788
3. Correa-Rodríguez M, Pocovi-Gerardino G, Callejas-Rubio JL, et al. The Prognostic Nutritional Index and Nutritional Risk Index Are Associated with Disease Activity in Patients with Systemic Lupus Erythematosus. Nutrients. 2019;11(3):638. doi:10.3390/nu11030638
4. Barber MRW, Drenkard C, Falasinnu T, et al. Global epidemiology of systemic lupus erythematosus. Nat Rev Rheumatol. 2021;17(9):515–532. doi:10.1038/s41584-021-00668-1
5. Tian J, Zhang D, Yao X, Huang Y, Lu Q. Global epidemiology of systemic lupus erythematosus: a comprehensive systematic analysis and modelling study. Ann Rheum Dis. 2023;82(3):351–356. doi:10.1136/ard-2022-223035
6. gen LW, Zhong YZ, hua YZ, Zhang K. Clinical and immunological characteristics in 552 systemic lupus erythematosus patients in a southern province of China. Int J Rheum Dis. 2017;20(1):68–75. doi:10.1111/1756-185X.12480
7. Jiao H, Acar G, Robinson GA, Ciurtin C, Jury EC, Kalea AZ. Diet and Systemic Lupus Erythematosus (SLE): from Supplementation to Intervention. IJERPH. 2022;19(19):11895.
8. Fortuna G, Brennan MT. Systemic Lupus Erythematosus. Dental Clinic North Amer. 2013;57(4):631–655. doi:10.1016/j.cden.2013.06.003
9. Tejera Segura B, Altabás González I, Rúa-Figueroa I, et al. Relevance of gastrointestinal manifestations in a large Spanish cohort of patients with systemic lupus erythematosus: what do we know? Rheumatology. 2021;60(11):5329–5336. doi:10.1093/rheumatology/keab401
10. García-Carrasco M, Mendoza-Pinto C, Munguía-Realpozo P, et al. Insulin Resistance and Diabetes Mellitus in Patients with Systemic Lupus Erythematosus. EMIDDT. 2023;23(4):503–514. doi:10.2174/1871530322666220908154253
11. Munguia-Realpozo P, Mendoza-Pinto C, Sierra Benito C, et al. Systemic lupus erythematosus and hypertension. Autoimmunity Rev. 2019;18(10):102371. doi:10.1016/j.autrev.2019.102371
12. Huang S, Zhang Z, Cui Y, Yao G, Ma X, Zhang H. Dyslipidemia is associated with inflammation and organ involvement in systemic lupus erythematosus. Clin Rheumatol. 2023;42(6):1565–1572. doi:10.1007/s10067-023-06539-2
13. Kelly O, Gilman J, Boschiero D, Ilich J. Osteosarcopenic Obesity: current Knowledge, Revised Identification Criteria and Treatment Principles. Nutrients. 2019;11(4):747. doi:10.3390/nu11040747
14. Keller U. Nutritional Laboratory Markers in Malnutrition. JCM. 2019;8(6):775. doi:10.3390/jcm8060775
15. Gladman DD, Ibañez D, Urowitz MB. Systemic lupus erythematosus disease activity index 2000. J Rheumatol. 2002;29(2):288–291.
16. Buysse DJ, Reynolds CF, Monk TH, Berman SR, Kupfer DJ. The Pittsburgh Sleep Quality Index: a new instrument for psychiatric practice and research. Psychiatry Res. 1989;28(2):193–213. doi:10.1016/0165-1781(89)90047-4
17. Zheng D, Li T. Progress of Correlation between Nutrition and Systemic Lupus Erythematosus. J Pediatr Pharm. 2021;27(8):54–58.
18. Wu C, Yan Q, Wei Q, Gao F. Application of body composition assessment in diagnosing malnutrition among systemic lupus erythematosus. J Jiangsu Univers.
19. Ruan Y, Wan Y, Xu R. Nutritional evaluation and related factors in hospitlized patients with systemic lupus erythematosus. Parenter EnteralNutr. 15(5):288–291.
20. Borges MC, Santos FDMM D, Telles RW, Lanna CCD, MITD C. Nutritional status and food intake in patients with systemic lupus erythematosus. Nutrition. 2012;28(11–12):1098–1103. doi:10.1016/j.nut.2012.01.015
21. Pocovi-Gerardino G, Correa-Rodríguez M, Callejas-Rubio JL, Ríos-Fernández R, Ortego-Centeno N, Rueda-Medina B. Dietary intake and nutritional status in patients with systemic lupus erythematosus. Endocrinolog Diab Nutrición. 2018;65(9):533–539. doi:10.1016/j.endinu.2018.05.009
22. Meza-Meza MR, Vizmanos-Lamotte B, Muñoz-Valle JF, et al. Relationship of Excess Weight with Clinical Activity and Dietary Intake Deficiencies in Systemic Lupus Erythematosus Patients. Nutrients. 2019;11(11):2683. doi:10.3390/nu11112683
23. Petrić M, Božić J, Radić M, Perković D, Petrić M, Martinović Kaliterna D. Dietary Habits in Patients with Systemic Lupus Erythematosus. Journal of Medicinal Food. 2020;23(11):1176–1182. doi:10.1089/jmf.2019.0227
24. Zhu L, Zhou S, Lin Y, Zhen Y, Tang Y, Chen R. Inflammatory mediators and immune function in different stages of systemic lupus erythematosus. Cell Mol Biol. 2023;69(2):150–156. doi:10.14715/cmb/2023.69.2.25
25. Fardet L, Cabane J, Lebbé C, Morel P, Flahault A. Incidence and risk factors for corticosteroid-induced lipodystrophy: a prospective study. J Am Acad Dermatol. 2007;57(4):604–609. doi:10.1016/j.jaad.2007.04.018
26. Psarras A, Clarke A. A cellular overview of immunometabolism in systemic lupus erythematosus. Oxford Open Immunol. 2023;4(1):iqad005. doi:10.1093/oxfimm/iqad005
27. Alberti KGMM, Zimmet P, Shaw J. Metabolic syndrome—a new world‐wide definition. A Consensus Statement from the International Diabetes Federation. Diabetic Med. 2006;23(5):469–480. doi:10.1111/j.1464-5491.2006.01858.x
28. Wang L, Qin X, Zhang Y, Xue S, Song X. The prognostic predictive value of systemic immune index and systemic inflammatory response index in nasopharyngeal carcinoma: a systematic review and meta-analysis. Front Oncol. 2023;13:1006233. doi:10.3389/fonc.2023.1006233
29. Terrell M, Morel L. The Intersection of Cellular and Systemic Metabolism: metabolic Syndrome in Systemic Lupus Erythematosus. Endocrinology. 2022;163(7):bqac067. doi:10.1210/endocr/bqac067
30. Perricone C, High Fat Diet CF. Metabolic Syndrome and Systemic Lupus Erythematosus: a Causal Loop. MJR. 2020;31(2):172. doi:10.31138/mjr.31.2.172
31. Corona-Meraz FI, Vázquez-Del Mercado M, Sandoval-García F, et al. Biomarkers in Systemic Lupus Erythematosus along with Metabolic Syndrome. JCM. 2024;13(7):1988. doi:10.3390/jcm13071988
32. Tsoi A, Gomez A, Boström C, et al. Efficacy of lifestyle interventions in the management of systemic lupus erythematosus: a systematic review of the literature. Rheumatol Int. 2024;44(5):765–778. doi:10.1007/s00296-024-05548-x
33. Hallajzadeh J, Khoramdad M, Izadi N, et al. The association between metabolic syndrome and its components with systemic lupus erythematosus: a comprehensive systematic review and meta-analysis of observational studies. Lupus. 2018;27(6):899–912. doi:10.1177/0961203317751047
34. Versini M, Tiosano S, Comaneshter D, Shoenfeld Y, Cohen AD, Amital H. Smoking and obesity in systemic lupus erythematosus: a cross‐sectional study. Eur J Clin Investigation. 2017;47(6):422–427. doi:10.1111/eci.12757
35. Sumner LA, Olmstead R, Azizoddin DR, et al. The contributions of socioeconomic status, perceived stress, and depression to disability in adults with systemic lupus erythematosus. Disability Rehabil. 2020;42(9):1264–1269. doi:10.1080/09638288.2018.1522550
36. Mirbagher L, Gholamrezaei A, Hosseini N, Sayed Bonakdar Z. Sleep quality in women with systemic lupus erythematosus: contributing factors and effects on health‐related quality of life. Int J of Rheum Dis. 2016;19(3):305–311. doi:10.1111/1756-185X.12418
37. Asif N, Iqbal R, Nazir CF. Human immune system during sleep. Am J Clin Exp Immunol. 2017;6(6):92–96.
38. Irwin MR, Opp MR. Sleep Health: reciprocal Regulation of Sleep and Innate Immunity. Neuropsychopha. 2017;42(1):129–155.
39. Xerfan EMS, Andersen ML, Tomimori J, Tufik S, Facina AS. The role of sleep in the activity of lupus erythematosus: an overview of this possible relationship. Rheumatology. 2021;60(2):483–486. doi:10.1093/rheumatology/keaa744
40. Flores-Mendoza G, Sansón SP, Rodríguez-Castro S, Crispín JC, Rosetti F. Mechanisms of Tissue Injury in Lupus Nephritis. Trends Mol Med. 2018;24(4):364–378. doi:10.1016/j.molmed.2018.02.003
41. Lichtnekert J, Anders HJ, Lech M. Lupus Nephritis: current Perspectives and Moving Forward. JIR. 2022;15:6533–6552. doi:10.2147/JIR.S363722
42. Tan Y, Yu F, Liu G. Diverse vascular lesions in systemic lupus erythematosus and clinical implications Curre Opini Nephro Hyperten. 2014;23(3):218–223. doi:10.1097/01.mnh.0000444812.65002.cb
43. Ameer MA, Chaudhry H, Mushtaq J, et al. An Overview of Systemic Lupus Erythematosus (SLE) Pathogenesis, Classification, and Management. Cureus. Available from: https://www.cureus.com/articles/114743-an-overview-of-systemic-lupus-erythematosus-sle-pathogenesis-classification-and-management.
44. Islam MA, Khandker SS, Kotyla PJ, Hassan R. Immunomodulatory Effects of Diet and Nutrients in Systemic Lupus Erythematosus (SLE): a Systematic Review. Front Immunol. 2020;11:1477. doi:10.3389/fimmu.2020.01477
45. Thanou A, Jupe E, Purushothaman M, Niewold TB, Munroe ME. Clinical disease activity and flare in SLE: current concepts and novel biomarkers. J Autoimmun. 2021;119:102615. doi:10.1016/j.jaut.2021.102615
46. Lou H, Wojciak-Stothard B, Ruseva MM, et al. Autoantibody-dependent amplification of inflammation in SLE. Cell Death Dis. 2020;11(9):729. doi:10.1038/s41419-020-02928-6
47. Martin M, Guffroy A, Argemi X, Martin T. Lupus érythémateux systémique et lymphopénie: aspects cliniques et physiopathologiques. La Revue de Médecine Interne. 2017;38(9):603–613. doi:10.1016/j.revmed.2017.01.005
48. Qin B, Ma N, Tang Q, et al. Neutrophil to lymphocyte ratio (NLR) and platelet to lymphocyte ratio (PLR) were useful markers in assessment of inflammatory response and disease activity in SLE patients. Mod Rheum. 2016;26(3):372–376. doi:10.3109/14397595.2015.1091136
49. Yap DYH, Lai KN. Cytokines and Their Roles in the Pathogenesis of Systemic Lupus Erythematosus: from Basics to Recent Advances. J Biomed Biotechnol. 2010;2010:1–10. doi:10.1155/2010/365083
50. Delanghe JR, Speeckaert R, Speeckaert MM. Complement C3 and its polymorphism: biological and clinical consequences. Pathology. 2014;46(1):1–10. doi:10.1097/PAT.0000000000000042
51. Weinstein A, Alexander RV, Zack DJ. A Review of Complement Activation in SLE. Curr Rheumatol Rep. 2021;23(3):16. doi:10.1007/s11926-021-00984-1
52. Sandhu V, Quan M. SLE and Serum Complement: causative, Concomitant or Coincidental? TORJ. 2017;11(1):113–122. doi:10.2174/1874312901711010113
 © 2024 The Author(s). This work is published and licensed by Dove Medical Press Limited. The
full terms of this license are available at https://www.dovepress.com/terms.php
and incorporate the Creative Commons Attribution
- Non Commercial (unported, 3.0) License.
By accessing the work you hereby accept the Terms. Non-commercial uses of the work are permitted
without any further permission from Dove Medical Press Limited, provided the work is properly
attributed. For permission for commercial use of this work, please see paragraphs 4.2 and 5 of our Terms.
© 2024 The Author(s). This work is published and licensed by Dove Medical Press Limited. The
full terms of this license are available at https://www.dovepress.com/terms.php
and incorporate the Creative Commons Attribution
- Non Commercial (unported, 3.0) License.
By accessing the work you hereby accept the Terms. Non-commercial uses of the work are permitted
without any further permission from Dove Medical Press Limited, provided the work is properly
attributed. For permission for commercial use of this work, please see paragraphs 4.2 and 5 of our Terms.